Article Text

Abstract
Background Mutations in OPA3 have been reported in patients with autosomal dominant optic atrophy plus cataract and Costeff syndrome. Here, we report the results of a comprehensive study on OPA3 mutations, including the mutation spectrum and its prevalence in a large cohort of OPA1-negative autosomal dominant optic atrophy (ADOA) patients, the associated clinical phenotype and the functional characterisation of a newly identified OPA3 mutant.
Methods Mutation analysis was carried out in a patient cohort of 121 independent ADOA patients. To characterise a novel OPA3 mutation, we analysed the mitochondrial import, steady-state levels and the mitochondrial localisation of the mutated protein in patients’ fibroblasts. Furthermore, the morphology of mitochondria harbouring the mutated OPA3 was monitored.
Results We identified four independent cases (representing families with multiple affected members) with OPA3 mutations. Besides the known p.Q105E mutation, we observed a novel insertion, c.10_11insCGCCCG/p.V3_G4insAP which is located in the mitochondrial presequence. Detailed functional analysis of mitochondria harbouring this novel mutation demonstrates a fragmented mitochondrial network with a decreased mitochondrial mass in patient fibroblasts. In addition, quantification of the OPA3 protein reveals decreased steady-state levels of the mutant protein compared with the native one. Comparison of the clinical phenotypes suggests that OPA3 mutations can additionally evoke hearing loss and by that extend the clinical manifestation of OPA3-associated optic atrophy. This finding is supported by expression analysis of OPA3 in murine cochlear tissue.
Conclusions In summary, our study provides new insights into the clinical spectrum and the pathogenesis of dominant optic atrophy caused by mutations in the OPA3 gene.
- Optic Atrophy
- OPA3
- Mitochondria
Statistics from Altmetric.com
Introduction
Hereditary optic neuropathies represent a heterogeneous group of diseases that are characterised by retinal ganglion cell degeneration and optic nerve atrophy. A rare form of hereditary optic atrophy is caused by mutations in the OPA3 gene. Homozygous loss-of-function mutations lead to Type III 3-methylglutaconic aciduria (MGA III), also known as Costeff syndrome, a neuro-ophthalmologic disease characterised by infantile bilateral optic atrophy, later-onset spasticity, extrapyramidal dysfunction, ataxia, cognitive deficit and increased urinary excretion of 3-methylglutaconic acid and 3-methylglutaric acid.1–3 In addition, mutations in OPA3 can also act in a dominant way and cause autosomal dominant optic atrophy plus cataract (ADOAC). In some of those patients, additional neurological symptoms such as extrapyramidal signs and ataxia have been reported.4
OPA3 is widely expressed with two different isoforms, OPA3A (exon 1 + exon 2) and OPA3B (exon 1 + exon 3), whereas OPA3A is much strongly expressed compared with OPA3B.5 The functional and biological role of OPA3 are still unclear; however, the presence of a putative N-terminal mitochondrial targeting sequence (MTS, amino acids 1–18) indicates its import into mitochondria.5 ,6 The intramitochondrial localisation of OPA3 is discussed controversially: MitoRes and MITOP both list OPA3 as a mitochondrial inner membrane (MIM) protein,5 ,7 whereas Ryu and colleagues suggest that OPA3 is anchored in the mitochondrial outer membrane (MOM).6 Overexpression of OPA3 in HeLa cells leads to an extensive fragmentation of mitochondria, whereas siRNA-mediated downregulation of OPA3 in these cells results in more elongated and tubular mitochondria,6 suggesting an involvement of OPA3 in the regulation of mitochondrial morphology. However, fibroblasts from an ADOAC patient with the dominant c.277G>A mutation located in exon 2 showed no abnormalities in the respiratory chain, mitochondrial membrane potential (MMP) or in mitochondrial network morphology.8
Here, we report the identification of four families with dominant-acting OPA3 mutations, including a novel mutation in the first exon of the OPA3 gene that results in two additional amino acid residues in the MTS. To characterise this novel mutation, we analysed the mitochondrial import, the steady-state levels and the mitochondrial localisation of the mutated protein in patients’ fibroblasts. Furthermore, the morphology of mitochondria harbouring the mutated OPA3 was monitored.
In addition, we showed for the first time that two out of four families with heterozygous OPA3 mutations represent a hearing loss. This observation not only broadens the clinical spectrum of OPA3-related autosomal dominant optic atrophy (ADOA), but also underscores a typical mitochondrial phenotype.
Materials and methods
Patients and genetic analyses
All patients included in this study were recruited at different ophthalmic institutions with a clinical diagnosis of ADOA or ADOAC based on ophthalmological examinations. The study was performed in accordance with the Declaration of Helsinki and was approved by the local ethical committee. Genomic DNA was extracted using standard procedures and all three coding exons and flanking intronic sequences of the OPA3 gene were amplified by PCR (see online supplementary table S1) using Big Dye Terminator Chemistry (Applied Biosystems, Darmstadt, Germany) and separated on an ABI 3100 DNA Sequencer. Haplotype analysis was performed using microsatellite D19S219 and an single nucleotide polymorphism (SNP) located in exon 2 (c.231C>T; p.A77A). For reverse transcription-polymerase chain reaction (RT-PCR) analysis, RNA was isolated using the PAXgene blood RNA Kit (Qiagen, Hilden, Germany) or the Trizol reagent (Life Technologies, Eggenstein, Germany). Random-primed RNA (up to 1 µg) was reverse transcribed using the Transcriptor High Fidelity cDNA Synthesis Kit (Roche, Mannheim, Germany) according to the manufacturer’s recommendations. Primer sets were designed to differ between the two OPA3 isoforms (see online supplementary table S2).
Immunostaining and immunofluorescence microscopy
Human fibroblasts were used for immunocytochemistry and western blot analyses and proteins were detected using antibodies against OPA3 (E15, sc-82004; Santa Cruz Biotechnology, Santa Cruz, California, USA), OPA3A (provided by Guy Lenaers, Institut des Neurosciences de Montpellier, France), TOM20 (Santa Cruz Biotechnology), β-actin (Sigma, Steinheim, Germany) and p62 (Merck Millipore, Darmstadt, Germany). Secondary antibodies (GE Healthcare, Little Chalfont, UK and Calbiochem, LaJolla, California, USA) were used according to the manufacturers’ instructions. Hoechst 33342 (Molecular Probes, Eugene, Oregon, USA) was used to stain nuclei. Fixed cells were investigated using an epifluorescence microscope (Axioplan 2, Zeiss, Oberkochen, Germany). Images were analysed by using Image J 1.41o software and the Pearson coefficient was evaluated using the JACoP plugin.9 For OPA3 expression analyses, cryostat sections of 14 µm were taken throughout the entire cochlear of 2-month-old mice.10 The sections were immunolabelled using antibodies against OPA3A or OPA3B (both homemade in Institut des Neuroscience de Montpellier, France, 1:500) and parvalbumin (Swants, Switzerland, 1:750) and visualised using a ZEISS LSM510 Meta laser scanning confocal microscope.
In vitro synthesis of precursor proteins and import into isolated mitochondria
Wild-type and mutant versions of the OPA3 cDNA were PCR amplified and cloned into the pGEM4 vector using EcoRI and BamHI restriction sites. Precursor proteins were synthesised by in vitro transcription in rabbit reticulocyte lysate in the presence of [35S]-methionine using SP6 polymerase and pGEM4 vectors as template. Isolation of mitochondria from HeLa cells and in vitro import assays were performed according to published procedure.11
Mitochondrial processing peptidase (MPP) protection assay
Purification of recombinant mitochondrial processing peptidase (MPP) expressed in Escherichia coli cells was carried out via affinity chromatography using Ni-NTA agarose as described before.12 Radiolabelled mitochondrial precursor proteins OPA3 and pSu9-dihydrofolate reductase (pSu9-DHFR) were incubated in MPP buffer (50 mM KOAc, 20 mM Tris/HCl, 1 mM DTT, 2 mM MnCl2, pH 7.4) with recombinant MPP for 8 min at 25°C. MPP enzymatic activity was inhibited by adding 4 mM EDTA. The proteins contained in the reaction mixture were precipitated with trichloroacetic acid and analysed by sodium dodecyl sulfate-polyacrylamide gel electrophoresis (SDS-PAGE) and autoradiography.
Cell culture and live cell imaging
Fibroblasts and HeLa cells were cultured at 37°C in the presence of 5% CO2 in Roswell Park Memorial Institute (RPMI) 1640 Medium (Invitrogen, Karlsruhe, Germany) supplemented with 15% (fibroblasts) or 10% (HeLa cells) fetal calf serum and 1% penicillin–streptomycin. Live cell imaging was performed using an inverted Zeiss Axiovert microscope (Zeiss Plan-Apochromat 63x/1.4) as described previously.9 Stacks of the images were taken with an AxioCamMRm camera (Zeiss) and analysed using Zeiss software AxioVision 4.6 (Zeiss) and Image J 1.41o software.
Analysis of mitochondrial morphology
Mitochondrial morphology was analysed as described previously.9 ,13 Using Image J 1.41o software, the aspect ratio and the area of every mitochondrion were calculated. Additionally, the form factor (perimeter2/(4π×area)), consistent with the degree of branching, was calculated.14
Statistical analysis
Functional data were analysed using a Student t test; all statistical tests were two-sided, and those with a p value <0.05 were considered to be statistically significant. Data are expressed as mean±SE values.
Results
Mutation screening reveals alterations of the OPA3 gene in four independent ADOA families
Screening of the OPA3 gene in 121 independent ADOA index patients (all negative for mutations in the OPA1 gene) revealed the presence of heterozygous mutations in four of these patients, all segregating with the disease in the corresponding families. We detected the previously reported missense mutation c.313C>G/p.Q105E in exon 2 in three independent families (optic atrophy-Kjer type (OAK) 1, OAK 61 and OAK 255, figure 1A).8 In addition, we found a novel heterozygous in-frame insertion in exon 1, c.10_11insCGCCCG/p.V3_G4insAP in family OAK 105 (figure 1C), which was not present in healthy family members as well as in 250 control chromosomes. The mutation results in an insertion of two amino acid residues between positions three and four that are highly conserved among different species and OPA3 isoforms (see online supplementary figure S1). cDNA analysis of the mutant OPA3 transcripts revealed no splicing defects (data not shown).

Pedigrees and sequence traces of OPA3 mutations identified in patients with autosomal dominant optic atrophy (ADOA). (A) Electropherogram sections showing the OPA3 missense mutation c.313C>G (p.Q105E) in exon 2 and the corresponding wild-type sequence (top and bottom, respectively) in three independent ADOA families. (B) Haplotype analysis in patients harbouring the recurrent c.313C>G mutation in the OPA3 gene. The patients were genotyped using one microsatellite closely linked to the OPA3 gene (D19S219) as well as one intragenic SNP (c.231C>T). The disease haplotypes are shown in bold. No common disease haplotype was identified within these families. (C) Electropherogram sections showing the OPA3 mutation c.10_11insCGCCCG (p.V3_G4insAP) in exon 1 and the corresponding wild-type sequence (top and bottom, respectively) in one ADOA family.
Haplotype analysis of the c.313C>G mutation excludes common ancestry
To determine whether the recurring mutation c.313C>G has a common ancestry or represent independent OPA3 mutational events, one microsatellite marker (D19S219) located 36.7 kb upstream of the OPA3 gene and one single nucleotide polymorphism within exon 2 of the OPA3 gene were selected and haplotypes were deduced from allele segregation among mutation carriers in the families (figure 1B). A common disease genotype is shared between the affected family members of OAK 1 and OAK 61 but not for OAK 255 suggesting that the c.313C>G mutation arose independently in these families.
Clinical description of ADOA patients with OPA3 mutations
Clinical data were available for 14 patients with mutations in the OPA3 gene (table 1). All of these patients had a clinical diagnosis of ADOA, and a family history compatible with dominant inheritance.
Clinical findings in ADOA patients with OPA3 mutations
All patients reported a disease onset within the first two decades of life. Visual acuity loss varied from 0.04 to 0.5, but was similar for both eyes. All patients showed a pallor of the optic disc, which was mostly confined to the temporal site and bilateral central scotomas. All affected members of family OAK 1 report colour vision defects, which differ in severity and type. Two patients have defects in the blue-yellow axis and three patients in the red-green axis. In a previous study, cataract was reported consistently in all patients with dominant OPA3 mutations.8 However, in our patients’ cohort only 10 out of 14 developed cataract. Nine out of these 10 patients showed bilateral cataract, whereas in one case (OAK 1, II:2) cataract affected only one eye. Interestingly, five patients feature hearing loss, which was not reported in patients with OPA3 mutation until now, but which is known for some ADOA patients with OPA1 mutations.15–17 Urine examination for metabolic organic acids as well as analysis of serum lactate and pyruvate were done for patients OAK 255 III:1 and III:2 as well as for patients OAK 105 III:2 and IV:1, but showed no abnormalities.
In total, our clinical results demonstrate an interfamilial phenotypic variability as well as intrafamilial phenotypic variability and therefore, a phenotype/genotype correlation is complex.
OPA3 is highly expressed in the cochlea
We have analysed OPA3 isoform expression in the murine cochlea. Cryosections of the murine cochlea showed a strong expression of OPA3A and OPA3B in the spiral ganglion neurons. Furthermore, OPA3A showed strong labelling in the inner hair cells and in the Deiters cells of the organ of Corti and slight labelling in the outer hair cells, whereas OPA3B was strongly labelled in the inner hair cells (figure 2).

Expression of OPA3 isoforms in the inner ear. Adult mouse cochleae were stained with Hoechst and immunolabelled with anti-OPA3A or anti-OPA3B antibody (in green) and anti-parvalbumin antibody (in red) to identify hair cells and spiral ganglion neurons. Strong expression of OPA3A and OPA3B was localised in spiral ganglion (SG). OPA3A strongly labelled inner hair cells (IHC) and Deiters cells (D) and more weakly the outer hair cells (OHC) of the organ of Corti. OPA3B highly labelled the IHC. Scale bar represents 20 μm. No signal was detected in negative controls.
Mitochondria import assay indicates OPA3 is a MIM protein
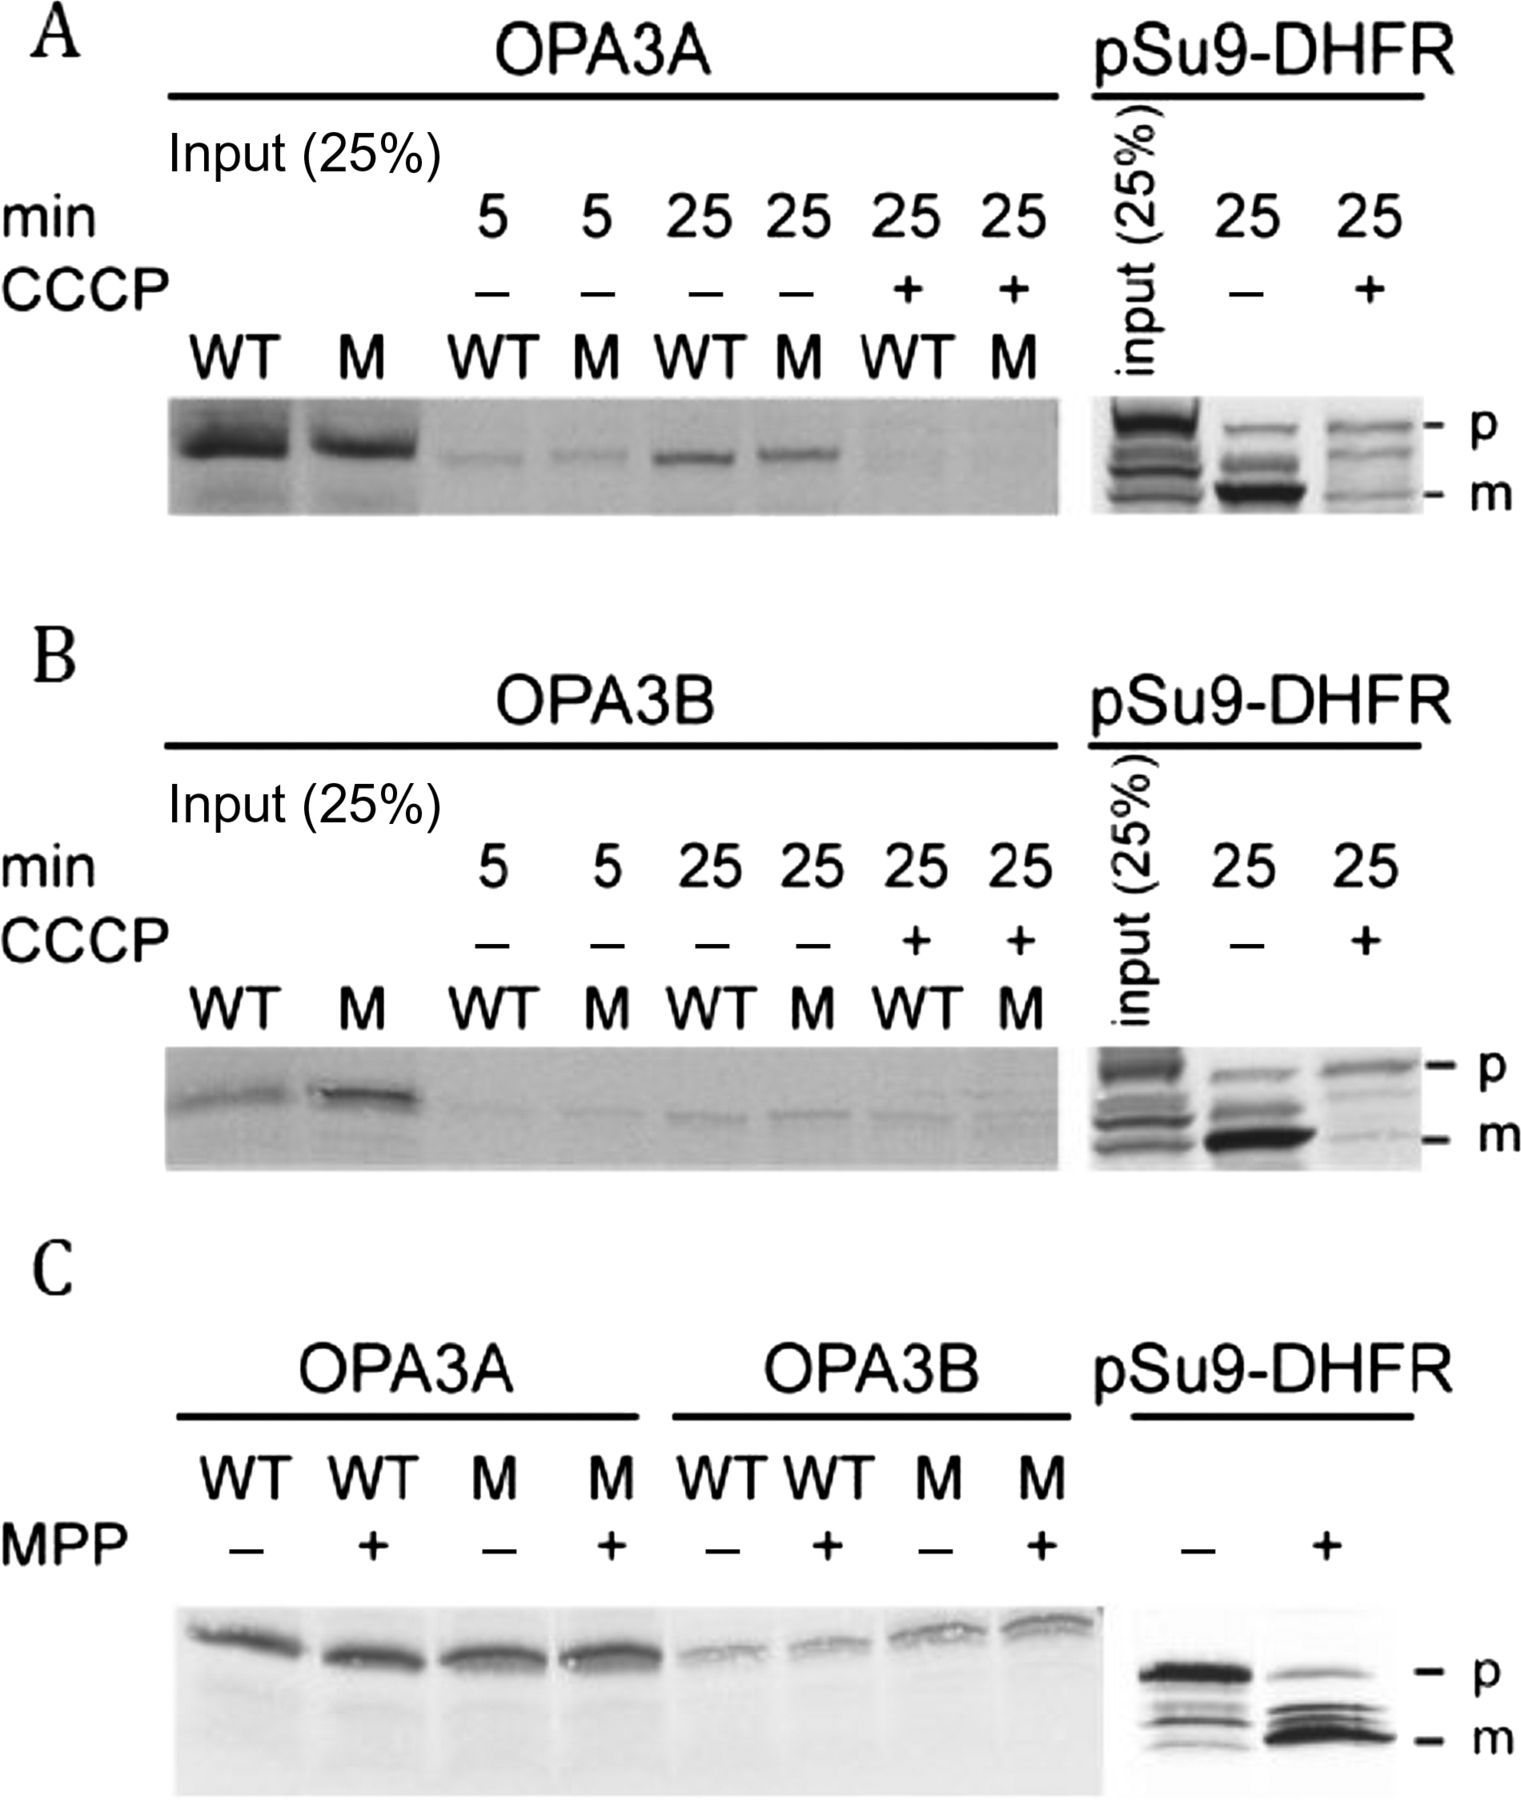
Since the mutant p.V3_G4insAP OPA3 protein has an insertion of two amino acids in the putative MTS at the N-terminus, we investigated whether this mutation affects the mitochondrial import of OPA3 and its sorting within the organelle. Therefore, we compared the import properties of the mutant OPA3 protein with native protein and observed no real differences (figure 3A,B). Addition of the uncoupler carbonylcyanide m-chlorophenylhydrazone (CCCP) resulted in a reduced import efficiency suggesting that a membrane potential is required for efficient import of both the native and mutant forms. Usually, precursor proteins that harbour MTS at their N-terminus are processed by the MPP upon their import into the mitochondrial matrix. However, neither the native nor the mutant protein appeared to be processed by MPP, whereas a control protein, pSu9-DHFR, was cleaved by the MPP (figure 3C). As none of the known MOM proteins requires an intact membrane potential for its biogenesis,18 these findings suggest that OPA3 might be a MIM protein.

Mutated OPA3A and OPA3B are not hampered in their in vitro import capacity. Radiolabelled precursor proteins of OPA3A (A), OPA3B (B) and precursor (p) and mature (m) forms of pSu9-DHFR (as a control) were incubated at 25°C with isolated HeLa mitochondria (20 μg) in the presence or absence of 20 μM CCCP for the indicated time periods. Samples were treated with proteinase K and analysed by SDS-PAGE and autoradiography. (C) OPA3 is not processed in vitro by mitochondrial processing peptidase (MPP). Radiolabelled precursor proteins were incubated at 25°C with 5 μg of recombinant MPP for 8 min. The reaction was stopped by addition of 4 mM EDTA. Proteins were subjected to trichloroacetic acid (TCA) precipitation and further analysed by SDS-PAGE and autoradiography.
Mitochondrial network is altered in human fibroblasts from carriers of OPA3 mutation
Mutations in several neurodegenerative disease-related proteins have been associated with characteristic changes in mitochondrial morphology and dynamics.9 ,13 ,19 ,20
In our study, we observed morphological alterations with increased fragmentation of the mitochondrial network in human fibroblasts (n=70 cells) from two carriers (OAK 105, father (III:2) and son (IV:1)) harbouring the p.V3_G4insAP mutation compared with cells from two healthy controls (figure 4). Statistical analysis using the Image J software revealed that mitochondrial parameters such as the area of single mitochondria, the aspect ratio (indicating the length of single mitochondria) as well as the form factor (describing the degree of branching of a mitochondrial network) were significantly reduced in mutant cells compared with control cells (figure 4). Our analyses of patients’ fibroblasts revealed a mitochondrial phenotype with a reduced tubular network. These findings underscore a potential role of OPA3 in the regulation of mitochondrial morphology and dynamics.

Effect of the p.V3_G4insAP insertion on mitochondrial morphology in human fibroblasts. (A) Mitochondrial morphology of human fibroblasts from two affected patients from the optic atrophy-Kjer type 105 family and two healthy controls (one representative control being shown) was analysed by live cell imaging microscopy. Mitochondria were analysed for area, perimeter, major and minor axes. On the basis of these parameters, the aspect ratio (AR) of a single mitochondrion and its form factor (FF), consistent with the degree of branching, were calculated. (B) Mitochondrial branching as indicated by the FF, mitochondrial length as indicated by the AR as well as the area of single mitochondria were significantly reduced in cells from the two affected autosomal dominant optic atrophy patients compared with the healthy controls (mean values from both controls were combined for the analysis) *p<0.05, ***p<0.001.
Mutant OPA3 protein shows an altered translocation to mitochondria
OPA3 is imported into mitochondria due to its N-terminal mitochondrial targeting domain [5 ,6 and figure 3]. To address whether the p.V3_G4insAP mutation in OPA3 leads to an altered subcellular localisation, we investigated the colocalisation of the OPA3 protein with mitochondrial structures. By immunocytochemical studies of fibroblasts from two OPA3 mutation carriers, we calculated the Pearson coefficient based on the immunofluorescence signals of both OPA3 (using OPA3 antibody) and mitochondrial structures (using TOM20 antibody as a mitochondrial marker; figure 5). We found a significantly lower degree of colocalisation of OPA3 with mitochondrial structures in mutant cells compared with control cells (figure 5) suggesting a subcellular mislocalisation of mutant OPA3 protein and/or reduced protein steady-state levels.

Reduced colocalisation of OPA3 and mitochondria in cells harbouring the heterozygous p.V3_G4insAP mutation. Immunocytochemical analysis of mutant and control fibroblasts using antibodies against OPA3 and TOM20 was performed (A) and the Pearson coefficient that reflects the colocalisation of the two signals was calculated (B) **p<0.01, ***p<0.001.
Fibroblasts from OPA3 mutation carriers reveal a decreased amount of OPA3 protein
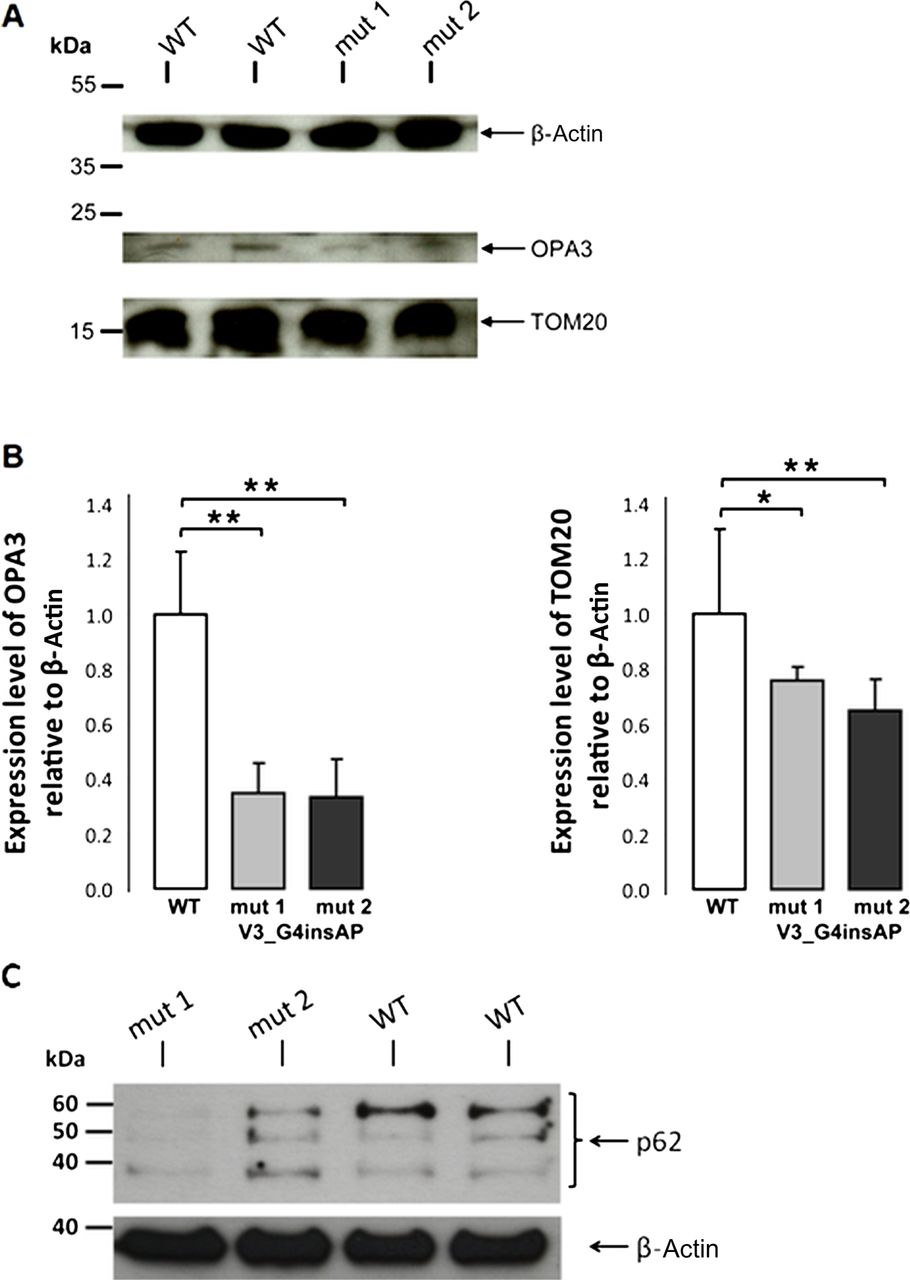
For quantification, we used cell lysates from fibroblasts of two carriers with the p.V3_G4insAP mutation and two healthy controls. Western blot analysis revealed a band at approximately 20 kDa (as expected for OPA3). Quantification of OPA3 protein levels revealed a 65% reduction in cells from both patients (figure 6), whereas OPA3 mRNA levels for both the patients and wild-type were quite similar (see online supplementary figure S2). These observations suggest that this mutation causes reduced steady-state levels of OPA3.

Whole cell lysates of mutant (p.V3_G4insAP) and control human fibroblasts were analysed by western blot analysis (A) and the intensity of the bands was statistically quantified by Image J software (B). The level of the cytosolic protein actin was used as loading control. Levels of OPA3 and TOM20 are presented in relation to the actin level. (C) Proteins (40 μg per lane) from whole cell lysates of mutant and control human fibroblasts were fractionated on SDS-PAGE and blots were probed with anti-p62. The level of the cytosolic protein actin was used as loading control. p62 was decreased in both patient cell lines when compared with the control fibroblasts *p<0.05, **p<0.01.
Mutations in the OPA3 gene result in a decreased mitochondrial mass
Our studies revealed a fragmented mitochondrial network in patients’ fibroblasts carrying the p.V3_G4insAP mutation. Increased fission has been described as a prerequisite for enhanced mitochondrial degradation.9 To understand if our results on altered mitochondrial morphology correlate with an increase in mitochondrial clearance, we analysed the mitochondrial mass as an endpoint measurement for the degradation of mitochondria via the lysosomal pathway. Effective clearance should be reflected by a decrease in mitochondrial mass due to a higher degradation rate. By immunoblotting studies in fibroblasts from two OPA3 mutation carriers, we biochemically determined the amount of mitochondrial mass by measuring TOM20 signal as a mitochondrial marker (figure 6). We discovered a significant reduction of normalised TOM20 levels in fibroblasts from both OPA3 mutation carriers (24% and 35% reduction) that may indicate a similar reduction of the mitochondrial mass.
Discussion
In this article, we report the results of a comprehensive OPA3 study, including the identification of OPA3 mutations in a cohort of 121 independent ADOA patients and families, the description of the clinical phenotype and a detailed functional characterisation of a novel mutation within the putative MTS of OPA3.
To date, two genes were identified that cause ADOA, OPA1 and OPA3, the first one representing the main locus for ADOA. We therefore examined the entire coding exons and flanking introns of the OPA1 gene in our patients, but could not detect any alteration. Screening of the OPA3 gene revealed mutations in four index patients. This number reflects a detection rate of 3%, which is congruent with a study of Ferré and coworkers.21
Patients and families analysed in this study were collected on the basis of clinical diagnosis. Conspicuously, each of the patients carrying an OPA3 mutation had several affected family members in multiple generations indicating that OPA3 mutations are highly penetrant and predominantly present in multi-generation families.
In our study, patients harbouring a dominant OPA3 mutation display a high variability of visual symptoms, including optic atrophy, loss of visual acuity, scotoma and dyschromatopsy without systematic axis. Visual acuity ranged between 0.04 and 0.5 and was correlated with the presence of scotomas and pallor of the optic discs. Colour vision ranged from normal to severe colour vision defects. A high variability in clinical symptoms is also known for ADOA patients with OPA1 mutations22–24 suggesting that this phenotypic variability is a characteristic feature for optic atrophies independently from the disease gene or type and localisation of the mutation within the corresponding gene. The cause of the high phenotypic variability is still unknown and therefore, a reliable genotype/phenotype correlation remains complex.
Furthermore, cataract has been reported as a characteristic feature for OPA3-associated optic atrophy.4 ,8 The majority of our patients, 10 out of 14, had a clinical history of cataract; however, in three patients, including follow-up data until the age of 52 (OAK 105, III:2), no cataract was observed. In addition, we observed five patients with hearing loss. Optic atrophy associated with hearing loss is part of the symptom triad in Wolfram syndrome (together with diabetes)25–27 and has also been reported for certain OPA1 mutations (eg, p.R445H)15–17 but not in patients with OPA3 mutations. To corroborate the link between hearing loss and OPA3 mutations, we performed expression analyses of OPA3 isoforms in the mouse auditory organ. In cochlear tissue, both OPA3 splice variants were detected with a strong expression in ganglion cells. Moreover, OPA3A was found in the inner hair cells and Deiters cells of the organ of Corti, while OPA3B is expressed in the inner hair cells. The high expression level of OPA3 in the sensory and neuronal cells in inner ear is compatible with a sensorineural deafness probably resulting from an auditory neuropathy. Thus, we suggest that this extraocular feature is a further clinical symptom in ADOA patients with OPA3 mutations.
Including the novel one detected in this study, six different OPA3 mutations have been identified so far. Except for the c.313C>G mutation in exon 2, which was identified in three families in our study besides the one described previously,8 all other mutations were detected only in single families, suggesting a broad spectrum of private OPA3 mutations in the population. However, haplotype analyses indicate that the c.313C>G allele did not emerge from a common ancestor. As this mutation is located in a putative coiled-coil domain (amino acids 103–163, http://www.uniprot.org/uniprot/Q9H6K4), we analysed the effect of this mutation on the predicted coiled-coil structure of OPA3 in silico using the COILS program (http://embnet.vital-it.ch/software/COILS_form.html), but could not detect any significant alteration in the propensity to form a coiled-coil structure (data not shown).
The second OPA3 mutation, which was identified in this study, p.V3_G4insAP, is located in the MTS in exon 1. In contrast to two other OPA3 mutations,5 this mutation did not cause an upregulation of one of the two OPA3 variants (data not shown). This is to be expected as exon 1 (and therefore the insertion) is present in both isoforms. To confirm the pathogenicity of this novel identified OPA3 mutation and to gain insight into the pathological process, we have analysed its influence on the mitochondrial phenotype in fibroblasts obtained from two affected patients. For this, we have established fibroblast cell lines from skin biopsies of two affected patients, the father and son, and compared them with control fibroblast cell lines from two unaffected healthy individuals. Interestingly, we found higher levels of fragmentation of the mitochondrial network in the patients’ cell lines compared with control fibroblasts. In previous studies in which fibroblasts of a patient with a different OPA3 mutation and fibroblasts from a mouse mutant were investigated, no changes in the mitochondrial morphology were observed.8 ,28 However, these apparent discrepancies can be explained by the differences in methodology and models. For analysing the mitochondrial morphology, Reynier and colleagues used MitoTracker Red CMXRos,8 a red-fluorescent MMP-dependent dye that only stains intact mitochondria,29 ,30 whereas we used the fluorescent dye MitoTracker Green, which is independent from the MMP. Fragmentation of the mitochondrial network due to fission processes is a prerequisite for dysfunctional mitochondria to be segregated from the intact pool of mitochondria via mitophagy.31 Therefore, a fluorescent dye, specifically dependent on the intactness of the MMP as used in the study of Reynier and colleagues8 may miss dysfunctional mitochondria as an important subpopulation when analysing the mitochondrial network. This may explain why our results uncovered a significant amount of fragmented mitochondria that would not be sufficiently stained using an MMP-dependent dye. In addition, the divergence between our and other studies can also be attributable to different experimental models and/or cell types as it was previously described for mitochondrial phenotypes in other models of neurological diseases, that is, Parkinson and Alzheimer disease research. In these diseases, abnormalities in mitochondrial morphology differed among species (human, mouse and flies) and cell types (fibroblasts, neuronal cells).32 ,33
Furthermore, it has been reported that overexpression of OPA3 in HeLa cells leads to an extensive fragmentation of mitochondria, whereas downregulation using siRNA techniques results in more elongated and tubular mitochondria.6 Our results also indicate an involvement of OPA3 in the regulation of mitochondrial morphology, but we observed a shift towards a more fragmented mitochondrial network in human fibroblasts from OPA3 mutation carriers compared with healthy controls. Indeed, mitochondrial dynamics seem to be sensitive to culture conditions34 and the type of genetic manipulation.35 Ryu and colleagues6 looked at an acute manifestation of the mitochondrial network (by overexpression or downregulation of OPA3) that may represent an early and transient phenotype. On the contrary, our fibroblasts of two affected patients rather demonstrate a chronic phenotype may be displaying compensatory processes and/or long-term effects. Previous reports have proposed that the mitochondrial fission and fusion processes play a central role in the mitochondrial quality control. Dysfunction of mitochondria results in the inhibition of fusion, while ongoing fission events lead to fragmentation of the mitochondrial network, which enables the degradation of impaired mitochondria through mitophagy.31 ,36 Thus, this would be in agreement with our observation of the fragmented mitochondrial network in patients’ cell lines compared with control fibroblasts, the reduction of mitochondrial proteins (OPA3 and TOM 20) as well as decreased p62 levels (figure 6).
In addition, we found reduced colocalisation of OPA3 and mitochondria in the mutant patients’ fibroblasts. We suggest that the insertion of the two amino acids might lead to an alteration of the MTS in the N-terminal domain and thus to a mislocalisation. This might indicate that different localisations of OPA3 mutations within the gene may be responsible for the variations among mitochondrial phenotypes. This is supported by the fact that OPA3 also contains a hydrophobic region (amino acids 83–102) that is required for mitochondrial fragmentation.6 Whether there are any further regions that have potential effects on the mitochondrial morphology has to be clarified.
Although the precise localisation of OPA3 is discussed controversially, there are different hints for the localisation in the MIM: (1) proteomic analysis and prediction programs (MitoRes and MITOP) list OPA3 as an inner mitochondrial membrane protein5 ,7; (2) OPA1, the disease-causing gene for ADOA, is also located in the inner membrane and is required for the MIM integrity37; (3) in this study, we report that an intact MMP is required for the efficient in vitro import of OPA3 into mitochondria. As the MMP is essential for the transport of preproteins into or across the MIM38 and none of the known MOM proteins were found to require a MMP for their biogenesis,18 we suggest that OPA3 might be an inner membrane protein, which is in accordance with other reports.5 ,7 Considering that a previous experimental study suggests that OPA3 rather localises to the MOM,6 one can speculate that OPA3 is associated with both, the outer and inner mitochondrial membranes. Similar dual localisation has been recently described, for example, for tafazzin,39 ,40 the disease-causing gene for MGA II/Barth syndrome.
The majority of N-terminal targeting signals are cleaved by the MPP upon import into the mitochondria. To date, it is not known if OPA3 is cleaved after the import into the mitochondria, but three different prediction programs (TargetP, http://www.cbs.dtu.dk/services/TargetP/, PSORT II, http://psort.hgc.jp/form2.html and Mitoprot, http://ihg2.helmholtz-muenchen.de/ihg/mitoprot.html) suggest a cleavage of OPA3 between amino acids 18 and 19 (data not shown). However, our results showed that OPA3 was neither processed after the import into the mitochondria nor was it processed in vitro by recombinant MPP. If OPA3 is cleaved by other peptidases or if it remains unprocessed like it is known for several matrix proteins such as rhodanese, 3-oxo-acyl-CoA-thiolase and chaperonin which N-terminal targeting signal has characteristics very similar to those of cleaved signals41–43 still needs to be clarified.
In summary, this study broadens the clinical phenotype and our understanding of the molecular pathomechanism underlying OPA3-related ADOA. Furthermore, our findings with fibroblasts obtained from patients with a novel OPA3 mutation in the MTS suggest an involvement of OPA3 in mitochondrial morphology and dynamics.
Acknowledgments
We are deeply indebted to all families for participating in this project. We also thank Guy Lenaers and Chen Ryu for providing OPA3 antibodies. This work was supported by grants from the Federal Ministry for Education and Research ((BMBF), E-RARE/ERMION: 01GM1006 to BW; NGFNplus; 01GS08134 to RK; MitoNET to DR) and by grants from the Fritz Thyssen Foundation (Az. 10.11.2.153 to RK), the German Research Council (DFG, KR2119/8-1 to RK), the United Mitochondrial Disease Foundation (to DR) and by a doctoral scholarship from the charitable Hertie Foundation (to LFB).
References
Supplementary materials
Supplementary Data
This web only file has been produced by the BMJ Publishing Group from an electronic file supplied by the author(s) and has not been edited for content.
Files in this Data Supplement:
- Data supplement 1 - Online figure
- Data supplement 2 - Online figure
- Data supplement 3 - Online table
- Data supplement 4 - Online table
Footnotes
TG and LFB contributed equally to this study.
-
Contributors TG performed the mutation analysis, quantitative real time-polymerase chain reaction (qRT-PCR) and western blot analysis; she assisted in the study design, interpreted data and assisted in writing the paper. LFB performed western blot analysis, immunocytochemistry and immunofluorescence microscopy, live cell imaging and analysis of the mitochondrial morphology of the patients’ fibroblasts and assisted in writing the paper. GE had substantial contributions to the protein import assay and the MPP protection assay. CD and BD had substantial contributions to the expression analysis in inner ear. KO, BL-K and TR performed all ophthalmological examinations. RK, DR and BW had substantial contribution to revising the article critically for important intellectual content and final approval of the version to be published. SS-L designed the study, performed qRT-PCR, cDNA and haplotype analysis, had substantial contributions to conception and design, acquisition of data, analysis and interpretation of data and wrote the paper. All authors read and approved the final manuscript.
-
Competing interests None.
-
Patient consent Obtained.
-
Provenance and peer review Not commissioned; externally peer reviewed.