


Abstract
Background/Aim: Ovarian cancer (OC) is the 5th most common cancer among European women. Approximately 70-80% of OC is diagnosed at advanced stage resulting in an elevated mortality rate. The aim of this study was to examine whether Annexin A2 and S100A10 expression can be used as prognostic markers for epithelial ovarian cancer (EOC). Materials and Methods: Expression of Annexin A2 and S100A10 was evaluated in EOC tissue samples (n=303) by immunohistochemistry. The staining of the membrane, cytoplasmic and stroma was assessed according to intensity. Results: The expression of both markers correlated to histological subtype, histological grading, International Federation of Gynecology and Obstetrics (FIGO) stage, and macro-radical surgery. Univariate Cox regression analysis showed that Annexin A2 and S100A10 in stromal tissue correlated with shorter overall survival (OS). Multivariate Cox regression analysis demonstrated no independent prognostic significance of stromal Annexin A2 expression. Conclusion: High expression of Annexin A2 and S100A10 in stromal tissue from EOC patients was associated with reduced OS; however, no independent prognostic value was found for any of the markers.
Ovarian cancer (OC) is the 5th most common cancer among European women with 65,584 cases and 42,749 deaths in 2012 (1). More than 90% of OC are of epithelial type (2). Among epithelial OC (EOC) there are different histopathological types including serous adenocarcinoma, endometrioid adenocarcinoma, mucinous adenocarcinoma and clear cell carcinoma, with serous adenocarcinoma being the most common (3). Serous OCs are graded according to histopathological features and genetic profile and divided into low-grade serous carcinomas (LGSC) and high-grade serous carcinomas (HGSC) (3). International Federation of Gynaecology and Obstetrics (FIGO) staging describes the spread of the malignant disease; 70-80% of EOC is diagnosed at an advanced stage (FIGO stage III-IV) (4). The 5-year survival rates for patients diagnosed at FIGO stage III and IV are much lower (29.5% and 14.8% respectively) compared to 87.5% if the patients are diagnosed in stage I (5).
Treatment of EOC consists of a regimen of either intended primary radical surgery followed by adjuvant chemotherapy or 3 series of neo-adjuvant chemotherapy (NACT) followed by interval surgery and further 3 series of chemotherapy in patients not suitable for primary radical surgery. Since 2012, the monoclonal antibody bevacizumab is used for the treatment of patients with residual tumour, relapse, or platinum resistance (6, 7). However, identification of novel biomarkers that predict response to treatment is warranted in order to help clinicians select the optimal treatment for EOC patients.
Annexin A2 is a 36-kDa calcium-binding protein predominantly found in the cell membrane (8). The NH2-terminal domain of Annexin A2 is binding site for S100A10 and tissue plasminogen activator (tPa), while the core protein binds to calcium and the cell membrane. The C-terminal region contains the binding site for F-actin (9), heparin (10) and plasminogen (11). Intracellularly, Annexin A2 is involved in exocytosis, endocytosis (12, 13) and membrane trafficking through lipid micro domains (14). Moreover, it is suggested as a factor implicated in cell division, since knockdown of the Annexin A2 gene, Anxa2, has been shown to decrease DNA synthesis and cell proliferation (15). By binding directly or indirectly to phosphatidylserine on cells marked for apoptosis, Annexin A2 plays a role in the engulfment of cells. Furthermore, it is shown that plasmin can be generated specifically at the cell surface through the action of Annexin II-bound plasminogen and tissue plasminogen activator, thereby supporting two processes; neoangiogenesis and fibrinolytic surveillance (16, 17).
Overall presentation of immunostaining for Annexin A2 (A) and S100A10 (B) in membrane, cytoplasm, and stromal tissue.
S100A10 is a calcium binding protein of EF-hand type with a structural domain of helix-loop-helix conformation. The S100A10 gene is located on chromosome 1q21, a section prone to genomic rearrangement (18, 19). The binding between Annexin A2 and S100A10 is accommodated in the free hydrophobic space between Helix III and IV of the S100A10 dimer. Co-expression of S100A10 and Annexin A2 increases the calcium sensitivity of Annexin A2 (20). In the cell membrane, Annexin A2 and S100A10 form a heterotetrameric complex which binds to F-actin interacting with the cytoskeleton, and thus interfering with cell movement (8). Annexin A2-S100A10 complex is a key plasminogen receptor that mediates the formation of plasmin on the cell surface (8, 21). Thus, it can be hypothesized that Annexin A2-S100A10 may have a role as a facilitator of metastasis.
In this study we aimed to investigate whether protein expression of Annexin A2 and S100A10 in the cell membrane, cytoplasm and stroma are correlated to clinical characteristics and to demonstrate a possible value of Annexin A2 and S100A10 as prognostic markers among EOC patients.
Materials and Methods
Tissue samples. Tumour samples were collected at the time of OC surgery from patients treated at two tertiary gynaecological cancer centres, The University Hospital Rigshospitalet (RH, Copenhagen) (n=198) and Odense University Hospital (OUH, Odense) (n=140), Denmark. Patients where a part of the Pelvic Mass study cohort. The Pelvic Mass Study is a multicentre study with an ongoing prospective collection of blood and tissues together with an intensive recording in a database of clinical and epidemiological data. All patients participating in the project The Pelvic Mass are informed orally and in writing. Inclusion in the project takes place when they are scheduled to operations. All patients are registered online in the Danish Gynaecological Cancer Database (DGCD). Clinical data as well as information about treatment and survival are reported continuously to DGCD (22). The use of samples from RH and OUH were approved by The Regional Scientific Committee of Capital Region of Denmark and The Regional Scientific Committee of Southern Denmark.
Tissue samples were formalin fixed and paraffin embedded. All diagnoses of tissue material were given from pathologists with speciality in gynaecologic pathology. The WHO histological classification was used (3). Two representative areas of the tumour were marked and stamped out using the automated tissue arrayer ATA-27 (Beecher Instruments Inc., Sun Prarie, WI, USA) and inserted in a receiver block to make the tissue microarray (TMA). In total 6 TMA blocks including 2 cores/patient from the Pelvic Mass Study and 7 TMA-blocks including with 2 cores/patient from OUH were used. All cores were diameter 1 mm. All TMA blocks were stored at room temperature. In total 338 patient samples were assessed, while 38 cases were excluded (27 benign tumours, 1 borderline ovarian tumour, 6 insufficient core samples and tissue from 4 patients with no follow up information).
Immunohistochemistry. Immunohistochemistry (IHC) was performed as previously described (23). Briefly, tissue sections (4 μm) underwent microwave antigen retrieval for 10 min at 100°C in a steam microwave (Sixth Sense; Whirlpool, VIC, Australia) in 10 mM citric acid buffer (pH 6). Tissue sections were incubated overnight with a mouse monoclonal antibody against Annexin A2 (1:500; BD Biosciences, Franklin Lakes, NJ, USA) or mouse monoclonal antibody against S100A10 (1:1,000; BD Biosciences) in blocking buffer (5% normal goat serum, Sigma-Aldrich, Copenhagen, Denmark) at 4°C. Visualization of immunoreactivity was achieved using biotinylated anti-mouse immunoglobulins (1:400; Dako, NSW, Australia), streptavidin-peroxidase conjugate (1:500; Dako), and diaminobenzidine tetrahydrochloride (Sigma-Aldrich, Copenhagen, Denmark). Known positive tissue samples were used as positive controls and negative controls included tissue samples incubated with no primary antibody or anti-mouse immunoglobulins.
Immunohistochemistry assessment. Slides were digitally scanned using the NanoZoomer Digital Pathology System (Hamamatsu Photonics, SZK, Japan), and images were collected using NDP view imaging software (NDP scan software v2.2; Hamamatsu Photonics). The staining level of the tissue samples were assessed by two observers (MVC and JB). In case of discrepancies in scoring, a third observer (PC) evaluated the staining and consensus was obtained. In total, 89 (26%) of the Annexin A2 stained and 115 (34%) of the S100A10 stained samples were evaluated by a third person. The percentage of cells with membrane and cytoplasm staining in the cores were evaluated using 10% as cut-off. The intensity of the stained cells was divided in four groups (0-3), with 3 being the highest intensity. The staining of the stroma was assessed due to intensity in four groups (0-3). For dichotomized scoring, group 0-1 represents low expression and group 2-3 represents high expression. When heterogeneity was observed in tumour samples, then the highest score was used.
Statistical analysis. Primary endpoint was overall survival (OS). Kaplan–Meier method and univariate Cox proportional hazards model were used to evaluate the association of Annexin A2 and S100A10 expression, as well as other clinicopathological features with OS. The explanatory covariates Annexin A2 and S100A10 were entered by the score (0, 1, 2, 3) or dichotomized as low/high. Moreover, a multivariate Cox proportional hazards model was performed including age (scored so that the hazard ratio is for a 10-year difference), macroradical surgery, FIGO stage, and performance status scored as 0 or 1 versus 2 or 3. Hazard ratios (HR) for both univariate and multivariate analyses with 95% confidence intervals are presented. Model assessment of the linearity of the Annexin A2 and S100A10 covariates and the proportional hazards assumption were done using martingale residuals. A p-value of <0.05 (two-sided) was considered significant. All calculations and final database management were done using SAS (v9.4, Cary, N.C., USA).
Results
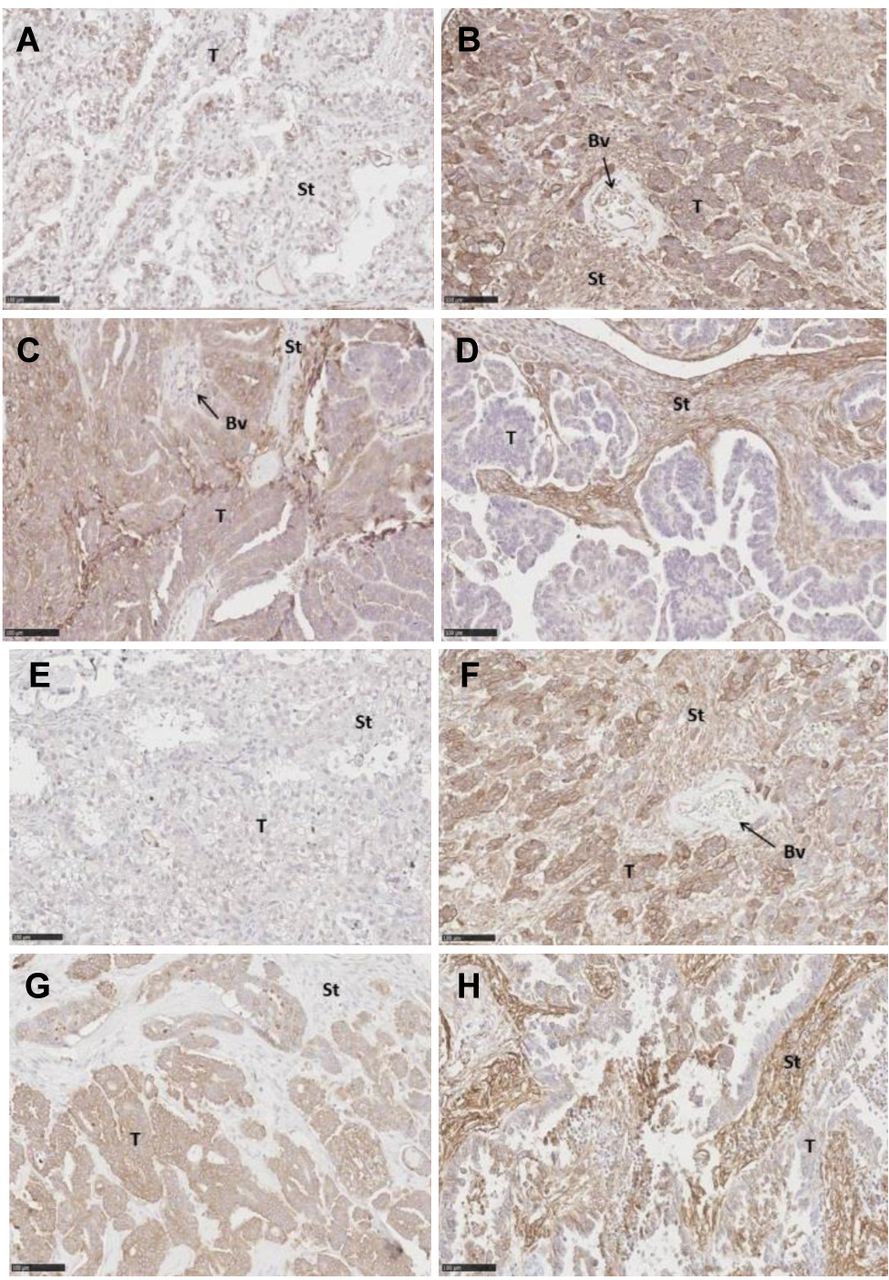
Tissue expression of Annexin A2 and S100A10 in EOC. Immunostaining of Annexin A2 and S100A10 were observed in membrane, cytoplasm and stroma surrounding the tumour cells (Table I). Representative images of the immunostaining are shown in Figure 1.
Neither expression of Annexin A2 nor expression of S100A10 in membrane, cytoplasm and stromal tissue showed correlation with the clinicopathological features age, body mass index (BMI), risk malignancy index (RMI), or the volume of ascites at surgery (Table II). High expression of Annexin A2 in cytoplasm (p=0.004) and membrane (p=0.045) correlated with histological type. In addition, high S100A10 expression in stroma (p=0.004) and cytoplasm (p=0.013) also correlated to histological type. High S100A10 expression in stroma was associated with high FIGO stage (p=0.0007). High Annexin A2 expression in membrane (p=0.0064) and high S100A10 expression in stroma (p=0.0064) were associated with high grade serous carcinoma OC (Table III).

Annexin A2 immunostaining of ovarian cancer tissue. Image of low (A) and high (B) Annexin A2 staining in the membrane, cytoplasm and stroma. Image of low (C) and high (D) Annexin A2 staining in stromal tissue. Scale bar 100 μm. (A, E: Clear Cell Carcinomas, B-D, F-H: serous adenocarcinomas). T, Tumour cells; St, stromal tissue; Bv, blood vessel.
Annexin A2 and S100A10 expression and OS. Univariate Kaplan-Meier survival analyses showed significant association between OS and expression of Annexin A2 in stroma (HR=1.34, 95% CI=1.10-1.63, p=0.0038), but not in cytoplasm or membrane (Table IV). Likewise, S100A10 expression in stromal tissue was associated with a 1.88-fold increased risk of death (HR=1.88, 95% CI=1.47-2.40, p<0.0001) (Table IV), while S100A10 expression in membrane or cytoplasm was not significantly associated with OS. Kaplan–Meier curves showing the survival probabilities according to Annexin A2 and S100A10 expression levels (low/high) in stromal tissue are presented in Figure 2A and 2B, respectively. Histological grade and RMI were found as independent prognostic factors associated with a shortened OS (p=0.0001 and p=0.0006 respectively). High age, volume of ascites at operation and performance score were negative prognostic factors (p<0.0001). Cox proportional hazard model including all OC patients and factors of prognostic values in multivariate analyses showed stromal expression of S100A10 of no independent prognostic value (p=0.0970) (Table V). Stromal expression of Annexin A2 had no independent prognostic value (p=0.10). High age, residual tumor after surgery, higher FIGO stage and higher performance score were all associated with a shortened OS (Table IV). Performing the multivariate survival analyses stratified to include only OC of serous histology did not change the impact of S100A10 stromal expression (Table V). Including grade in the multivariate model showed no significant contribution (p=0.18); however, there were few (n=15) with LGSC suggesting low power to detect a difference.
Correlation between tissue expression of Annexin A2 and S100A10 and clinicopathological features. Spearman's correlation coefficients for clinicopathological features.
Correlation between tissue expression of Annexin A2 and S100A10. Comparison of Annexin A2 and S100A10 expression to histological type, International Federation of Gynecology and Obstetrics (FIGO) stage, residual tumour after surgery and grading.
Univariate Cox regression analysis for overall survival (OS) in patients with epithelial ovarian cancer.
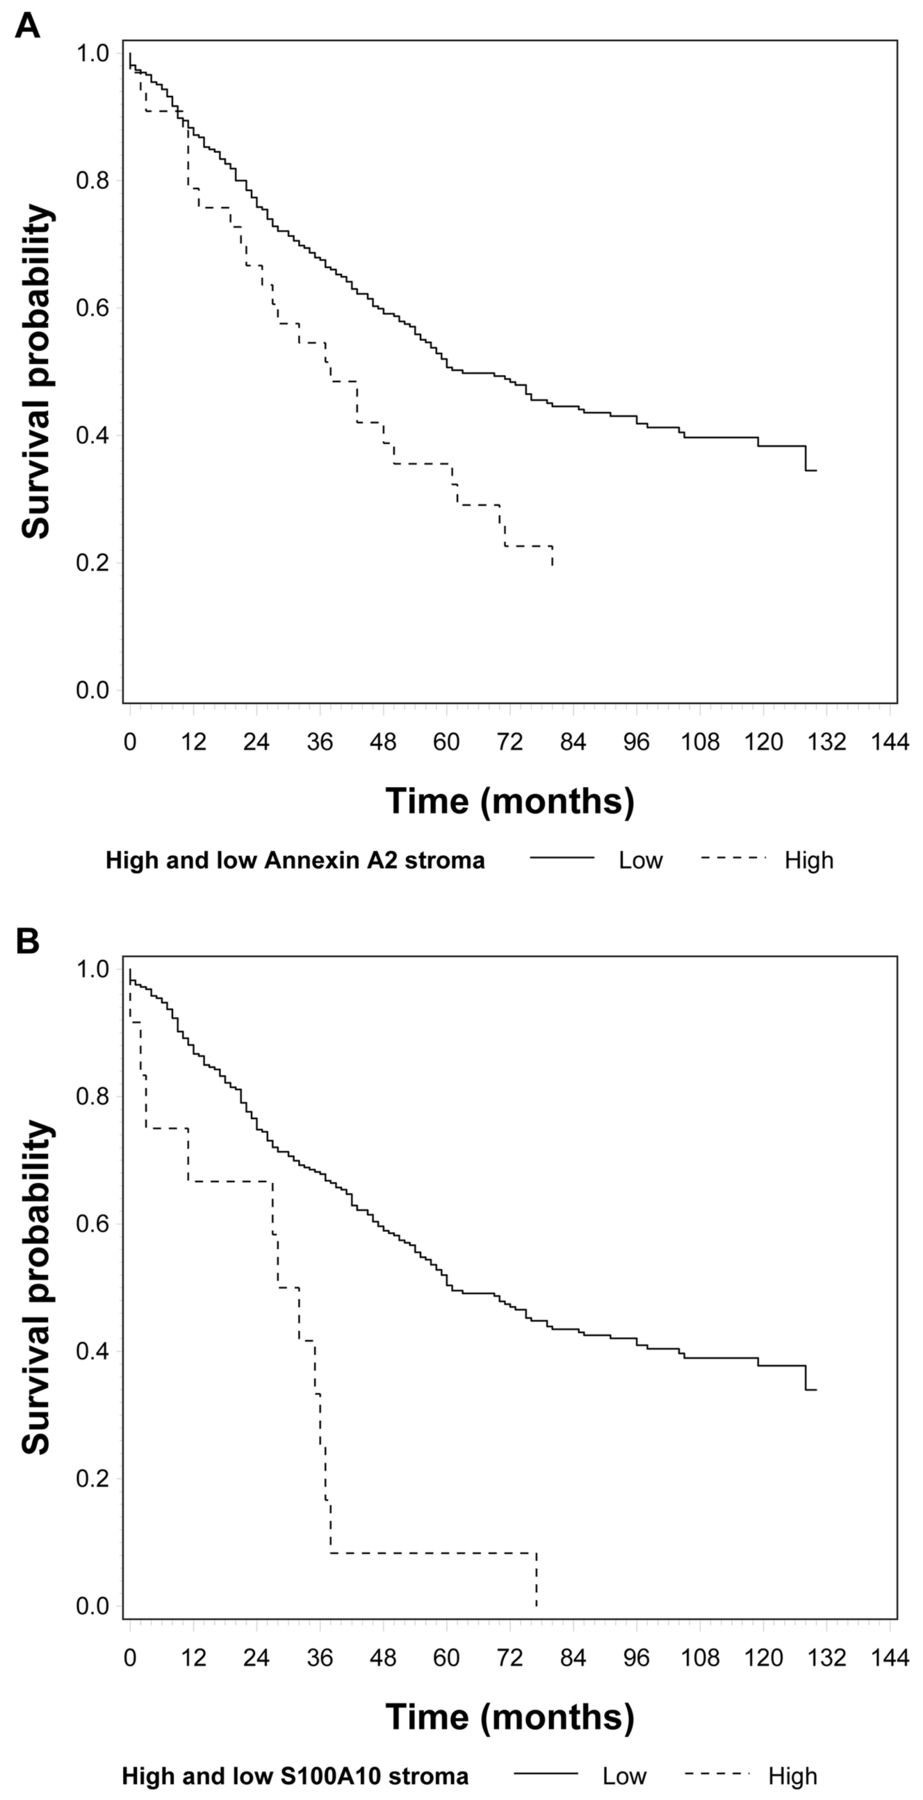
Kaplan–Meier curves showing the survival probability according to Annexin A2 and S100A10 expression levels (high/low) in stromal tissue.
Multivariate Cox regression analysis for overall survival (OS) in the epithelial ovarian cancer patient cohort. Factors of prognostic significance in univariate analysis where included in the multivariate Cox regression analysis.
Discussion
In this study we investigated the prognostic value of Annexin A2 and S100A10 in a Danish cohort of women diagnosed with EOC. Both Annexin A2 and S100A10 expression in stromal tissue, but not in tumour cells (membrane and cytoplasm), was associated with shortened OS at univariate analyses. In multivariate analyses, neither S100A10 nor Annexin A2 was found of independent prognostic value of OS.
In a previous study by Lokman et al. (24), it was shown that stromal expression of Annexin A2 and cytoplasm expression of S100A10 are independent predictors of OS, in serous OC FIGO stage III patients. In the same context, Deng et al. (25) revealed an association between Annexin A2 expression in tumour cells (both membrane and cytoplasm staining) and shortened OS, in different histological EOC subtypes and patients at all FIGO stages. Our results are not in agreement with these findings, therefore, we examined whether expression of Annexin A2 and S100A10 was correlated with FIGO stage or histological subtype to ensure that no bias was introduced in our study. Similar to the study by Lokman et al. (24), we did not find any correlation between Annexin A2 and S100A10 expression and clinicopathological features such as age, volume of ascites, or RMI; however, we confirmed a correlation with histological grade and histological subtype, FIGO stage, and extent of surgery. A relationship between Annexin A2 expression and FIGO stage, histological grade, ascites and radical surgery (tumour <1 cm) has also been shown by Deng et al. (25). Our data also showed a correlation between Annexin A2 stromal expression and residual tumour after surgery, as well as between S100A10 tissue expression in stroma and histological type, FIGO stage, residual tumour and histological grade. Although FIGO stage and histological subtype as well as residual tumour were independent prognostic factors for OS, neither Annexin A2 nor S100A10 had significant prognostic value in the studied cohort. Nevertheless, our cohort of 338 patients was larger than these of the previous studies, thereby potentially affecting the power of the results.
Annexin A2, in combination with S100A10, plays an important role in the plasminogen activator system regulating plasmin production (11). Recently, Lokman et al. investigated the potential utility of all-trans retinoid acid (ATRA), an inhibitor of the annexin A2-S100A10 signaling pathway, as a new therapeutic strategy against serous OC (26). ATRA was effective at inhibiting cell survival by more than 20% in 2 of 5 serous OC cell lines (OVCAR-3, OV-90) and was very effective at increasing apoptosis and decreasing proliferation in serous OC tissues in the ex vivo tissue explant assay. Based on their results, they concluded that ATRA may have promising potential as a novel therapy against serous OC that warrants further evaluation. Hence, although we did not find independent prognostic value of the investigated biomarkers Annexin A2 and S100A10 in our study, these markers may be of importance in the prediction of treatment response.
Before considering a new clinical biomarker approach for the management of EOC, the accuracy, precision and reproducibility of the method must be considered. IHC is a relatively fast and in-expensive method that has been widely used in pathological diagnosis. However, concordance may not always be obtained between results obtained using different antibodies. In fact, Bartlett et al. investigated the accuracy of IHC in testing HER2 expression and found that inter-observer variations, differences in the level of staining linked to the used antibodies, and inter-observer bias despite the use of published guide images, challenge the use of IHC (27). In this study, 26% of the Annexin A2 and 34% of the S100A10 samples were evaluated by a consultant pathologist to obtain agreement. These relatively high percentages illustrate that distinction between membranous and cytoplasmic staining may be challenging. It is, therefore, important to standardize scoring principles to ensure concordance between laboratories and pathologists before implementing the procedure in routine diagnostics.
One limitation of our study, which could explain the inconsistency with previous studies, is that only patients from two Danish centers were included. Thus, the cohort may not be representative of all patients; however, it may be representative of EOC patients in Denmark, since there are only four centers in total where ovarian cancer surgery is performed. Another limitation is, that no international standard of scoring exists for the investigated biomarkers. On the other hand, an important strength of the current study is the mature follow-up data. Moreover, the cohort consisted of a consecutive inclusion of patients, without restriction regarding socio-economic status of patients referred to the clinic. Data were collected prospectively, independent of outcomes, and continuously updated in the Danish Gynecologic Database. None were lost to follow-up, and missing information was minimal.
Conclusion
Stromal staining of Annexin A2 and S100A10 were associated with reduced OS in EOC patients; however, none of the markers had an independent prognostic value. The clinical relevance of the two investigated biomarkers is not clear due to discordant results found in the present and previously published studies. Therefore further analyses are warranted before any conclusion regarding future clinical aspects of Annexin A2 and S100A10 can be drawn.
Acknowledgements
This paper is compiled under funds by The Danish Cancer Society (funding no. R165-A10261-16-S7) and by support from the Molecular Unit, Department of Pathology at Herlev Hospital. A special thanks to the Pelvic Mass Study and Consultant Pathologist Doris Schledermann.
Footnotes
Authors' Contributions
MVC: Evaluation of laboratory results and contributed to the development of the proposal and was responsible for the writing of the draft and the review of the manuscript. CH: Responsible for the study design and cohort, e.g., selection of biological material and clinical information, contributed to the development of the proposal and review of the manuscript. SGJ: Design and constructing of Tissue Micra Arrays and review of the manuscript. NL: Laboratory work (staining), the evaluation of laboratory results, and the review of the manuscript. CR: Laboratory work (staining), the evaluation of laboratory results, and the review of the manuscript. IJC: Responsible for statistic, interpretation of results and review of manuscript. PC: Evaluation of laboratory results, and the review of the manuscript. JB: Evaluation of laboratory results, and the review of the manuscript. MAK: Collection of clinical data and the review of the manuscript. TKN: Collection of clinical data and the review of the manuscript. KMJ: Responsible for inclusion of patients, clinical data and the review of the manuscript. EH: Responsible for the study design and cohort, e.g., selection of biological material and clinical information, contributed to the development of the proposal, took part in result discussions and writing/review the manuscript.
Conflicts of Interest
The Authors declare no conflicts of interest.
- Received January 11, 2019.
- Revision received March 27, 2019.
- Accepted April 15, 2019.
- Copyright© 2019, International Institute of Anticancer Research (Dr. George J. Delinasios), All rights reserved


