Seminal Fluid Metabolomic Markers of Oligozoospermic Infertility in Humans

 , ,
, ,  and
and
Abstract
:
1. Introduction
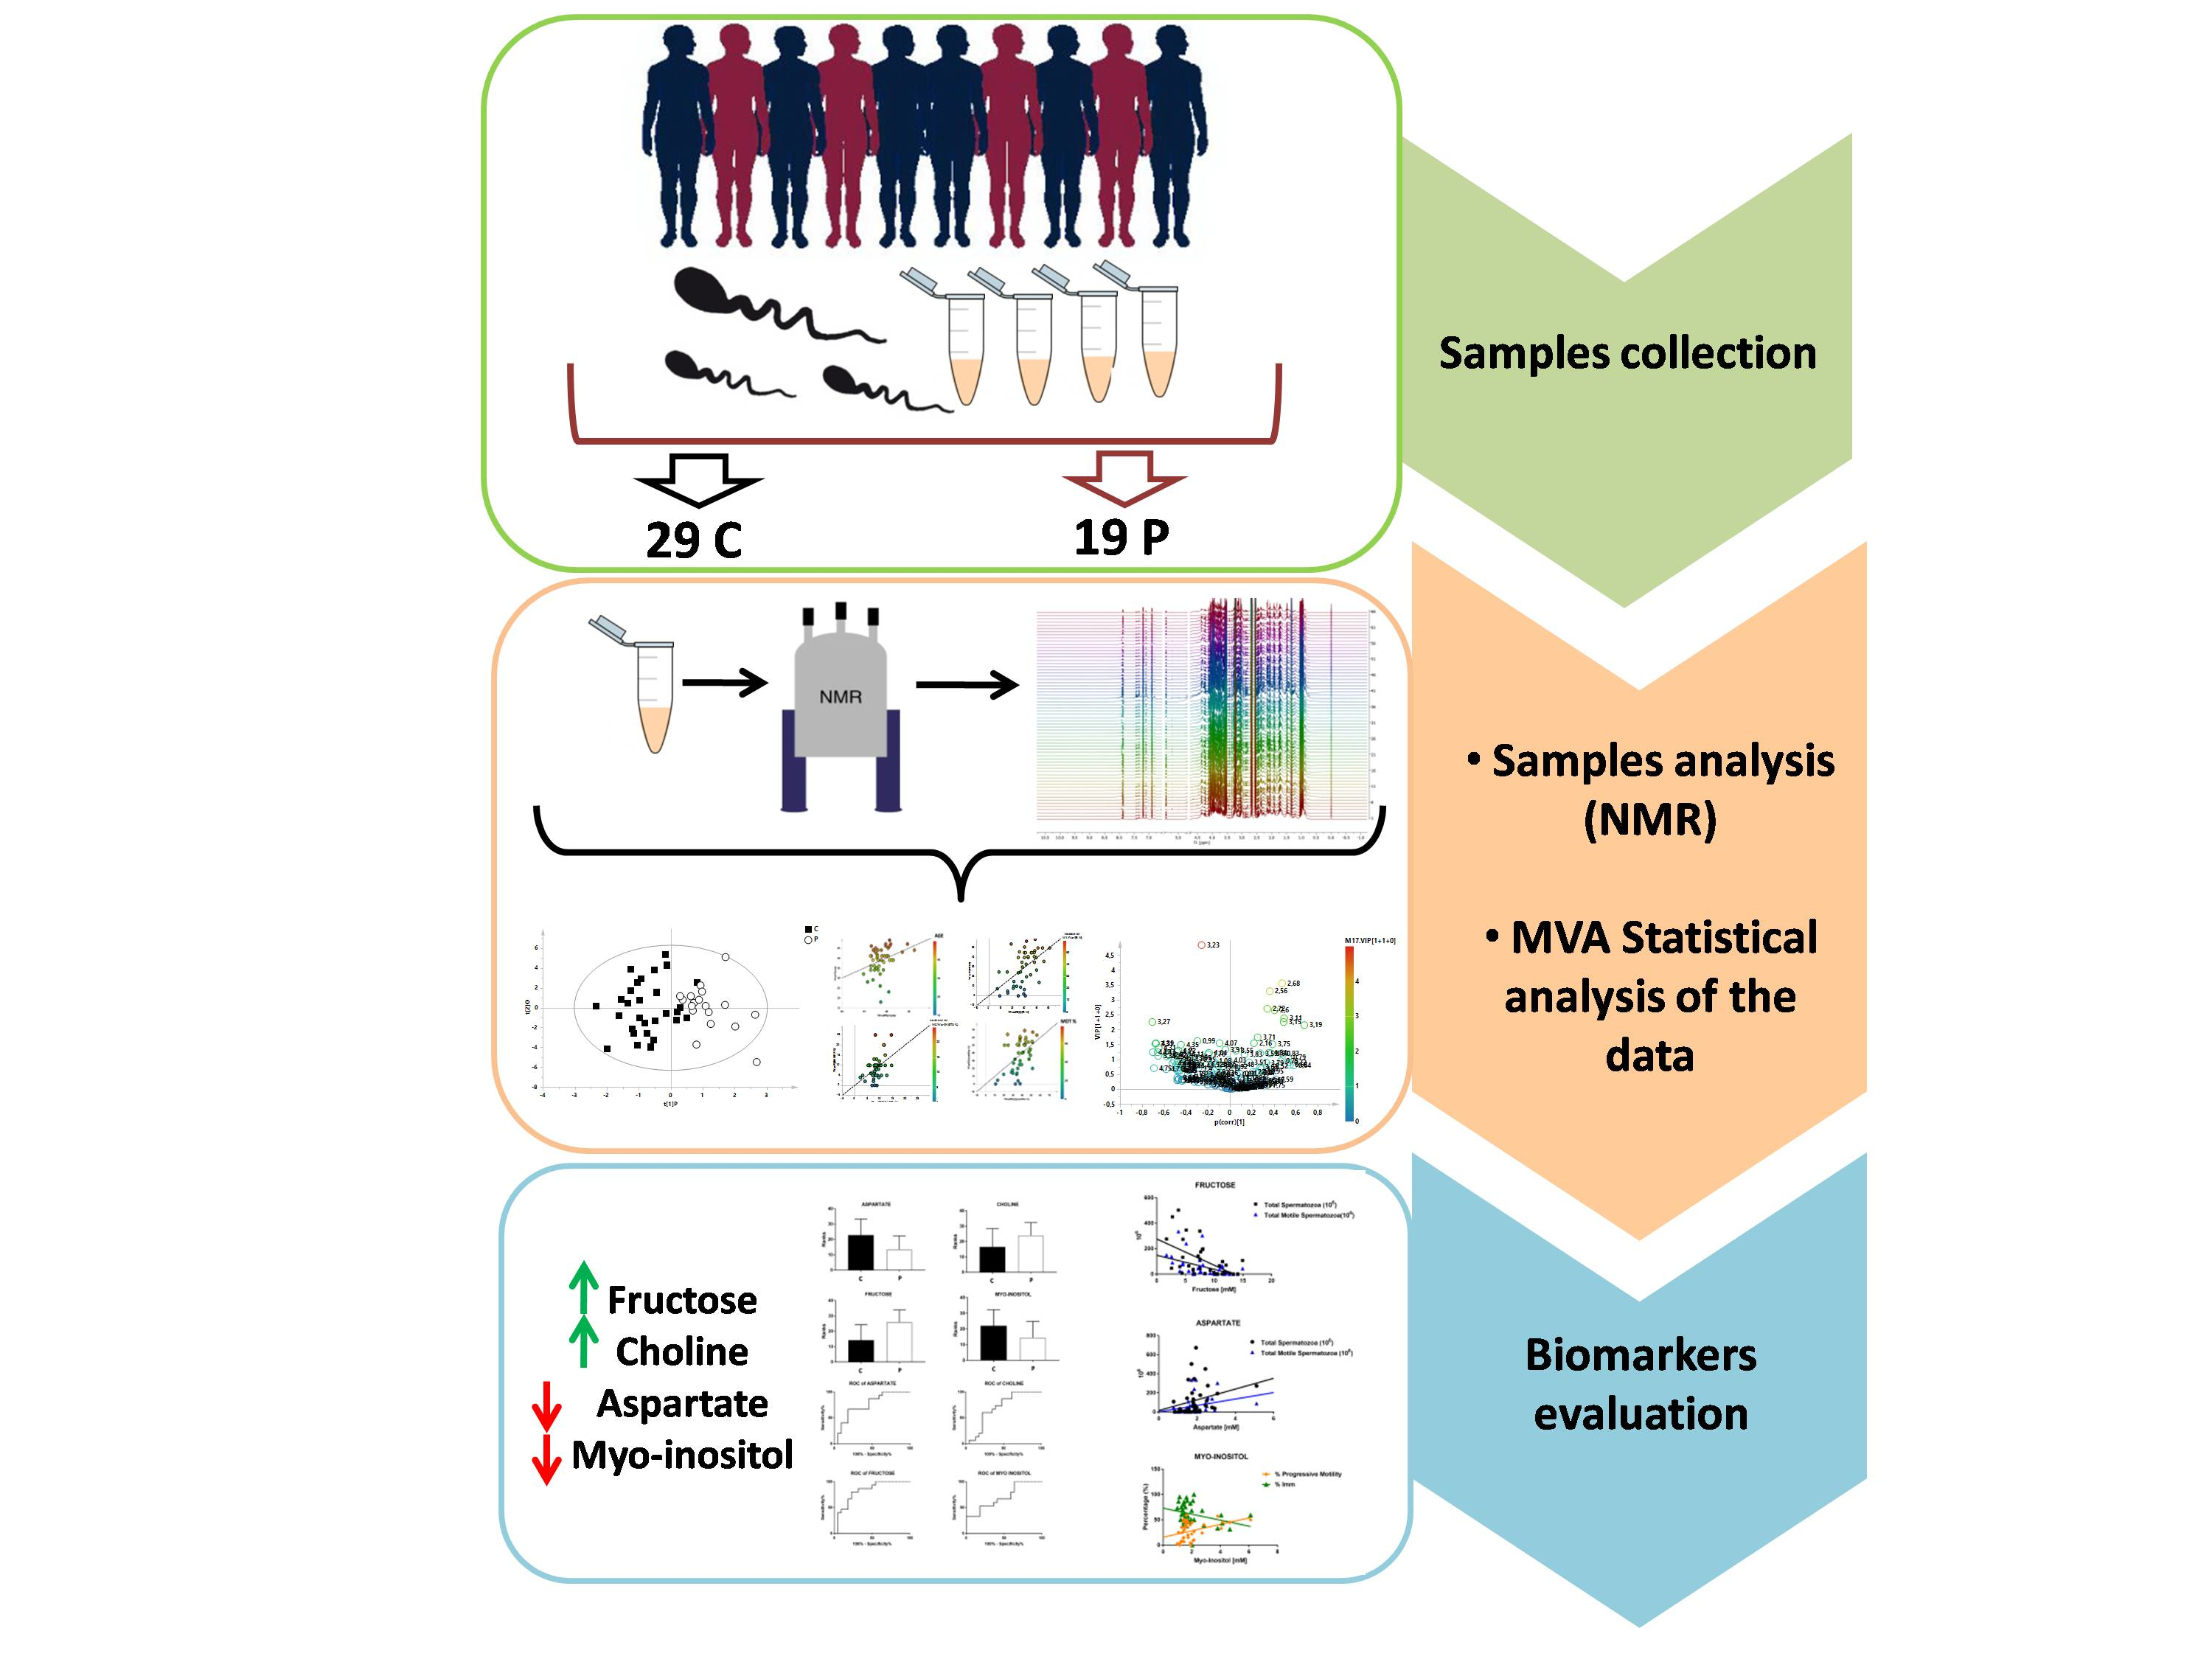
2. Methods
2.1. Sample Selection
2.2. Sample Preparation
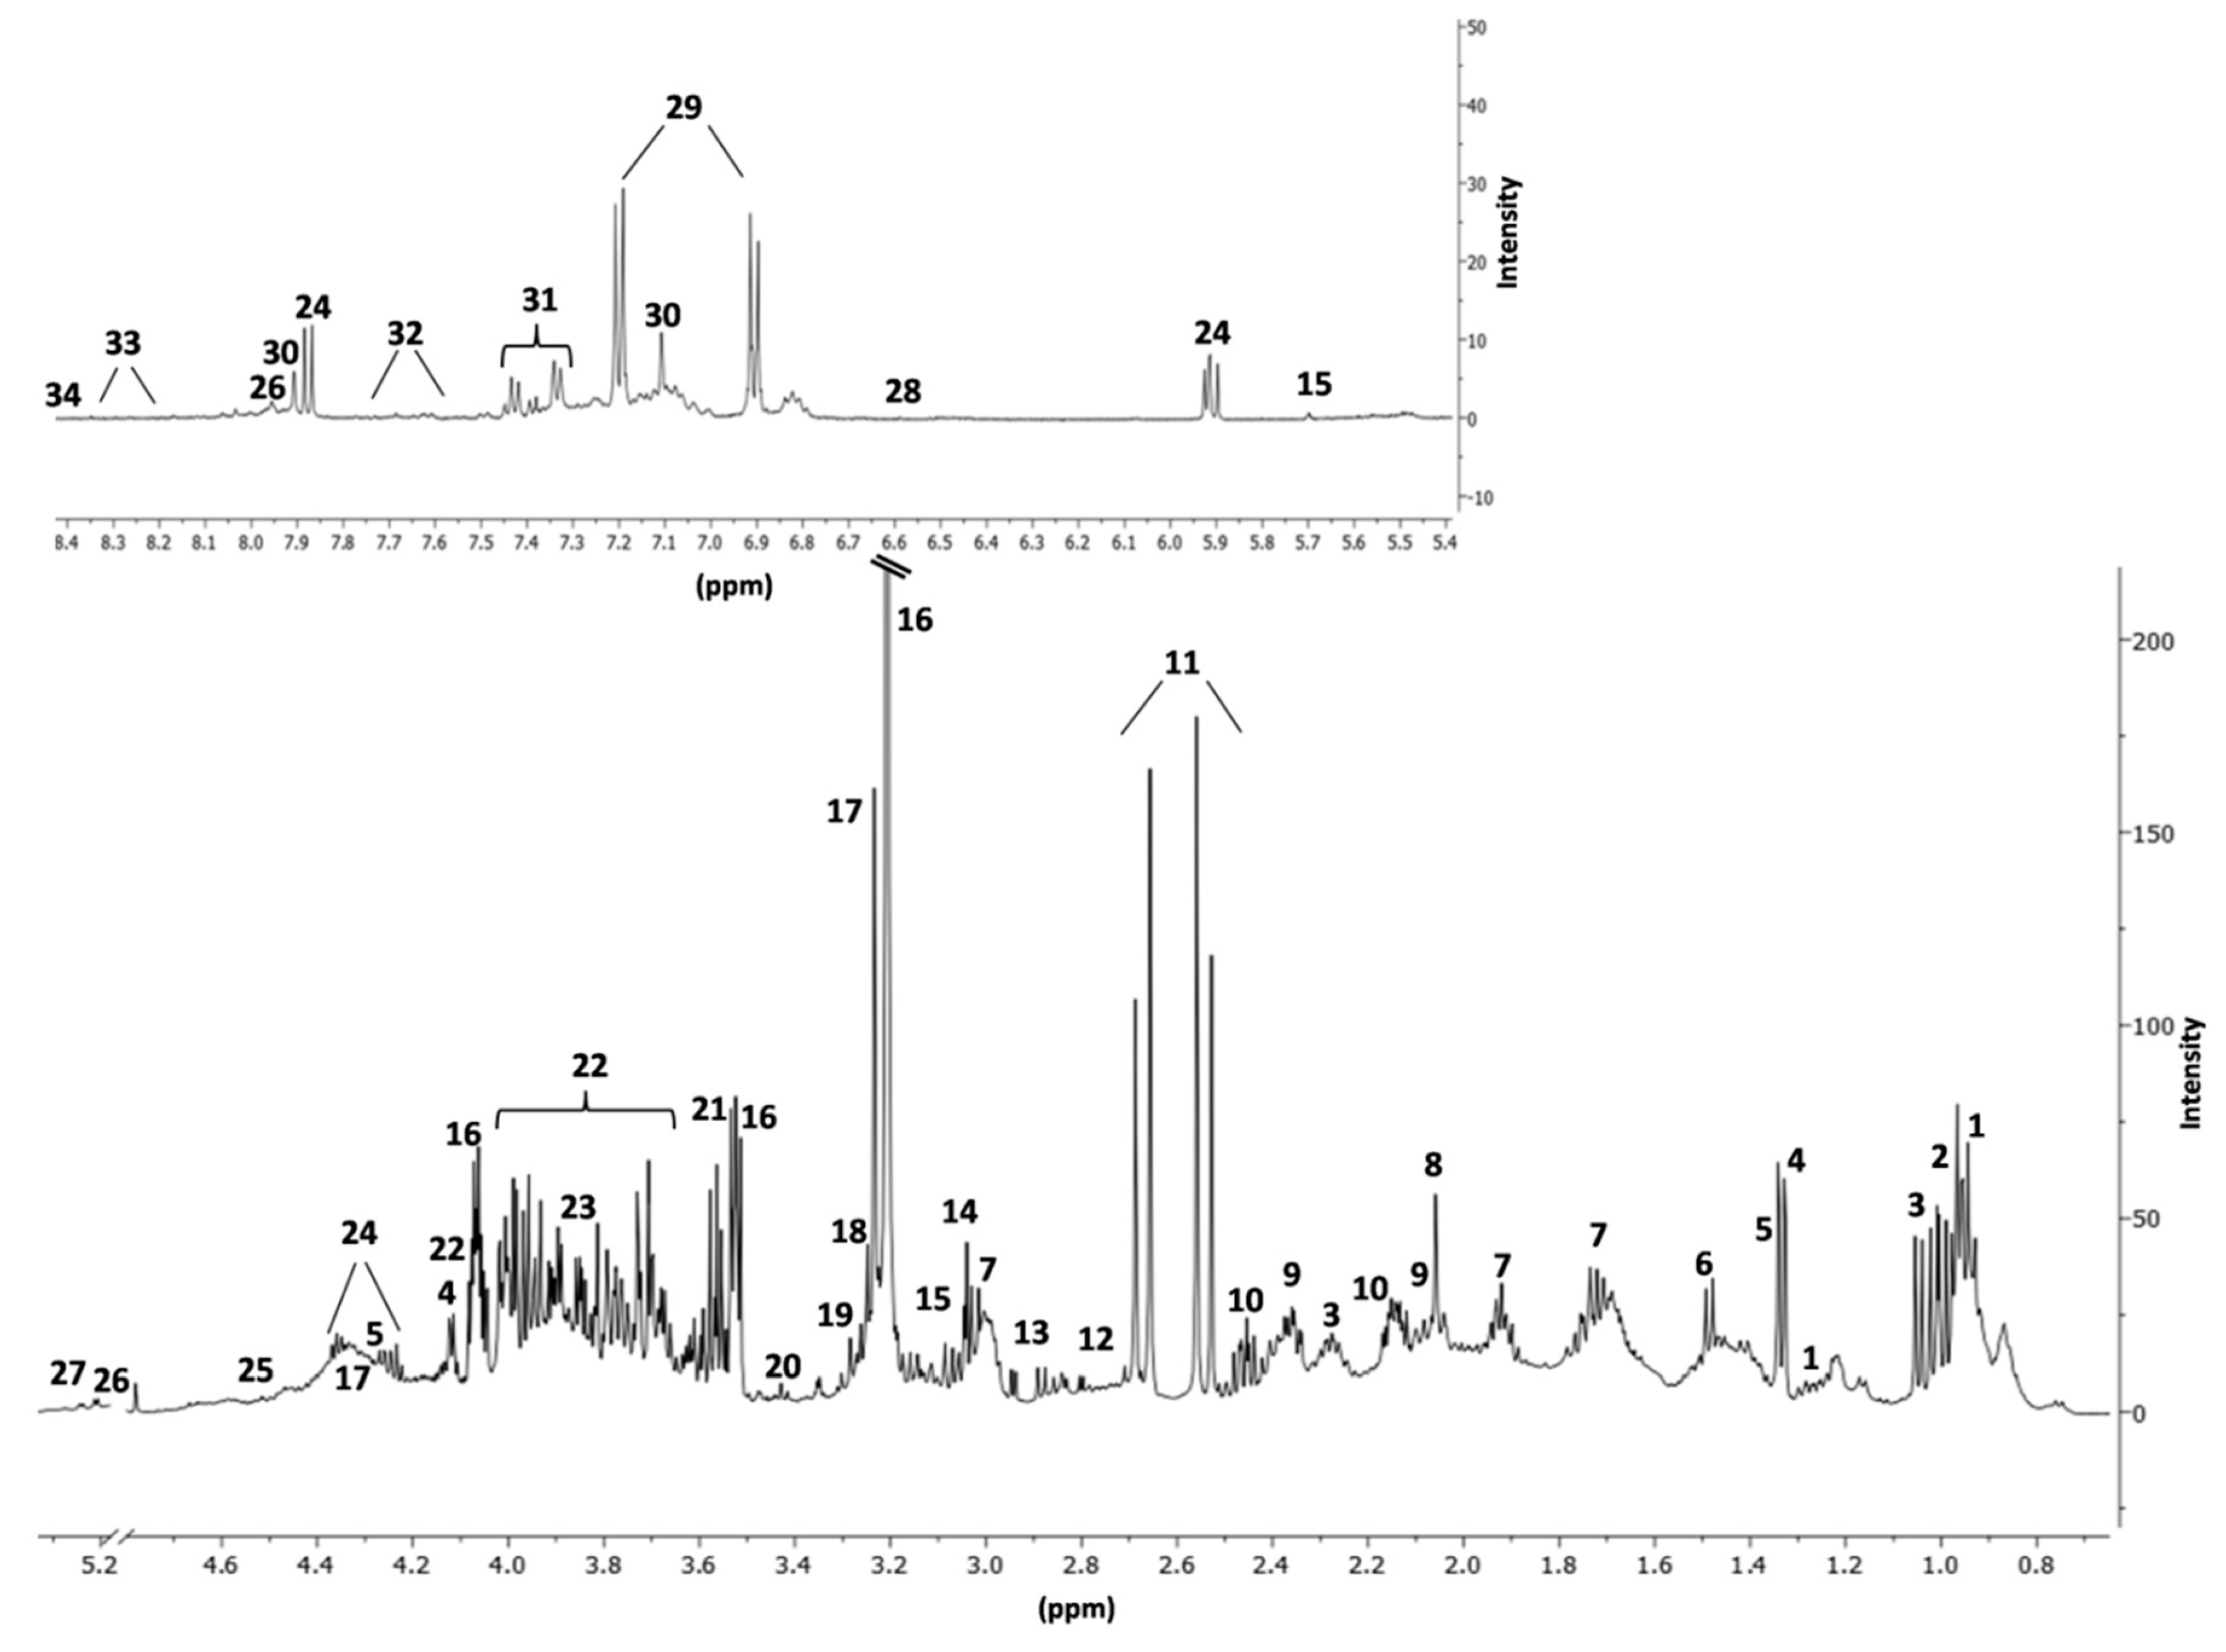
2.3. Nuclear Magnetic Resonance Analysis and Data Processing
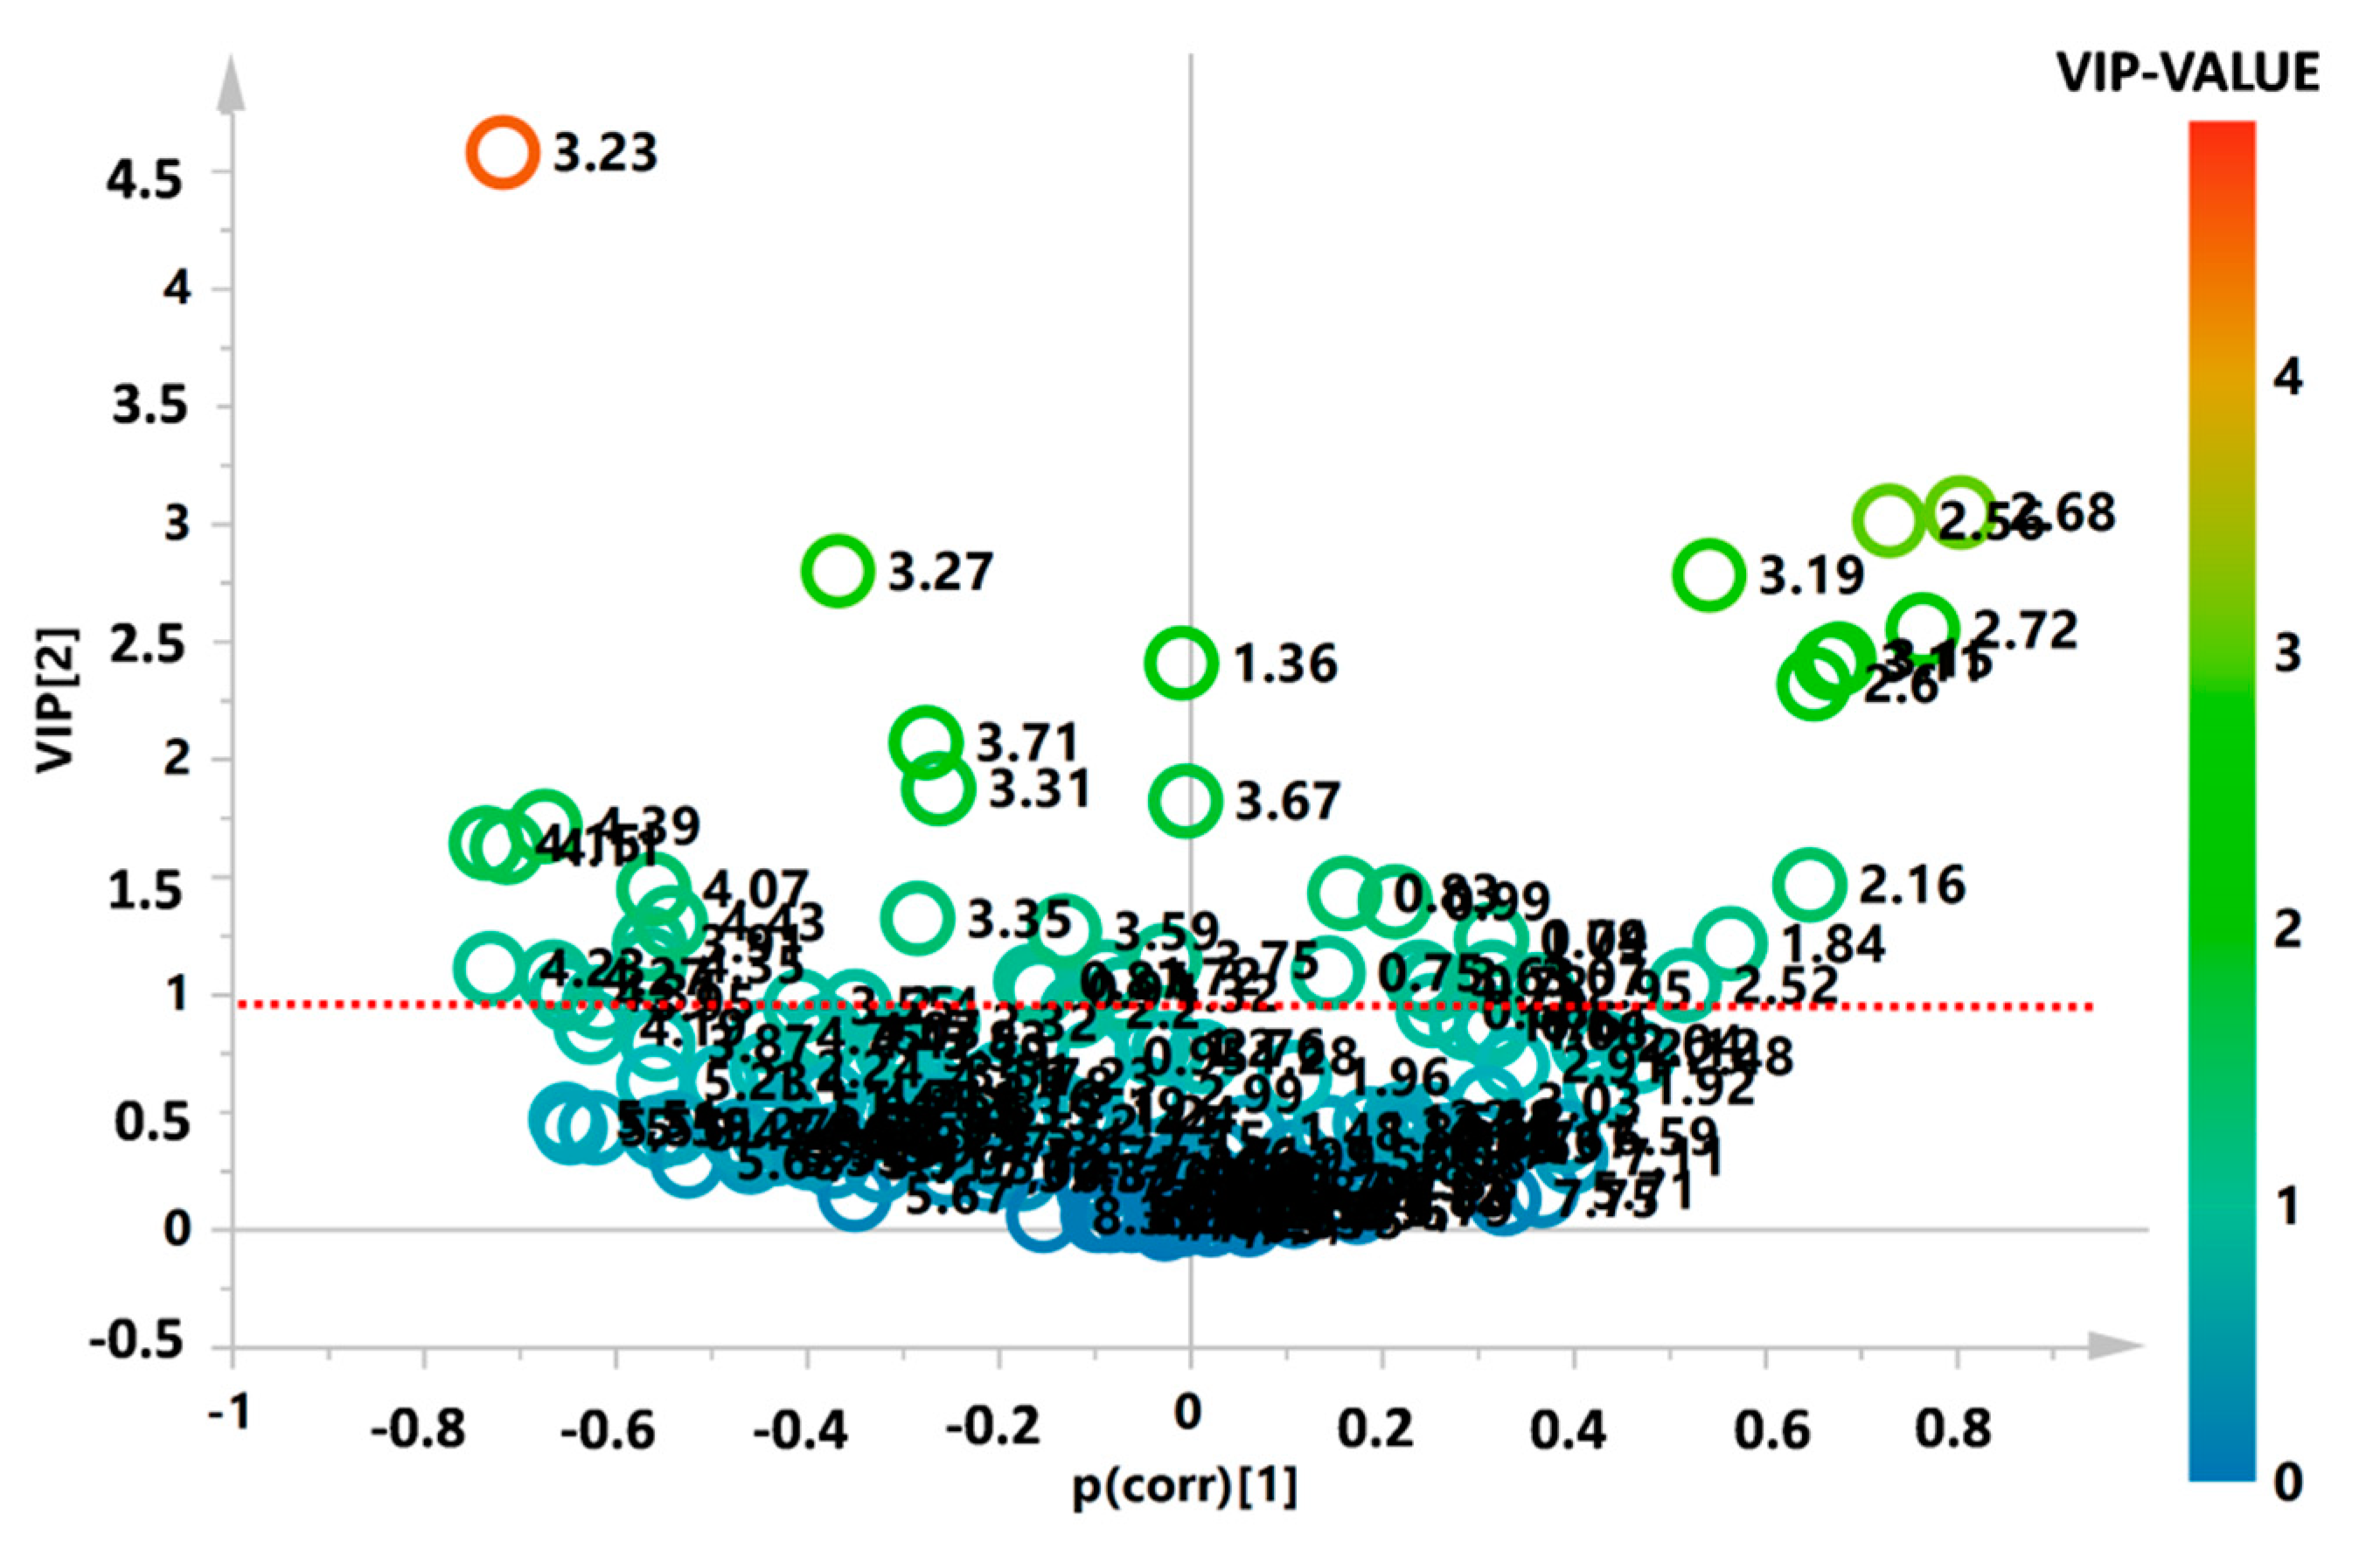
2.4. Statistical Analysis
3. Results
4. Discussion
Supplementary Materials
Author Contributions
Funding
Conflicts of Interest
References
- Rowe, P.J.; Comhaire, F.H.; Hargreave, T.B.; Mahmoud, A.M.A. WHO Manual for the Standardized Investigation, Diagnosis and Management of the Infertile Male; Cambridge University Press: Cambridge, UK, 2000. [Google Scholar]
- Cooper, T.G.; Noonan, E.; VonEckardstein, S.; Auger, J.; Gordon Baker, H.W.; Behre, H.M.; Haugen, T.B.; Kruger, T.; Wang, C.; Mbizvo, M.T. World Health Organization reference values for human semen characteristics. Hum. Reprod. Update 2010, 16, 231–245. [Google Scholar] [CrossRef] [PubMed]
- Cavallini, G. Male idiopathic oligoasthenoteratozoospermia. Asian J. Androl. 2006, 8, 143–157. [Google Scholar] [CrossRef] [PubMed]
- Hamilton, J.A.; Cissen, M.; Brandes, M.; Smeenk, J.M.J.; de Bruin, J.P.; Kremer, J.A.M.; Nelen, W.L.D.M.; Hamilton, C.J.C.M. Total motile sperm count: A better indicator for the severity of male factor infertility than the WHO sperm classification system. Hum. Reprod. 2015, 30, 1110–1121. [Google Scholar] [CrossRef] [Green Version]
- Milardi, D.; Grande, G.; Sacchini, D.; Astorri, A.L.; Pompa, G.; Giampietro, A.; De Marinis, L.; Pontecorvi, A.; Spagnolo, A.G.; Marana, R. Male fertility and reduction in semen parameters: A single tertiary–care center experience. Int. J. Endocrinol. 2012, 2012, 649149. [Google Scholar] [CrossRef]
- Pant, P. Abnormal semen parameters among men in infertile couples. Nepal J. Obstet. Gynaecol. 2013, 8, 53–55. [Google Scholar] [CrossRef] [Green Version]
- Holt, W.V. Is quality assurance in semen analysis still really necessary? A spermatologist’s view point. Hum. Reprod. 2005, 20, 2983–2986. [Google Scholar] [CrossRef] [Green Version]
- Pacey, A.A. Is quality assurance in semen analysis still really necessary? A view from the andrology laboratory. Hum. Reprod. 2006, 21, 1105–1109. [Google Scholar] [CrossRef] [Green Version]
- Dondero, F.; Lenzi, A.; Gandini, L.; Lombardo, F. Immunological infertility in humans. Exp. Clin. Immunogenet. 1993, 10, 65–72. [Google Scholar]
- Lefièvre, L.; Bedu-Addo, K.; Conner, S.J.; Machado-Oliveira, G.S.M.; Chen, Y.; Kirkman-Brown, J.C.; Afnan, M.A.; Publicover, S.J.; Ford, W.C.L. Counting sperm does not add up any more: Time for a new equation? Reproduction 2007, 133, 675–684. [Google Scholar]
- Poiani, A. Complexity of seminal fluid: A review. Behav. Ecol. Sociobiol. 2006, 60, 289–310. [Google Scholar] [CrossRef]
- Johnson, C.H.; Ivanisevic, J.; Siuzdak, G. Metabolomics: Beyond biomarkers and towards mechanisms. Nat. Rev. Mol. Cell Biol. 2016, 17, 451–459. [Google Scholar] [CrossRef] [PubMed] [Green Version]
- Murgia, F.; Svegliati, S.; Poddighe, S.; Lussu, M.; Manzin, A.; Spadoni, T.; Fischetti, C.; Gabrielli, A.; Atzori, L. Metabolomic profile of systemic sclerosis patients. Sci. Rep. 2018, 8, 7626. [Google Scholar] [CrossRef] [PubMed]
- Monni, G.; Murgia, F.; Corda, V.; Peddes, C.; Iuculano, A.; Tronci, L.; Balsamo, A.; Atzori, L. Metabolomic Investigation of Thalassemia in Chorionic Villi Samples. J. Clin. Med. 2019, 8, 798. [Google Scholar] [CrossRef] [Green Version]
- Nobeli, I.; Thornton, J.M. A bioinformatician’s view of the metabolome. Bioessays 2006, 28, 534–545. [Google Scholar] [CrossRef]
- Zhang, J.; Huang, Z.; Chen, M.; Xia, Y.; Martin, F.L.; Hang, W.; Shen, H. Urinary metabolome identifies signatures of oligozoospermic infertile men. Fertil. Steril. 2014, 102, 44–53. [Google Scholar] [CrossRef]
- Jayaraman, V.; Ghosh, S.; Sengupta, A.; Srivastava, S.; Sonawat, H.M.; Narayan, P.K. Identification of biochemical differences between different forms of male infertility by nuclear magnetic resonance (NMR) spectroscopy. J. Assist. Reprod. Genet. 2014, 31, 1195. [Google Scholar] [CrossRef] [Green Version]
- Ma, P.; Zhang, Z.; Zhou, X.; Luo, J.; Lu, H.; Wang, Y. Characterizing semen abnormality male infertility using non-targeted blood plasma metabolomics. PLoS ONE 2019, 14, e0219179. [Google Scholar] [CrossRef]
- Hamamah, S.; Seguin, F.; Barthelemy, C.; Akoka, S.; Le Pape, A.; Lansac, J.; Royere, D. 1H nuclear magnetic resonance studies of seminal plasma from fertile and infertile men. J. Reprod. Fertil. 1993, 97, 51–55. [Google Scholar] [CrossRef] [Green Version]
- Makler, A. A new chamber for rapid sperm count and motility estimation. Fertil. Steril. 1978, 30, 313–318. [Google Scholar] [CrossRef]
- Italian Society of Laboratory Medicine (SIMeL). Standardizzazione delle procedure per l’esame del liquido seminale: Linee guida metodologiche. Riv Med. Lab JLM 2004, 5, N.1. [Google Scholar]
- World Health Organisation. WHO Laboratory Manual for the Examination and Processing of Human Semen, 5th ed.; WHO: Geneva, Switzerland, 2010. [Google Scholar]
- Bligh, E.G.; Dyer, W.J. A rapid method of total lipid extraction and purification. Can. J. Biochem. Physiol. 1959, 37, 911–917. [Google Scholar] [CrossRef] [PubMed] [Green Version]
- Eriksson, L.; Byrne, T.; Johansson, E.; Trygg, J.; Vikstrom, C. Multi-and Megavariate Data Analysis Basic. Principles and Applications, 3rd ed.; Umetrics Academy: Malmo, Sweden, 2013; pp. 1–501. [Google Scholar]
- Rousseau, R.; Govaerts, B.; Verleysen, M.; Boulanger, B. Comparison of some chemometric tools for metabonomics biomarker identification. Chemom. Intell. Lab. Syst. 2008, 91, 54–66. [Google Scholar] [CrossRef]
- Trygg, J.; Holmes, E.; Lundstedt, T. Chemometrics in metabonomics. J. Proteome Res. 2007, 6, 469–479. [Google Scholar] [CrossRef] [PubMed]
- Lindgren, F.; Hansen, B.; Karcher, W.; Sjöström, M.; Eriksson, L. Model validation by permutation tests: Applications to variable selection. J. Chemom. 1996, 10, 521–532. [Google Scholar] [CrossRef]
- Wold, S.; Eriksson, L. PLS_regression: A basic tool of chemometrics. J. Chemom. 2001, 58, 109–130. [Google Scholar]
- Weljie, A.M.; Newton, J.; Mercier, P.; Carlson, E.; Slupsky, C.M. Targeted profiling: Quantitative analysis of 1HNMR metabolomics data. Anal. Chem. 2006, 78, 4430–4442. [Google Scholar] [CrossRef] [PubMed]
- Jafarzadeh, N.; Varnosfaderani, A.M.; Minai-Tehrani, A.; Savadi-Shiraz, E.; Sadeghi, M.R.; Gilany, K. Metabolomics Fingerprinting of seminal plasma from unexplained infertile men: A need for novel diagnostic biomarkers. Mol. Reprod. Dev. 2015, 82, 150. [Google Scholar] [CrossRef]
- Zhao, K.; Zhang, J.; Xu, Z.; Xu, Y.; Xu, A.; Chen, W.; Miao, C.; Liu, S.; Wang, Z.; Jia, R. Metabolomic profiling of human spermatozoa in idiopathic asthenozoospermic patients using Gas Chromatography-Mass spectrometry. Bio Med. Res. Int. 2018, 2018, 8327506. [Google Scholar]
- Mann, T.; Lutwak-Mann, C. Biochemistry of seminal plasma and male accessory fluid: Application to andrological problems. In Male Reproductive Function and Semen; Mann, T., Lutwak-Mann, C., Eds.; Springer: New York, NY, USA, 1981; pp. 269–336. [Google Scholar]
- Gonzales, G.F.; Garcia-hjarles, M.; Napuri, R. Corrected Seminal Fructose Levels: Index of Secretory Activity of Seminal Vesicles. Arch. Androl. 1988, 21, 135–142. [Google Scholar] [CrossRef] [Green Version]
- Yoshida, K.; LaNasa, J.; Takahashi, J.; Stephen, J.; Winters, S.J.; Oshima, H.; Troen, P. Studies of the human testis. XVI: Evaluation of multiple indexes of testicular function in relation to advanced age, idiopathic oligospermia, or varicocele. Fertil. Steril. 1982, 38, 712–720. [Google Scholar] [CrossRef]
- Stachecki, J.J.; Armant, D.R. Transient release of calcium from inosito l1,4,5-trisphosphate-specific stores regulates mouse preimplantation development. Development 1996, 122, 2485–2496. [Google Scholar] [PubMed]
- Beemster, P.; Groenen, P.; Steegers-Theunissen, R. Involvement of inositol in reproduction. Nutr. Rev. 2002, 60, 80–87. [Google Scholar] [CrossRef] [PubMed]
- Ciotta, L.; Stracquadanio, M.; Pagano, I.; Carbonaro, A.; Palumbo, M.; Gulino, F. Effects of myo-inositol supplementation on oocyte’s quality in PCOS patients: A double blind trial. Eur. Rev. Med. Pharmacol. Sci. 2011, 15, 509–514. [Google Scholar] [PubMed]
- Ching-Hei, Y.; Anapolski, M.; Setiawan, I.; Lang, F.; Cooper, T.G. Effects of putative epididymal osmolytes on sperm volume regulation of fertile and infertile c-ros transgenic mice. J. Androl. 2004, 25, 216–223. [Google Scholar]
- Martínez-Heredia, J.; De Mateo, S.; Vidal-Taboada, M.J.; Ballescà, J.L.; Oliva, R. Identification of proteomic differences in asthenozoospermic sperm samples. Hum. Reprod. 2008, 23, 783–791. [Google Scholar] [CrossRef] [Green Version]
- Colone, M.; Marelli, G.; Unfer, V.; Bozzuto, G.; Molinari, A.; Stringaro, A. Inositol activity in oligoasthenoteratospermia-an in vitro study. Eur. Rev. Med. Pharmacol. Sci. 2010, 14, 891–896. [Google Scholar]
- Condorelli, R.A.; la Vignera, S.; Bellanca, S.; Vicari, E.; Calogero, A.E. Myo-inositol: Does it improve sperm mitochondrial function and sperm motility? Urology 2012, 79, 1290–1295. [Google Scholar] [CrossRef]
- Hinton, B.T.; White, R.W.; Setchell, B.P. Concentrations of myo-inositol in the luminal fluid of the mammalian testis and epididymis. J. Reprod. Fertil. 1980, 58, 395–399. [Google Scholar] [CrossRef] [Green Version]
- Chauvin, T.R.; Griswold, M.D. Characterization of the expression and regulation of genes necessary for myo-inositol biosynthesis and transport in the seminiferous epithelium. Biol. Reprod. 2004, 70, 744–751. [Google Scholar] [CrossRef]
- Gulino, F.A.; Leonardi, E.; Marilli, I.; Musmeci, G.; Vitale, S.G.; Leanza, V.; Palumbo, M.A. Effect of treatment with myo-inositol on semen parameters of patients undergoing an IVF cycle: In vivo study. Gynecol. Endocrinol. 2016, 32, 65–68. [Google Scholar] [CrossRef]
- Zhang, X.; Diao, R.; Zhu, X.; Li, Z.; Cai, Z. Metabolic characterization of asthenozoospermia using nontargeted seminal plasma metabolomic. Clin. Chim. Acta 2015, 450, 254–261. [Google Scholar] [CrossRef] [PubMed]
- Mumcu, A.; Karaer, A.; Dogan, B.; Tuncay, G. Metabolomics analysis of seminal plasma in patients with idiopathic Oligoasthenoteratozoospermia using high-resolution NMR spectroscopy. Andrologia 2020. [Google Scholar] [CrossRef] [PubMed]
- D’Aniello, A.; Di Cosmo, A.; Di Cristo, C.; Annunziato, L.; Petrucelli, L.; Fisher, G. Involvement of D-aspartic acid in the synthesis of testosterone in rat testes. Life Sci. 1996, 59, 97–104. [Google Scholar] [CrossRef]
- Nagata, Y.; Homma, H.; Lee, J.A.; Imai, K. D-Aspartate stimulation of testosterone synthesis in rat Leydig cells. Febs Lett. 1999, 444, 160–164. [Google Scholar] [CrossRef]
- D’Aniello, A.; Di Fiore, M.M.; D’Aniello, G.; Frantz, E.; Colin, F.E.; Lewis, G.; Setchell, B.P. Secretion of D-aspartic acid by the rat testis and its role in endocrinology of the testis and spermatogenesis. FEBS Lett. 1998, 436, 23–27. [Google Scholar] [CrossRef] [Green Version]
- D’Aniello, G.; Ronsini, S.; Guida, F.; Spinelli, P.; D’Aniello, A. Occurrence of D-aspartic acid in human seminal plasma and spermatozoa: Possible role in reproduction. Fertil. Steril. 2005, 84, 1444–1449. [Google Scholar] [CrossRef]


| Cohort | ||
|---|---|---|
| Control | Oligozoospermia | |
| N | 29 | 18 |
| AGE (mean ±SD) | 38.9 ± 7 | 38.8 ± 6 |
| Total Spermatozoa (106) (mean) | 172.5 | 48.6 |
| MotileSpermatozoa (106) (mean) | 92.4 | 24.5 |
| Motility % (mean ± SD) | 44.5 ± 1.5 | 26.8 ± 23 |
| Progressive Motility % (mean ± SD) | 18.6 ± 9 | 6.7 ± 10 |
| % of “in situ” motility (mean ± SD) | 7.7 ± 3 | 10 ± 8 |
| Seminal Fluid | ||||||||
|---|---|---|---|---|---|---|---|---|
| Metabolites | C | P | p-Value | ROC-Curve | ||||
| AUC | Std. Error | CI | p-Value | |||||
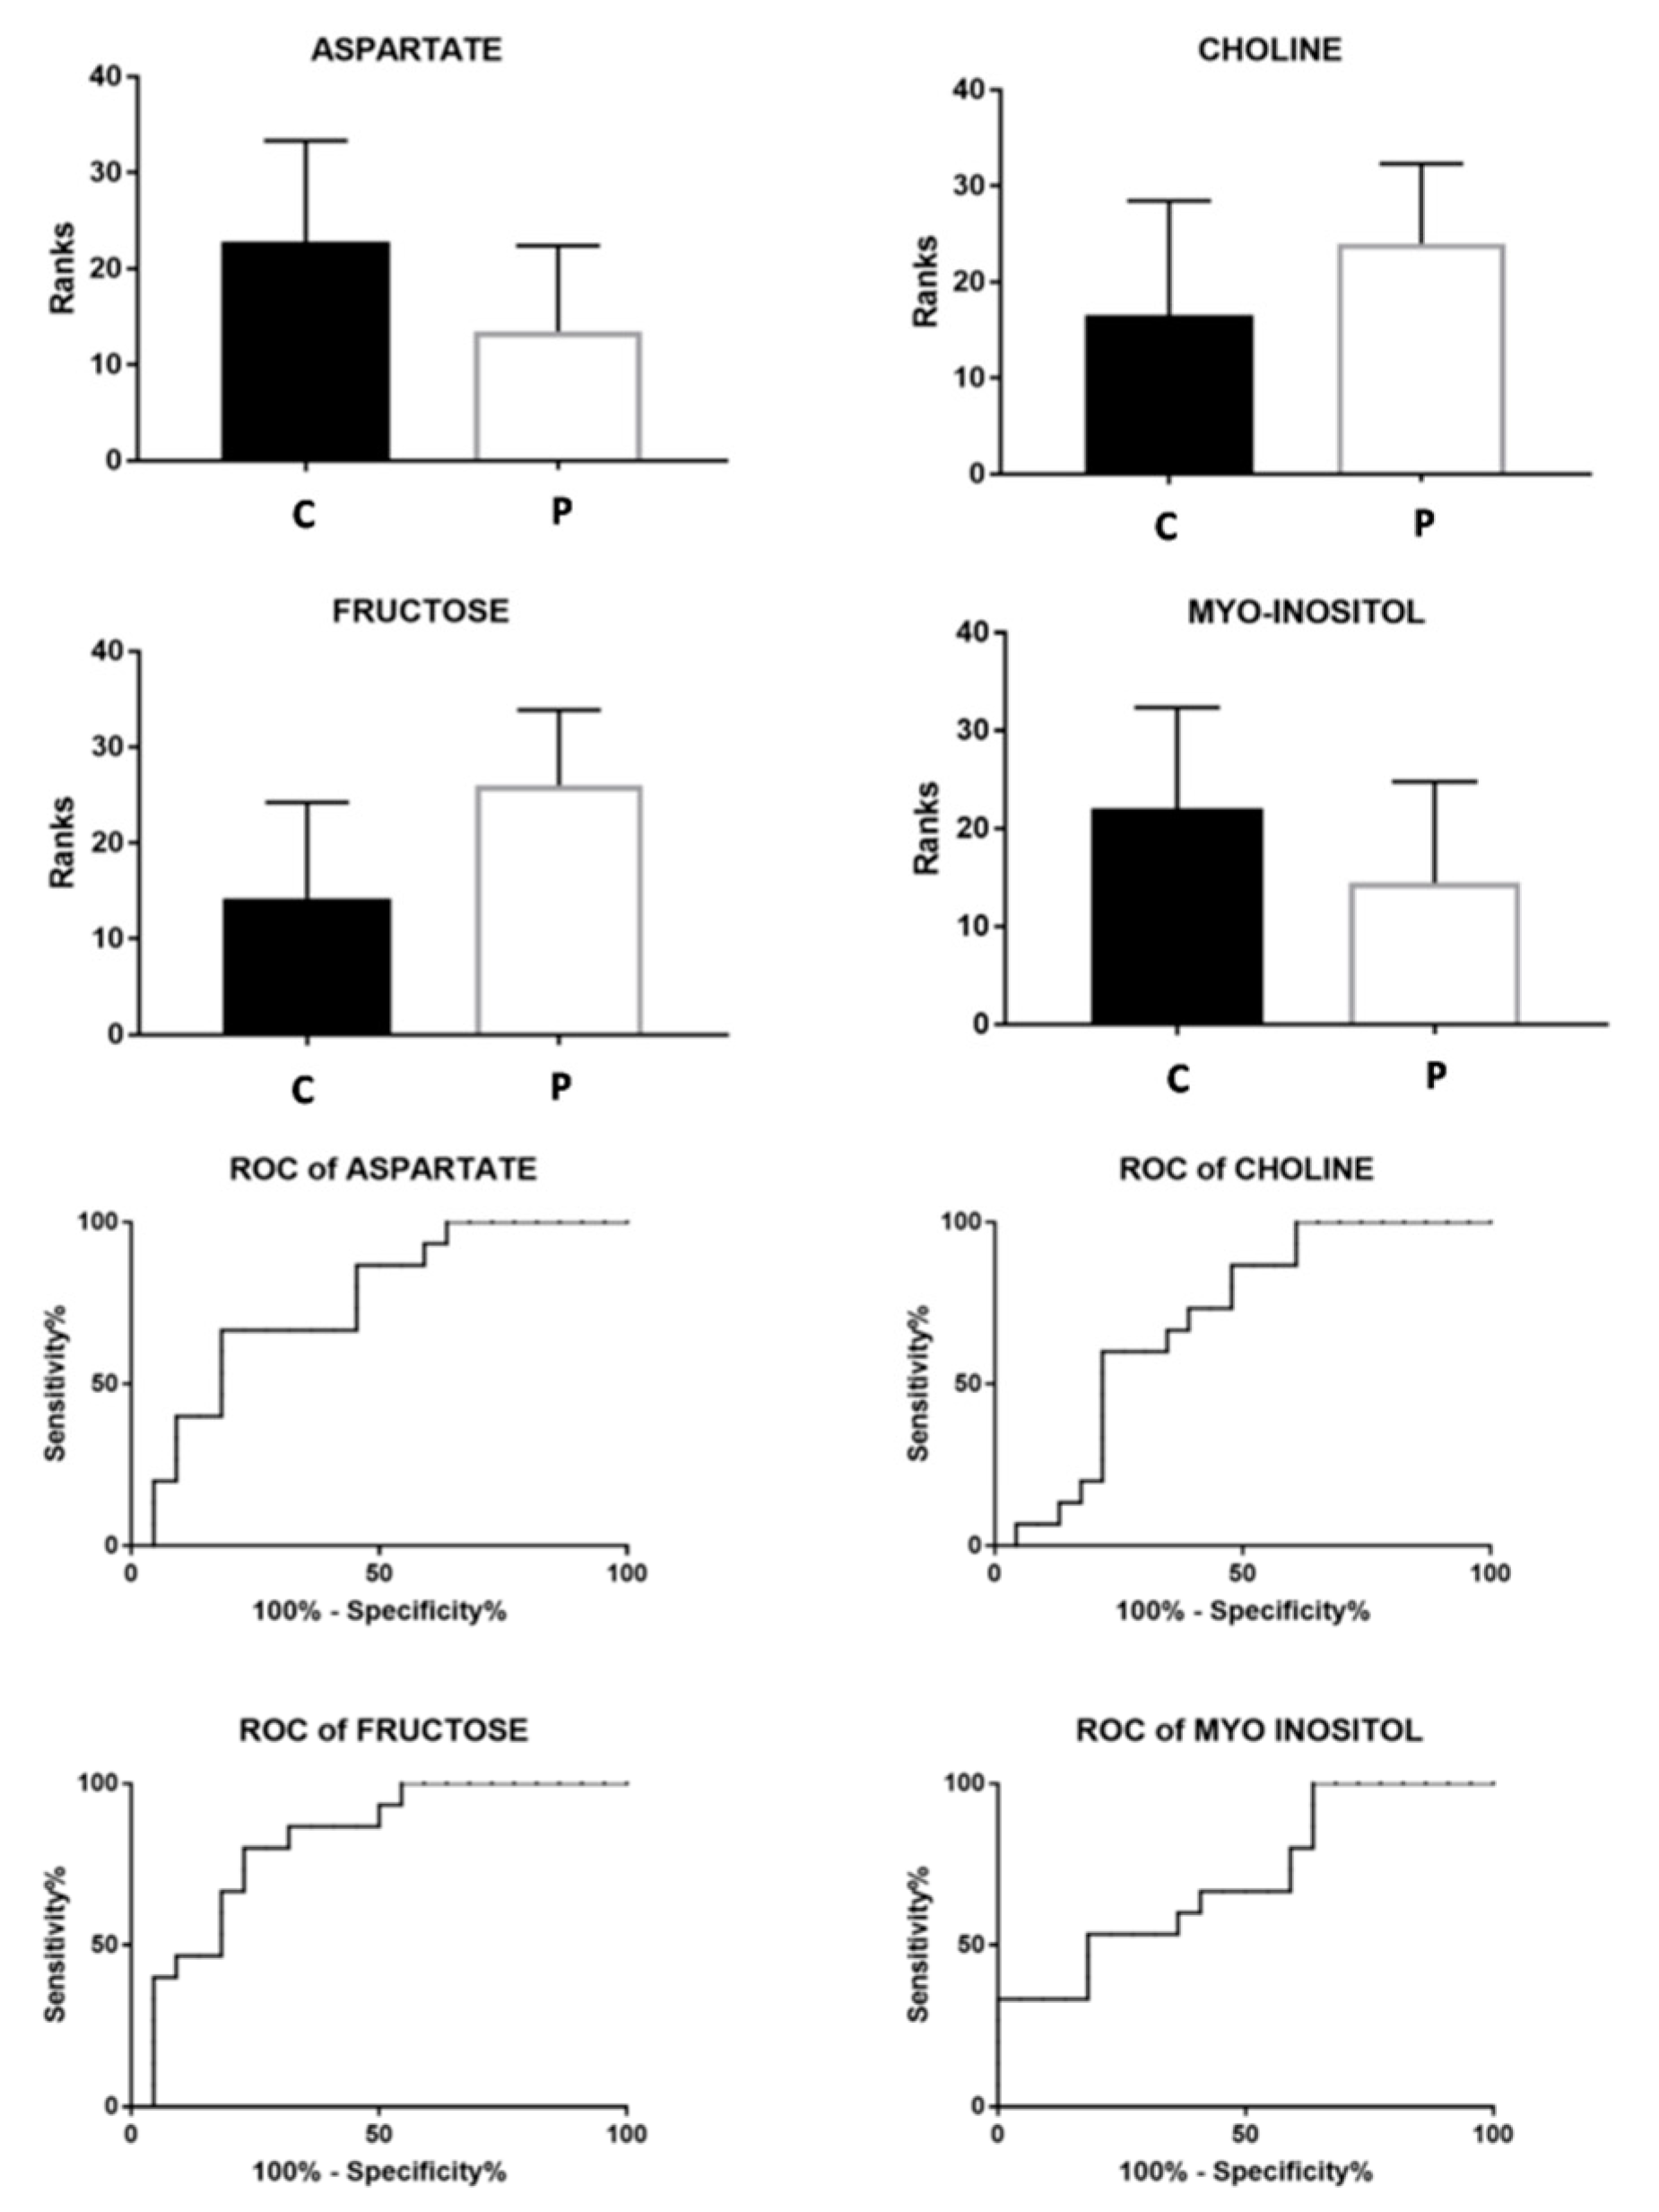
| NMR | ASPARTATE | + | − | 0.009 | 0.76 | 0.08 | 0.6–0.9 | 0.01 |
| CHOLINE | − | + | 0.04 | 0.7 | 0.08 | 0.53–0.86 | 0.04 | |
| FRUCTOSE | − | + | 0.0008 | 0.82 | 0.07 | 0.67–0.94 | 0.001 | |
| MYO-INOSITOL | + | − | 0.03 | 0.71 | 0.08 | 0.54–0.88 | 0.03 | |
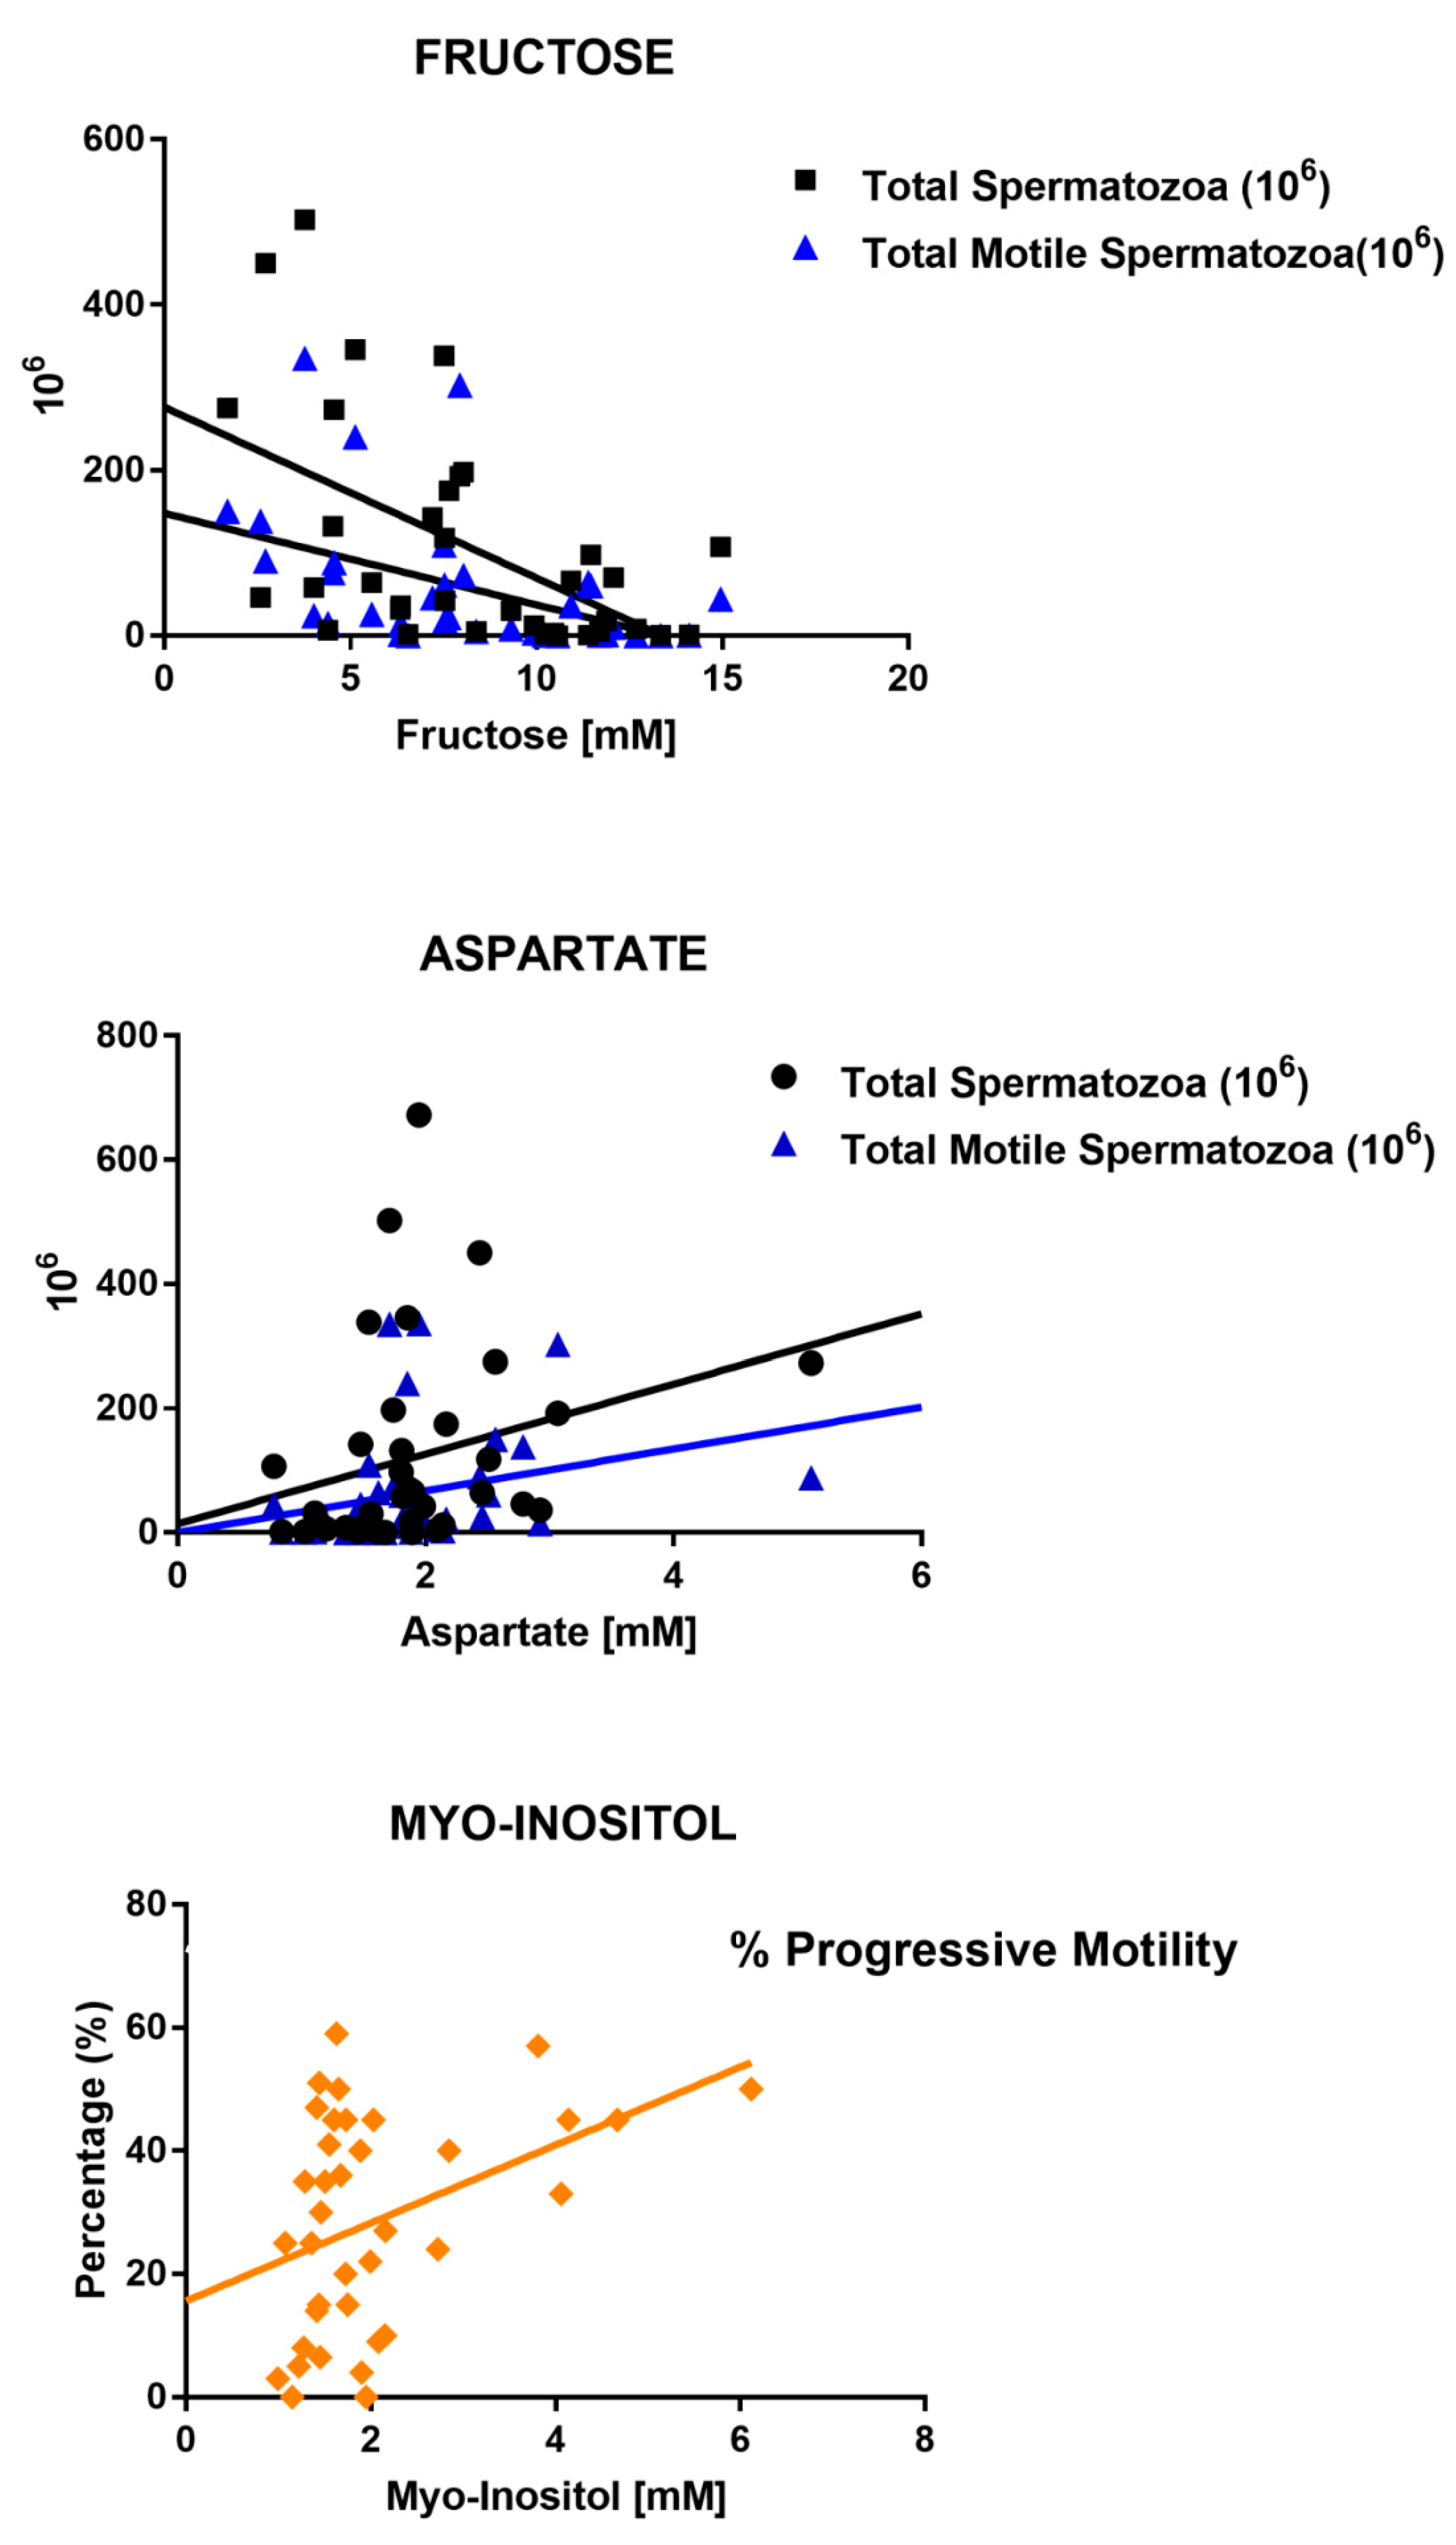
| Parameters | Age | Total Spermatozoa (106) | Total Motile Spermatozoa (106) | % Motility | % Progressive Motility | % of “In Situ” Motility | |
|---|---|---|---|---|---|---|---|
| FRUCTOSE | r | −0.21 | −0.53 | −0.59 | −0.23 | −0.32 | 0.02 |
| CI | −0.51/0.13 | −0.73/−0.23 | −0.77/−0.31 | −0.53/0.11 | −0.6/0.01 | −0.31/0.36 | |
| p-Value | ns | 0.0009 | 0.0001 | ns | ns | ns | |
| CHOLINE | r | 0.07 | −0.22 | −0.32 | −0.03 | −0.07 | 0.09 |
| CI | −0.26/0.4 | −0.52/0.11 | −0.59/0.01 | −0.36/0.3 | −0.39/0.27 | −0.25/0.40 | |
| p-Value | ns | ns | ns | ns | ns | ns | |
| ASPARTATE | r | −0.09 | 0.40 | 0.44 | 0.14 | 0.30 | −0.05 |
| CI | −0.40/0.25 | 0.08/0.64 | 0.12/0.67 | −0.19/0.45 | −0.04/0.57 | −0.38/0.28 | |
| p-Value | ns | 0.01 | 0.006 | ns | ns | ns | |
| MYO-INOSITOL | r | 0.24 | 0.33 | 0.21 | 0.29 | 0.34 | −0.06 |
| CI | −0.09/0.53 | −0.00/0.60 | −0.12/0.50 | −0.05/0.56 | −0.01/0.59 | −0.38/0.27 | |
| p-Value | ns | ns- | ns | ns | 0.04 | ns |
© 2020 by the authors. Licensee MDPI, Basel, Switzerland. This article is an open access article distributed under the terms and conditions of the Creative Commons Attribution (CC BY) license (http://creativecommons.org/licenses/by/4.0/).
Share and Cite
Murgia, F.; Corda, V.; Serrenti, M.; Usai, V.; Santoru, M.L.; Hurt, K.J.; Passaretti, M.; Monni, M.C.; Atzori, L.; Monni, G. Seminal Fluid Metabolomic Markers of Oligozoospermic Infertility in Humans. Metabolites 2020, 10, 64. https://doi.org/10.3390/metabo10020064
Murgia F, Corda V, Serrenti M, Usai V, Santoru ML, Hurt KJ, Passaretti M, Monni MC, Atzori L, Monni G. Seminal Fluid Metabolomic Markers of Oligozoospermic Infertility in Humans. Metabolites. 2020; 10(2):64. https://doi.org/10.3390/metabo10020064
Chicago/Turabian StyleMurgia, Federica, Valentina Corda, Marianna Serrenti, Valeria Usai, Maria Laura Santoru, K. Joseph Hurt, Mauro Passaretti, Maria Carla Monni, Luigi Atzori, and Giovanni Monni. 2020. "Seminal Fluid Metabolomic Markers of Oligozoospermic Infertility in Humans" Metabolites 10, no. 2: 64. https://doi.org/10.3390/metabo10020064