Article

Health-Related Quality of Life in Chronic Liver Diseases: A Strong Impact of Hand Grip Strength

Division of Hepatobiliary and Pancreatic disease, Department of Internal Medicine, Hyogo College of Medicine, Hyogo, Nishinomiya 663-8501, Japan
*
Author to whom correspondence should be addressed.
J. Clin. Med. 2018, 7(12), 553; https://doi.org/10.3390/jcm7120553
Submission received: 8 November 2018 / Revised: 12 December 2018 / Accepted: 14 December 2018 / Published: 15 December 2018
(This article belongs to the Section Gastroenterology & Hepatopancreatobiliary Medicine)

Abstract

:
We sought to examine the influence of hand grip strength (HGS) and skeletal muscle mass (SMM) on the health-related quality of life (H-QOL) as evaluated by the 36-Item Short-Form Health Survey (SF-36) questionnaire in chronic liver diseases (CLDs, 198 men and 191 women). Decreased HGS was defined as HGS <26 kg for men and <18 kg for women. Decreased SMM was defined as SMM index <7.0 kg/m2 for men and <5.7 kg/m2 for women, using bioimpedance analysis. SF-36 scores were compared between groups stratified by HGS or SMM. Between-group differences (decreased HGS vs. non-decreased HGS) in the items of physical functioning (PF), role physical (RP), bodily pain, vitality (VT), social functioning (SF), role emotional (RE), and physical component summary score (PCS) reached significance, while between-group differences (decreased SMM vs. non-decreased SMM) in the items of PF, SF and RE were significant. Multivariate analyses revealed that HGS was significantly linked to PF (p = 0.0031), RP (p = 0.0185), and PCS (p = 0.0421) in males, and PF (p = 0.0034), VT (p = 0.0150), RE (p = 0.0422), and PCS (p = 0.0191) in females. HGS had a strong influence especially in the physiological domains in SF-36 in CLDs.

1. Introduction

The health-related quality of life (H-QOL) is a patient-centered clinical outcome that is used internationally for patients with various diseases, including diabetes mellitus, and cardiovascular diseases, renal diseases and malignancies [1,2,3,4]. Chronic liver diseases (CLDs) can also affect H-QOL [5,6,7,8,9]. Due to the adverse clinical and patient-reported outcomes, and the economic burden of CLDs, improving H-QOL in patients with CLDs should be a major treatment goal [5,6,7,8,9]. A previous study reported that higher H-QOL was associated with favorable clinical outcome in patients with CLDs and increasing the number of pivotal clinical trials have adopted H-QOL as additional study endpoints [10,11]. The most extensively used assessment methods for H-QOL is the 36-Item Short Form Health Survey (SF-36) [12,13,14,15,16].
Skeletal muscle mass (SMM) increases till 20 years, peaks between 20 and 50 years, and decreases by approximately 1% after the age of 50 years, due to changes in muscle fiber type and size [17]. Sarcopenia is a clinical disease entity that is defined by diminished muscle function and SMM [18,19,20,21,22,23,24,25,26,27,28]. It can be associated with worse clinical outcomes and higher health care costs in various diseases, and there is therefore urgent need for the establishment of methods for improving sarcopenia [18,19,20,21,22,23,24,25,26,27,28]. This also applies to CLD patients [19,21,23]. Sarcopenia is the main component of malnutrition, and it is primarily responsible for the unfavorable clinical consequences that are observed in CLD patients [19,21,23]. Liver cirrhosis (LC) can easily complicate sarcopenia, due to impaired protein synthesis [19]. Currently, the Japanese Society of Hepatology (JSH) reported that the original criteria for sarcopenia in liver diseases, with reference to the Asian criteria for sarcopenia [18,22]. The JSH criteria use hand grip strength (HGS) for muscle strength assessment, and bioimpedance analysis (BIA) and/or computed tomography for muscle mass assessment, while unlike the Asian criteria for sarcopenia, there is no age restriction for the assessment of sarcopenia in the JSH criteria, because younger patients with severe advanced CLDs such as liver failure are likely to be involved in sarcopenia [18].
However, as far as we are aware, scarce data regarding the relevance between H-QOL and HGS and SMM in CLD patients are currently available, although there are several reports where it is not diminished SMM, but diminished muscle strength, that is related to the weakness of physical function in patients with diabetes-related dementia, and that HGS is an important correlate of health in breast cancer survivors [29,30]. We hypothesized that HGS rather than SMM may affect H-QOL in CLD patients. To clarify these clinical research questions, we primarily sought to examine the influence of HGS and SMM on H-QOL, as evaluated by the SF-36 questionnaire, as compared with other clinical data (liver functional data, nutritional data, etc.) in patients with CLDs.

2. Patients and Methods

2.1. Patients

A total of 410 CLD patients with data for HGS and SMM, using BIA and the SF-36 scores available were admitted to our hospital between November 2013 and August 2018. Each attending physician asked study subjects to receive body composition analysis, and to complete SF-36 questionnaires. Of these, 15 patients with hepatic encephalopathy, advanced malignancies, severe inflammatory diseases, or severe psychiatric diseases that potentially affect H-QOL were excluded. Six subjects with severe ascites were also excluded from the study subjects, because BIA can be challenging in patients with severe fluid retention, that is, overestimates could occur in the calculation of skeletal muscle mass index (SMI) by using BIA in such patients [19]. Three hundred and eighty-nine patients were therefore analyzed. LC was determined using histological and/or imaging studies. FIB-4 index as determined by age, aspartate aminotransferase, alanine aminotransferase, and platelet count, and the controlling nutritional (CONUT) score as determined by serum albumin value, total cholesterol value, and lymphocyte count, were calculated as described elsewhere [31,32].

2.2. Questionnaire

Study subjects were asked to complete the Japanese version of the SF-36 (self-reported questionnaire). It consists of 36 items and is classified into multi-item (eight items) scales: physical functioning (PF), role physical (RP), bodily pain (BP), general health perception (GH), vitality (VT), social functioning (SF), role emotion (RE), and mental health (MH) [33]. The physical component summary score (PCS) and the mental component summary score (MCS) were additionally included in this questionnaire, and its validity was well confirmed [33]. Thus, a total of 10 items were evaluated.

2.3. Measurement of HGS and SMI

The measurement of HGS was based on the current guidelines [18]. Two measurements of HGS were performed on both the left and right sides. The better measurement on each side was used, and HGS was calculated as the mean of these values. SMI was defined as “appendicular SMM/(height (m))2” using BIA. Based on the current guidelines, patients with decreased HGS (d-HGS) were defined as those with HGS < 26 kg for men and <18 kg for women. Similarly, patients with decreased SMM (d-SMM) were defined as those with SMI < 7.0 kg/m2 for men and <5.7 kg/m2 for women [18]. As described earlier, the JSH criteria for sarcopenia in liver disease determines sarcopenia based on muscle strength and muscle mass regardless of age, because younger patients with advanced LC status may be involved in sarcopenia [18].
First, the impacts of HGS and SMM on the SF-36 scores across 10 items were examined for all cases and several subgroups according to the LC status, gender, and age. Subsequently, the relationships between the SF-36 scores across 10 items and baseline data were investigated. Factors associated with the SF-36 scores were also studied by using multivariate analysis. We received the ethical approval from the ethics committee of our hospital (approval no, 2296). The protocol in the study strictly observed all regulations of the Declaration of Helsinki.

2.4. Statistical Considerations

As for continuous parameters, Student’s t test, Mann–Whitney U test or the Pearson correlation coefficient r were employed to assess between-group differences, as applicable. In categorical parameters, Fisher’s exact tests or the Pearson χ2 test was employed to assess between-group differences, as applicable. Factors with p < 0.1 for the correlation with the SF-36 scores across 10 items were subjected to multivariate regression analysis with multiple predictive variables by using the least squares method, to identify candidate parameters. Unless otherwise mentioned, data are indicated as number or average ± standard deviation (SD). All items of SF-36 were analyzed separately, and we considered variables of p < 0.05 as being statistically significant variables. The JMP 13.2 (SAS Institute Inc., Cary, NC, USA) was employed to carry out the statistical analysis.

3. Results

3.1. Patient Baseline Data

Baseline data in this study (n = 389, 198 men and 191 women, average age = 62.0 years) are indicated in Table 1. LC was found in 148 patients (38.0%). The average ± SD HGS and SMI in male patients were 33.6 ± 8.7 kg and 7.5 ± 1.1 kg/m2, respectively, and those in female patients were 20.9 ± 5.2 kg and 6.0 ± 0.7 kg/m2, respectively. Sarcopenia, as defined by the JSH criteria, was observed in 27 male patients (13.6%) and 34 female patients (17.8%) [18]. In LC patients, sarcopenia was identified in 39 patients (26.4%), while in non-LC patients, it was identified in 22 patients (9.1%).
Between-group differences (the d-HGS group (n = 93) vs. the non-decreased HGS (nd-HGS) group (n = 296)) were noted with statistical significance in age, gender, presence of LC, serum albumin, platelet count, lymphocyte count, total cholesterol, CONUT score, FIB-4 index, and SMI (both male and female). While in the d-SMM group (n = 159) vs. the non-decreased SMI (nd-SMM) group (n = 230), between-group differences in age, gender, body mass index (BMI), FIB-4 index, serum creatinine, and HGS (both male and female) reached significance. The corresponding average ± SD values and p values are listed in Table 1.
Between-group differences (LC patients (n = 148) vs. non-LC patients (n = 151)) were noted with statistical significance in the items of PF, RP, GH, VT, SF, RE, and PCS, suggesting that LC patients had poorer H-QOL compared with non-LC patients. Corresponding average ± SD values, 95% confidence intervals (CIs) and P values were summarized in Table 2.

3.2. Impact of HGS and SMM on the SF-36 Scores for all Cases

The average ± SD SF-36 scores (95% CIs) in the d-HGS and nd-HGS groups (n = 93 and 296), and the d-SMM and nd-SMM groups (n = 159 and 230) for all cases are presented in Table 3. Between-group differences (the d-HGS group vs. the nd-HGS group) in the items of PF (p < 0.0001), RP (p < 0.0001), BP (p = 0.0043), VT (p = 0.0011), SF (p < 0.0001), RE (p < 0.0001), and PCS (p < 0.0001) reached significance, while SF-36 scores in the d-SMI group were significantly higher than those in the nd-SMI group in the items of PF (p = 0.0032), SF (p = 0.0031) and RE (p = 0.0030). (Figure 1a,b).

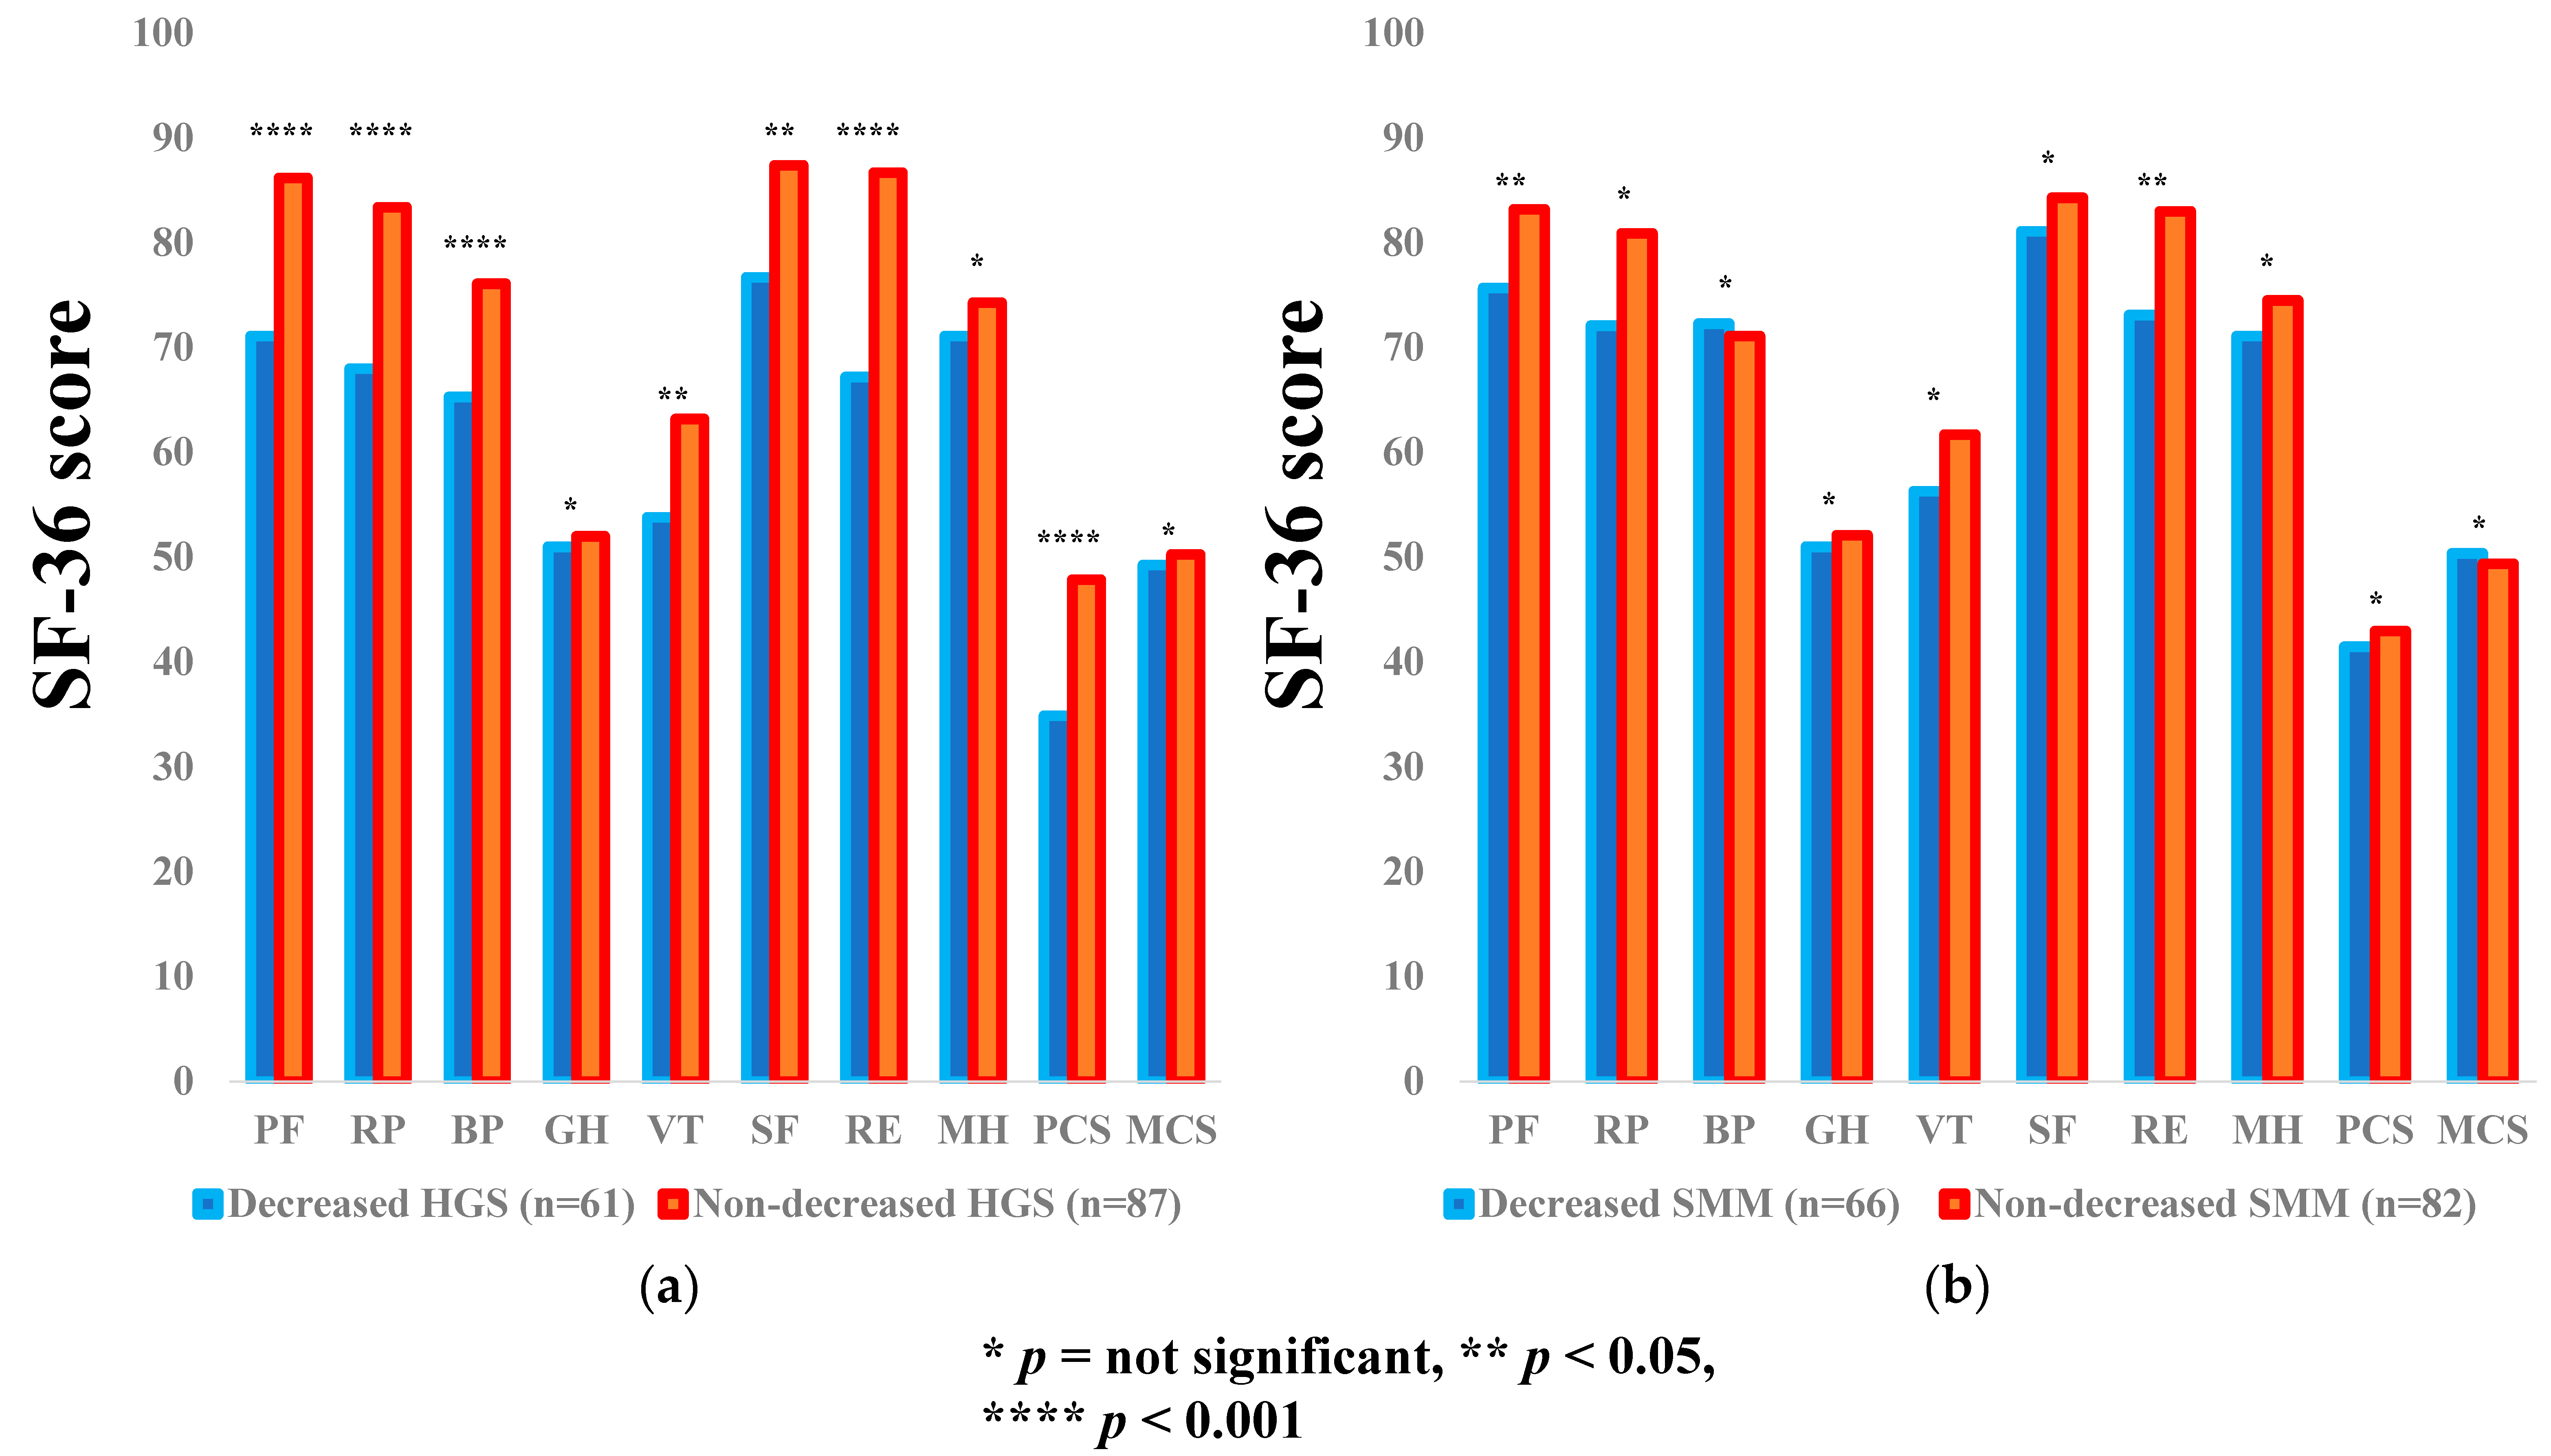
3.3. Subgroup Analysis 1: Impact of HGS and SMM on the SF-36 Scores for LC Patients

The average ± SD SF-36 scores [95% CIs] in the d-HGS and nd-HGS groups (n = 61 and 87), and the d-SMM and nd-SMM groups (n = 66 and 82) for LC patients are shown in Table 3. Between-group differences (the d-HGS group vs. the nd-HGS group) in the items of PF (p = 0.0002), RP (p = 0.0006), BP (p = 0.0002), VT (p = 0.0132), SF (p = 0.0112), RE (p < 0.0001), and PCS (p < 0.0001) reached significance, while in the d-SMM group vs. the nd-SMI group, the differences were noted with significance in the items of PF (p = 0.0252) and RE (p = 0.0131) (Figure 2a,b).

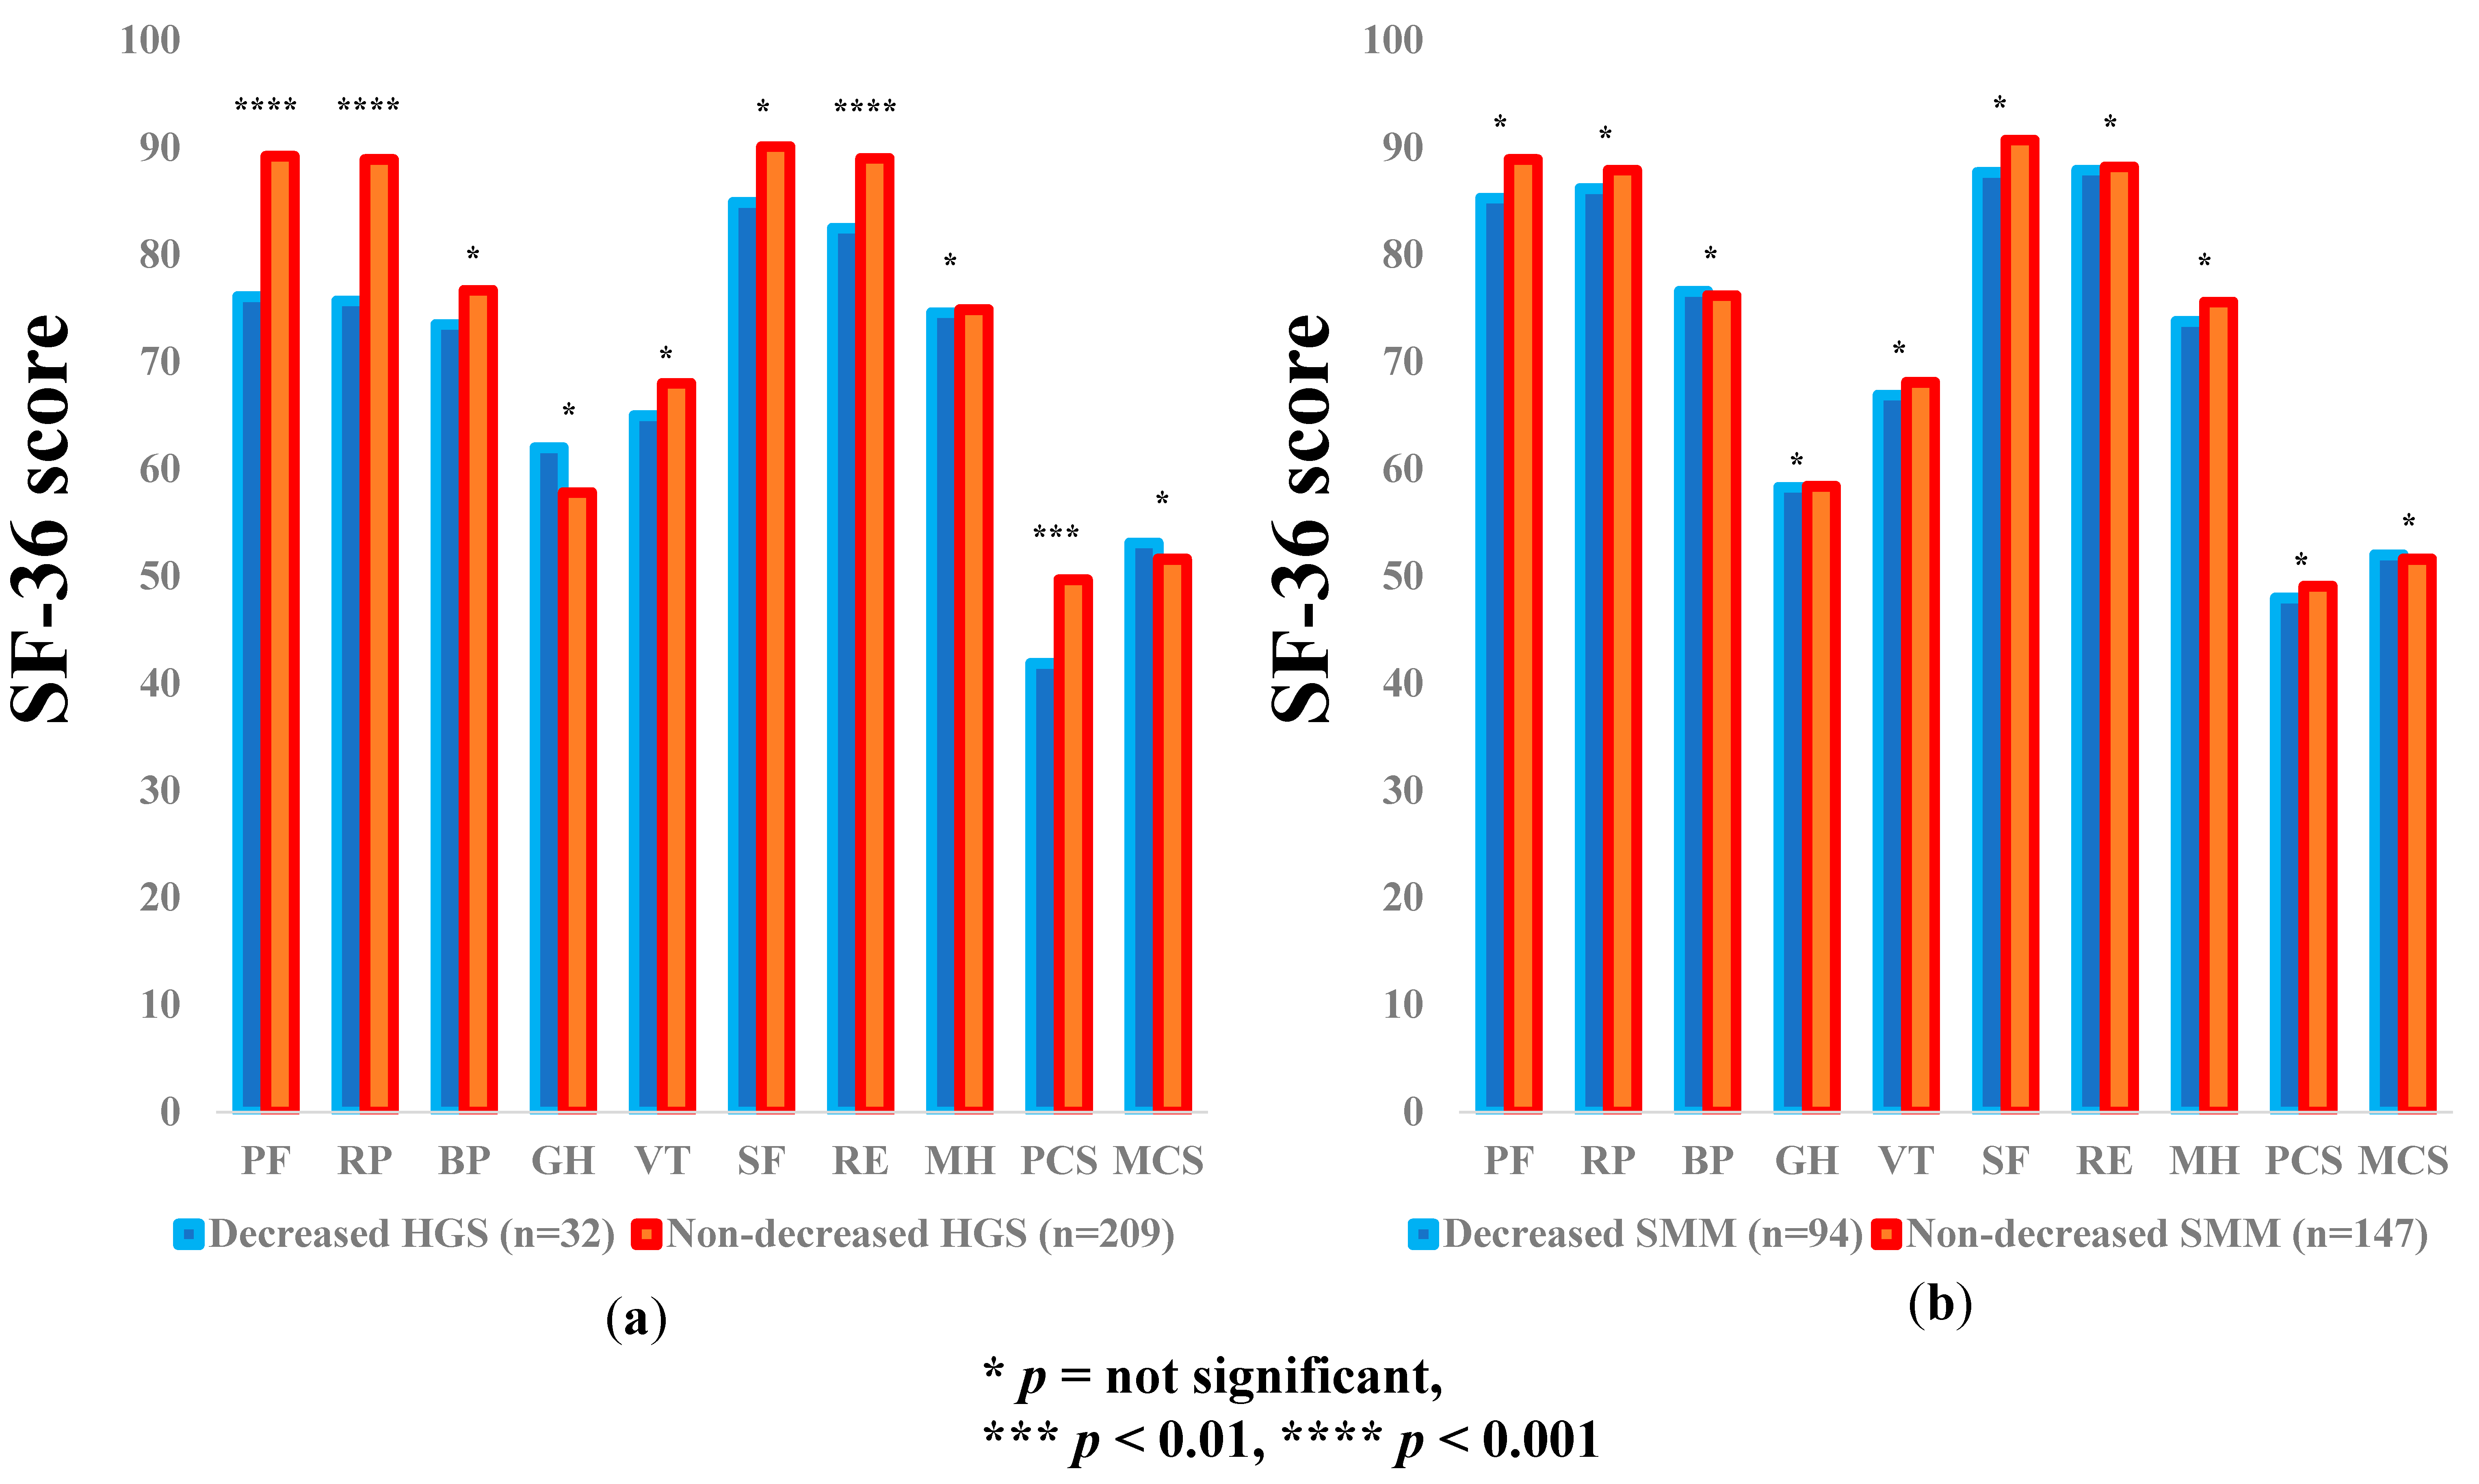
3.4. Subgroup Analysis 2: Impact of HGS and SMM on the SF-36 Scores for Non-LC Patients

The average ± SD SF-36 scores (95% CIs) in the d-HGS and nd-HGS groups (n = 32 and 209) and the d-SMM and nd-SMM groups (n = 94 and 147) for non-LC patients are demonstrated in Table 3. Between-group differences (the d-HGS group vs. the nd-HGS group) in the items of PF (p = 0.0002), RP (p = 0.0006), RE (p = 0.0002), and PCS (p = 0.0018) reached significance, while in the d-SMM group vs. the nd-SMM group, no significant difference was noted in all items (Figure 3a,b).

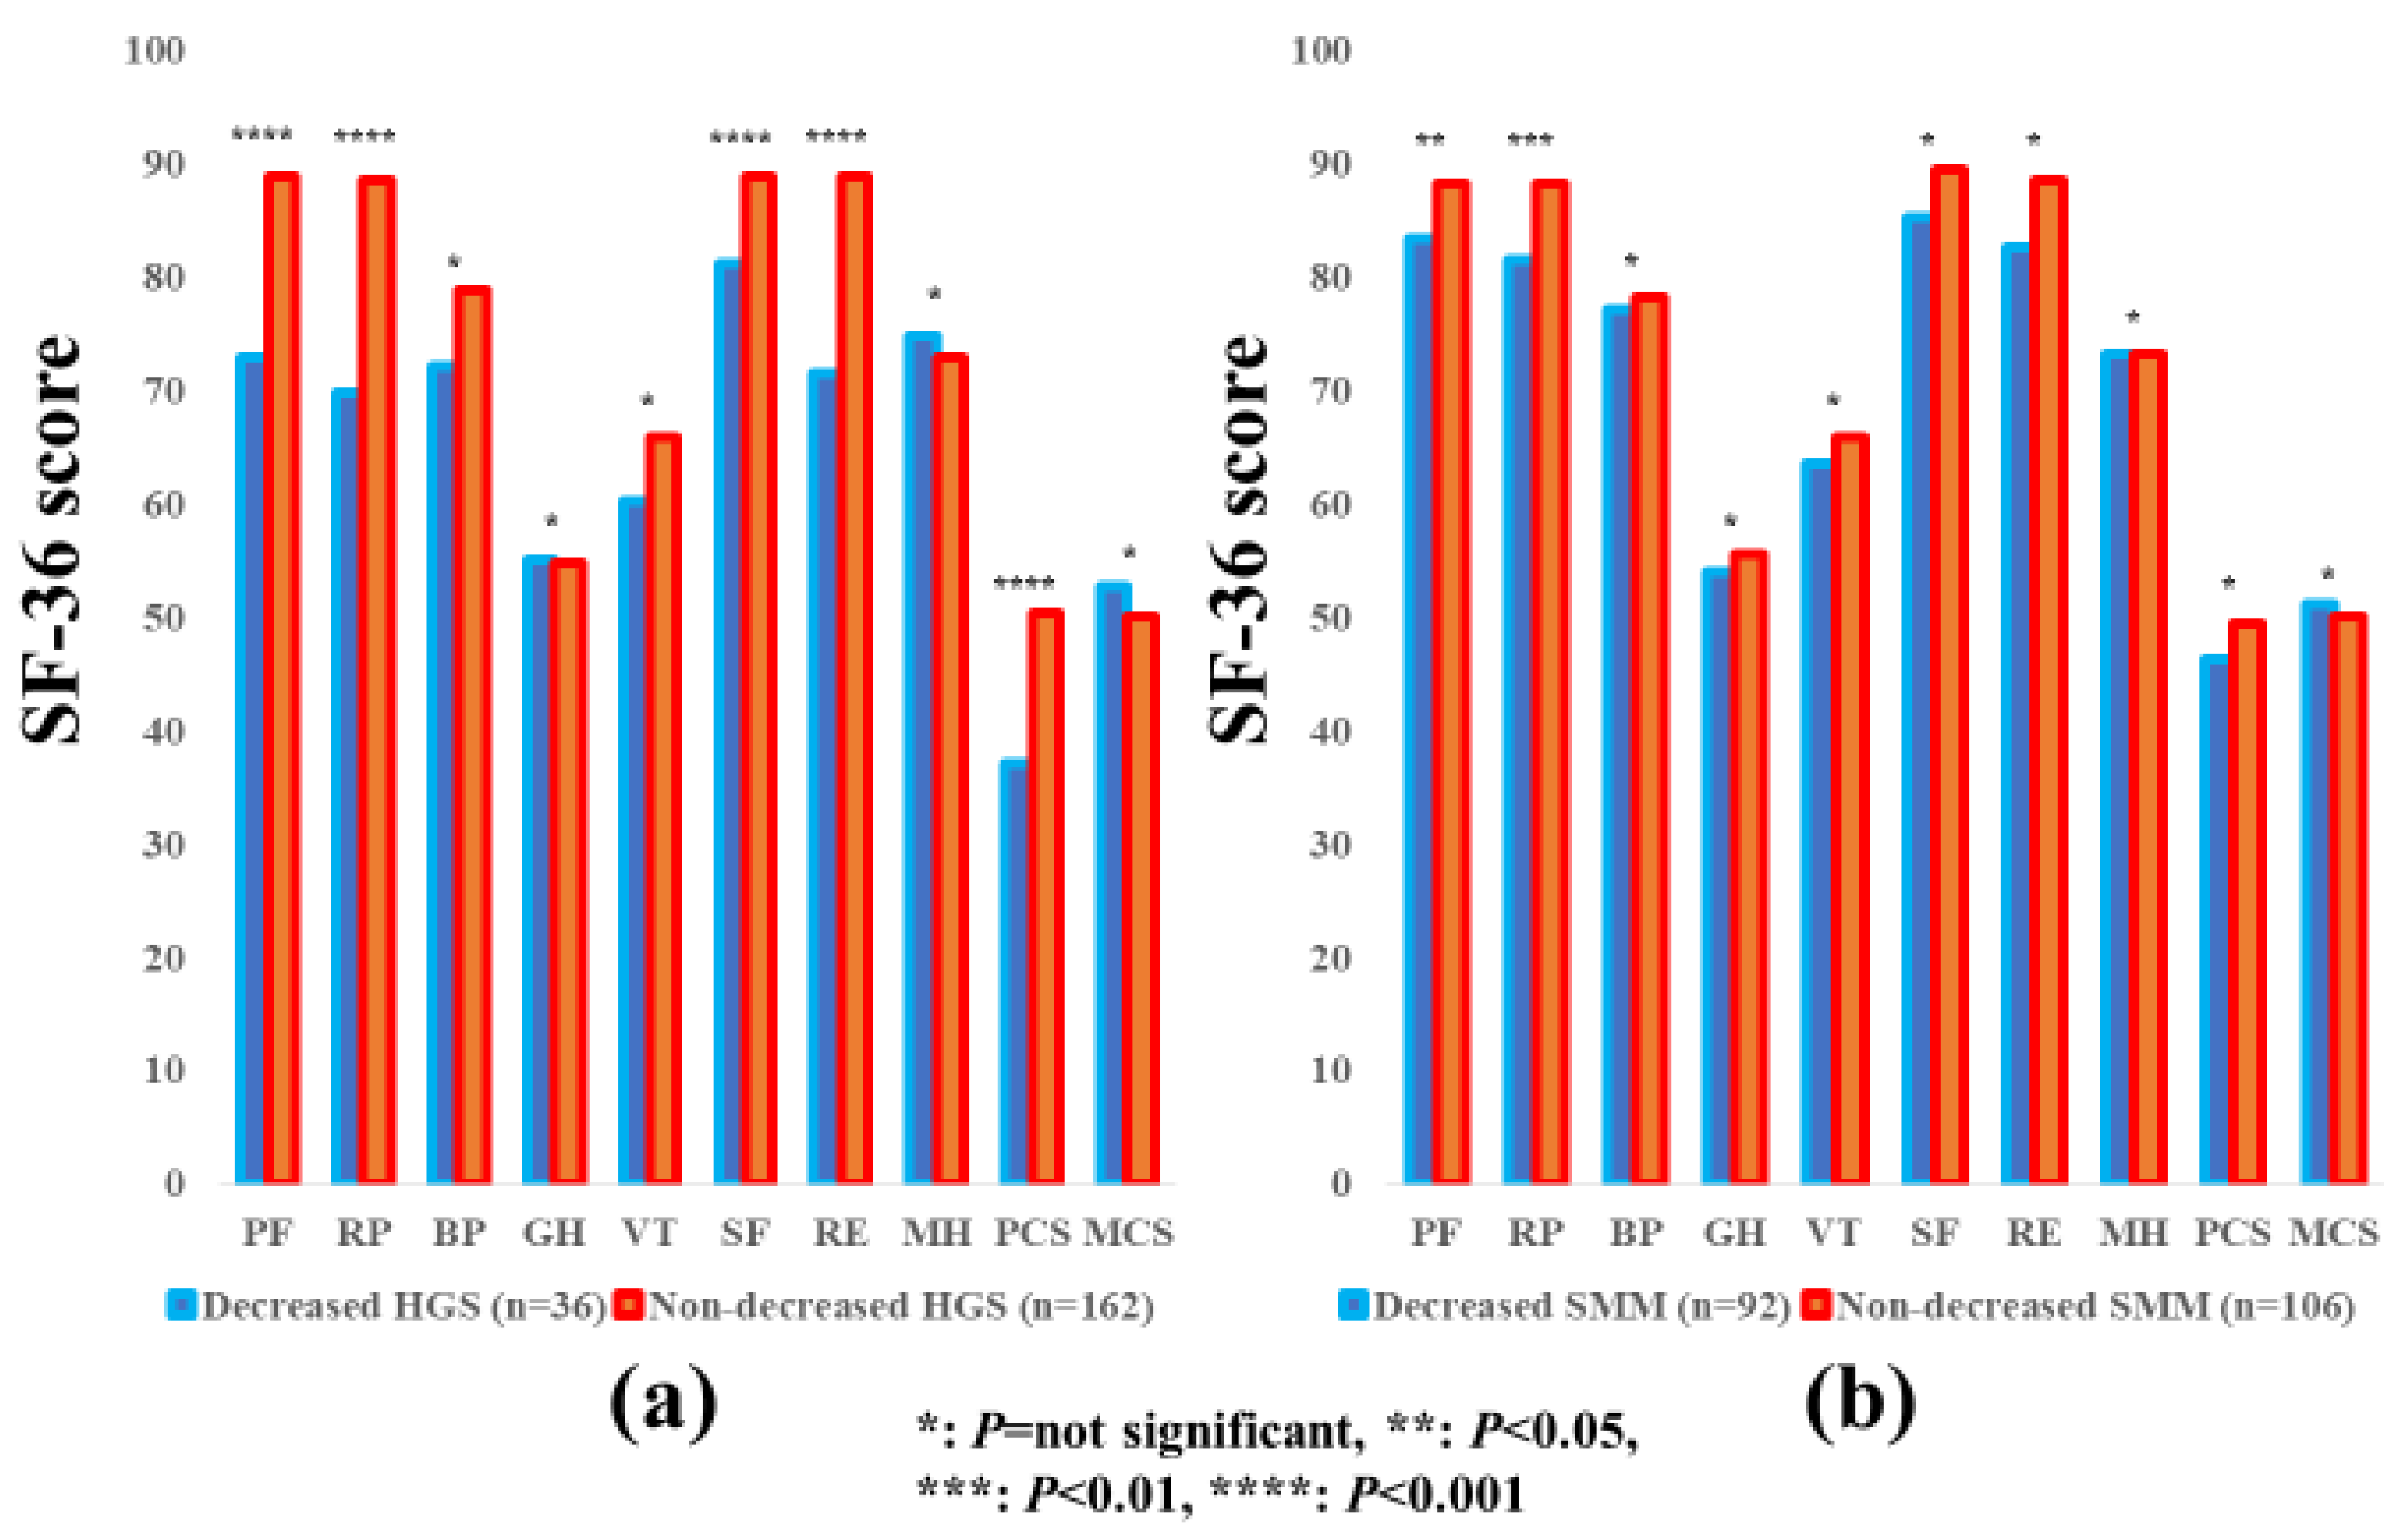
3.5. Subgroup Analysis 3: Impact of HGS and SMM on the SF-36 Scores for Male Patients

The average ± SD SF-36 scores (95% CIs) in the d-HGS and nd-HGS groups (n = 36 and 162) and the d-SMM and nd-SMM groups (n = 92 and 106) for male patients are indicated in Table 3. Between-group differences (the d-HGS group vs. the nd-HGS group) in the items of PF (p < 0.0001), RP (p < 0.0001), SF (p < 0.0001), RE (p < 0.0001) and PCS (p < 0.0001) reached significance, while the SF-36 scores in the d-SMM group were significantly higher than those in the nd-SMM group in the items of PF (p = 0.0451) and RP (p = 0.0035) (Figure 4a,b).

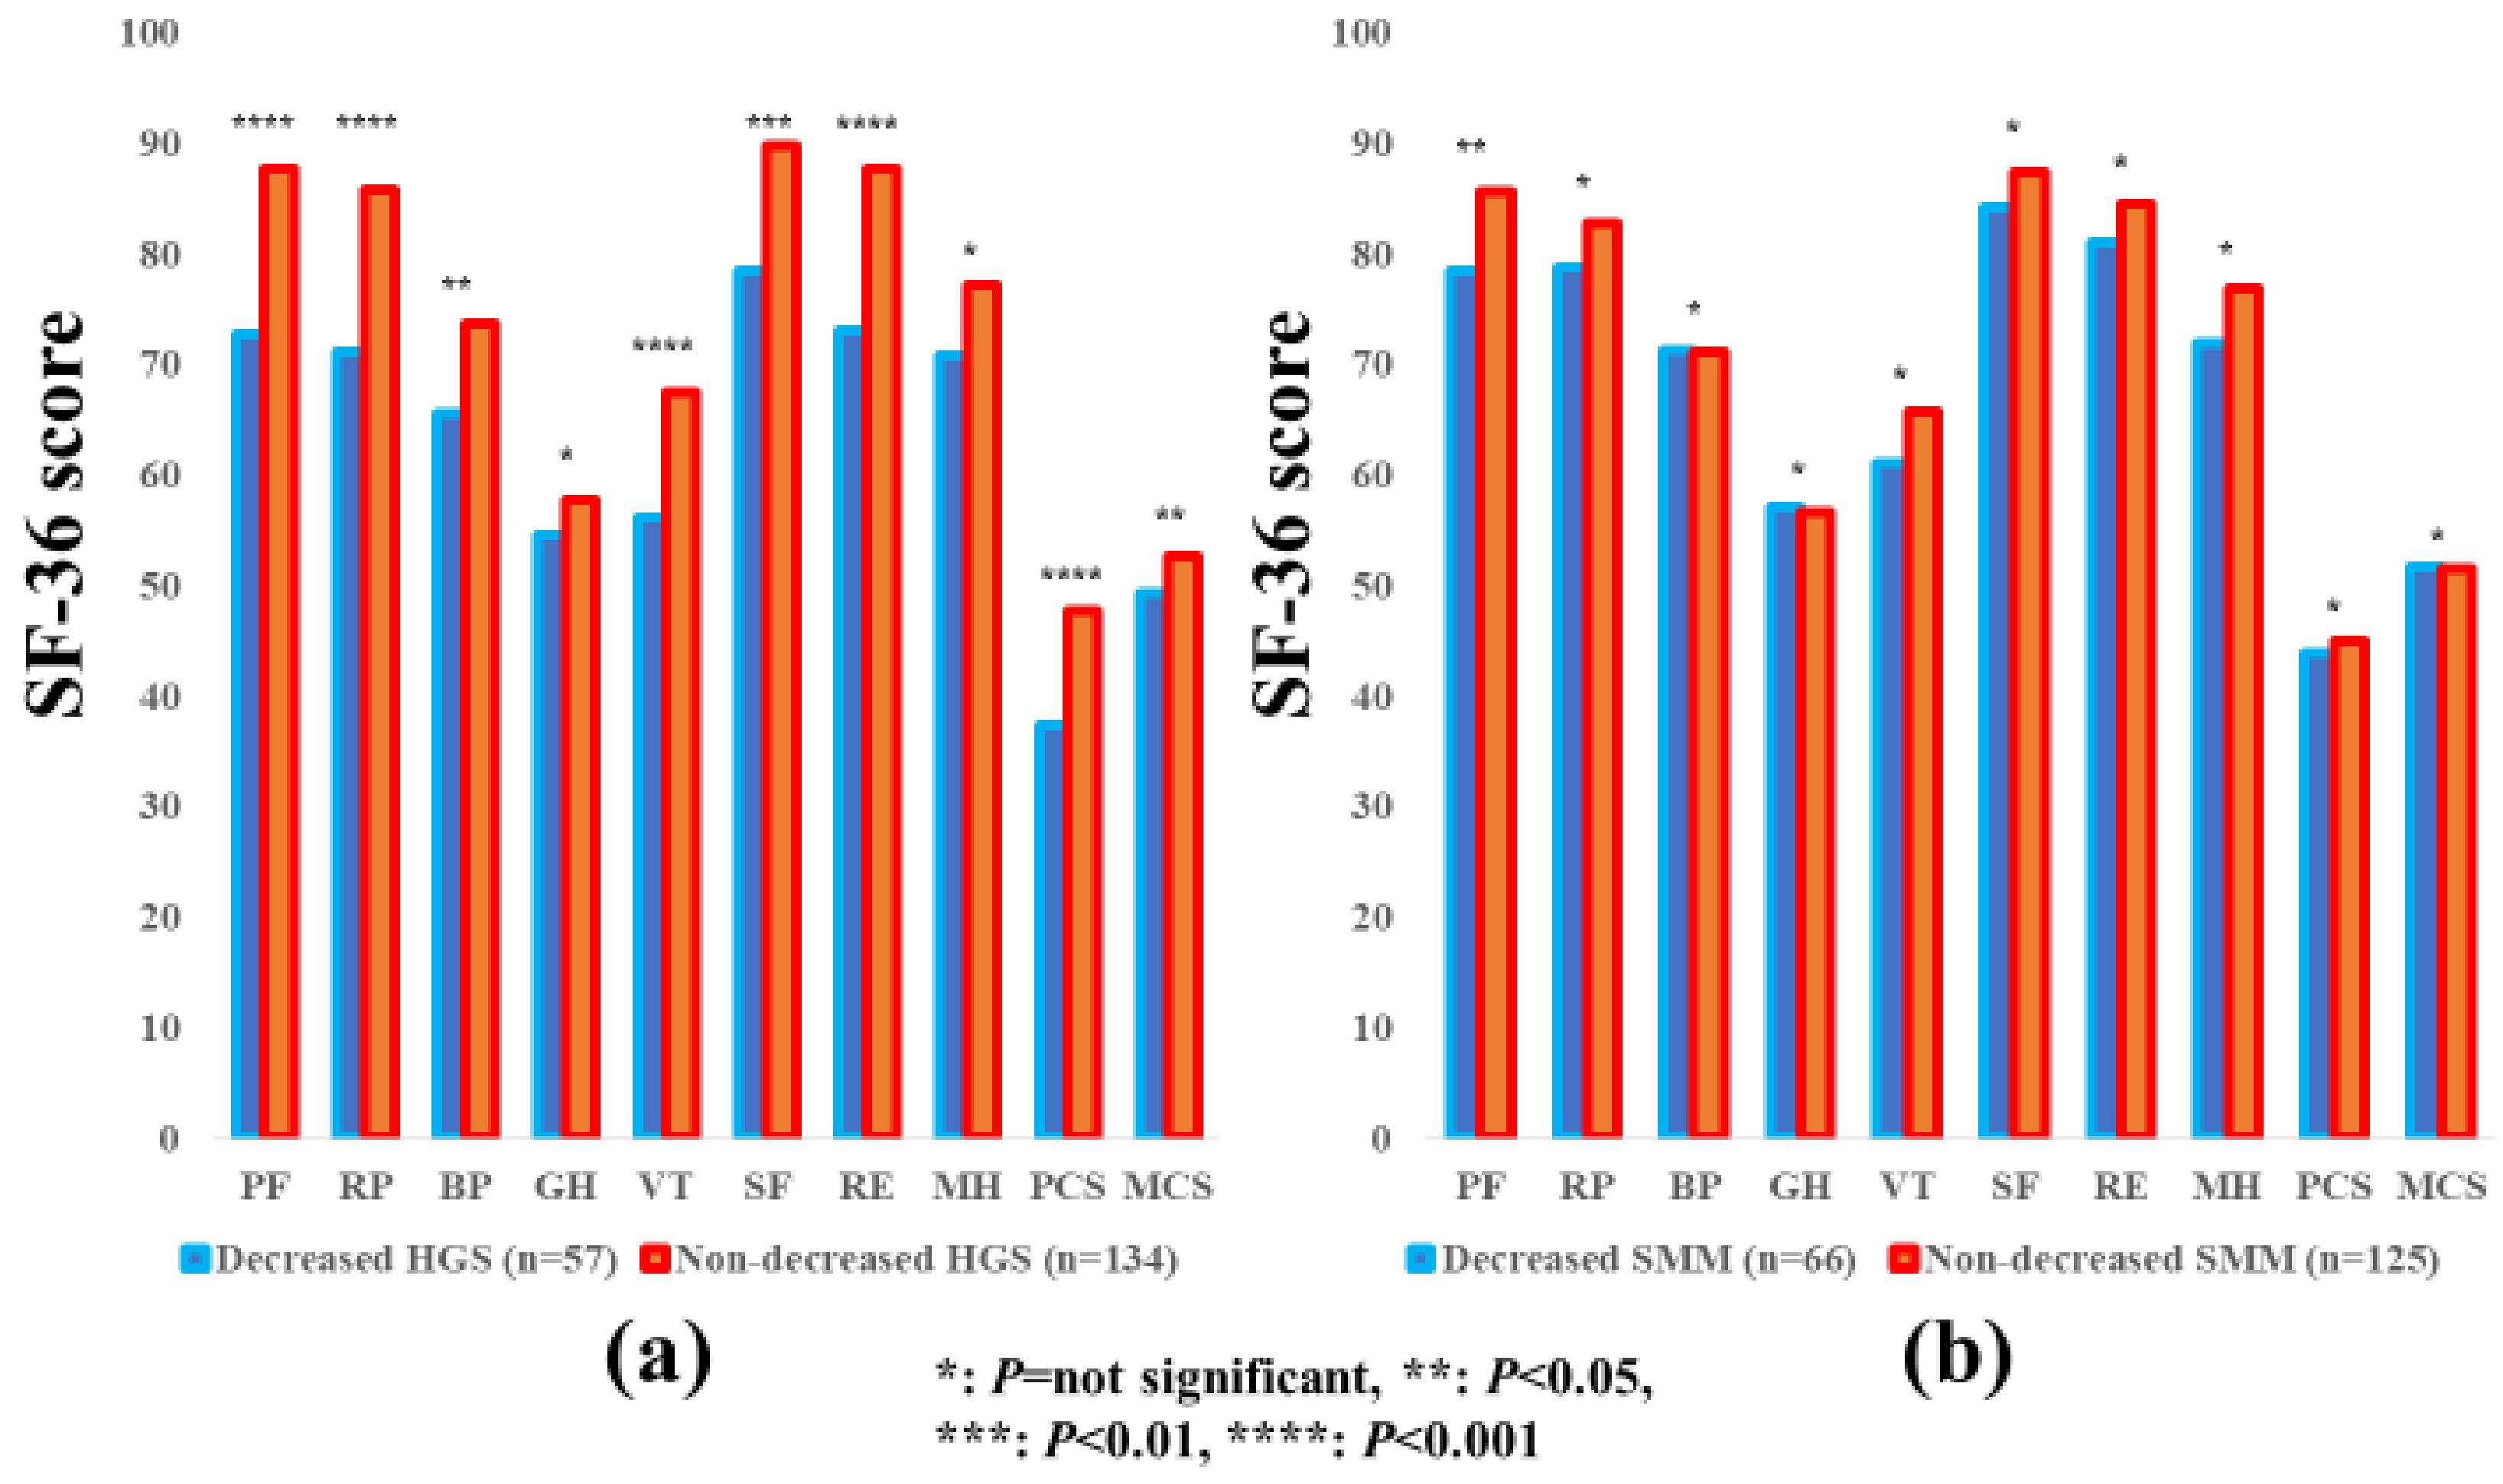
3.6. Subgroup Analysis 4: Impact of HGS and SMM on the SF-36 Scores for Female Patients

The average ± SD SF-36 scores [95% CIs] in the d-HGS and nd-HGS groups (n = 57 and 134) and the d-SMM and nd-SMM groups (n = 66 and 125) for female patients are indicated in Table 3. Between-group differences (the d-HGS group vs. the nd-HGS group) in the items of PF (p < 0.0001), RP (p < 0.0001), BP (p = 0.0432), VT (p = 0.0006), SF (p = 0.0012), RE (p < 0.0001), PCS (p < 0.0001) and MCS (p = 0.0326) reached significance, while in the d-SMM group vs. the nd-SMI group, the difference was observed with significance only in the item of PF (p = 0.0124). (Figure 5a,b).

3.7. Subgroup Analysis 5: Impact of HGS and SMM on the SF-36 Scores for Patients Aged ≥65 Years

The average ± SD SF-36 scores (95% CIs) in the d-HGS and nd-HGS groups (n = 74 and 121) and the d-SMM and nd-SMM groups (n = 110 and 85) for patients aged ≥65 years are indicated in Table 3. Between-group differences (the d-HGS group vs. the nd-HGS group) in the items of PF (p = 0.0001), RP (p < 0.0001), BP (p = 0.0111), VT (p = 0.0021), SF (p < 0.0001), RE (p < 0.0001), and PCS (p < 0.0001) reached significance, while in the d-SMM group vs. the nd-SMM group, no significant differences were observed in all items (Figure 6a,b).

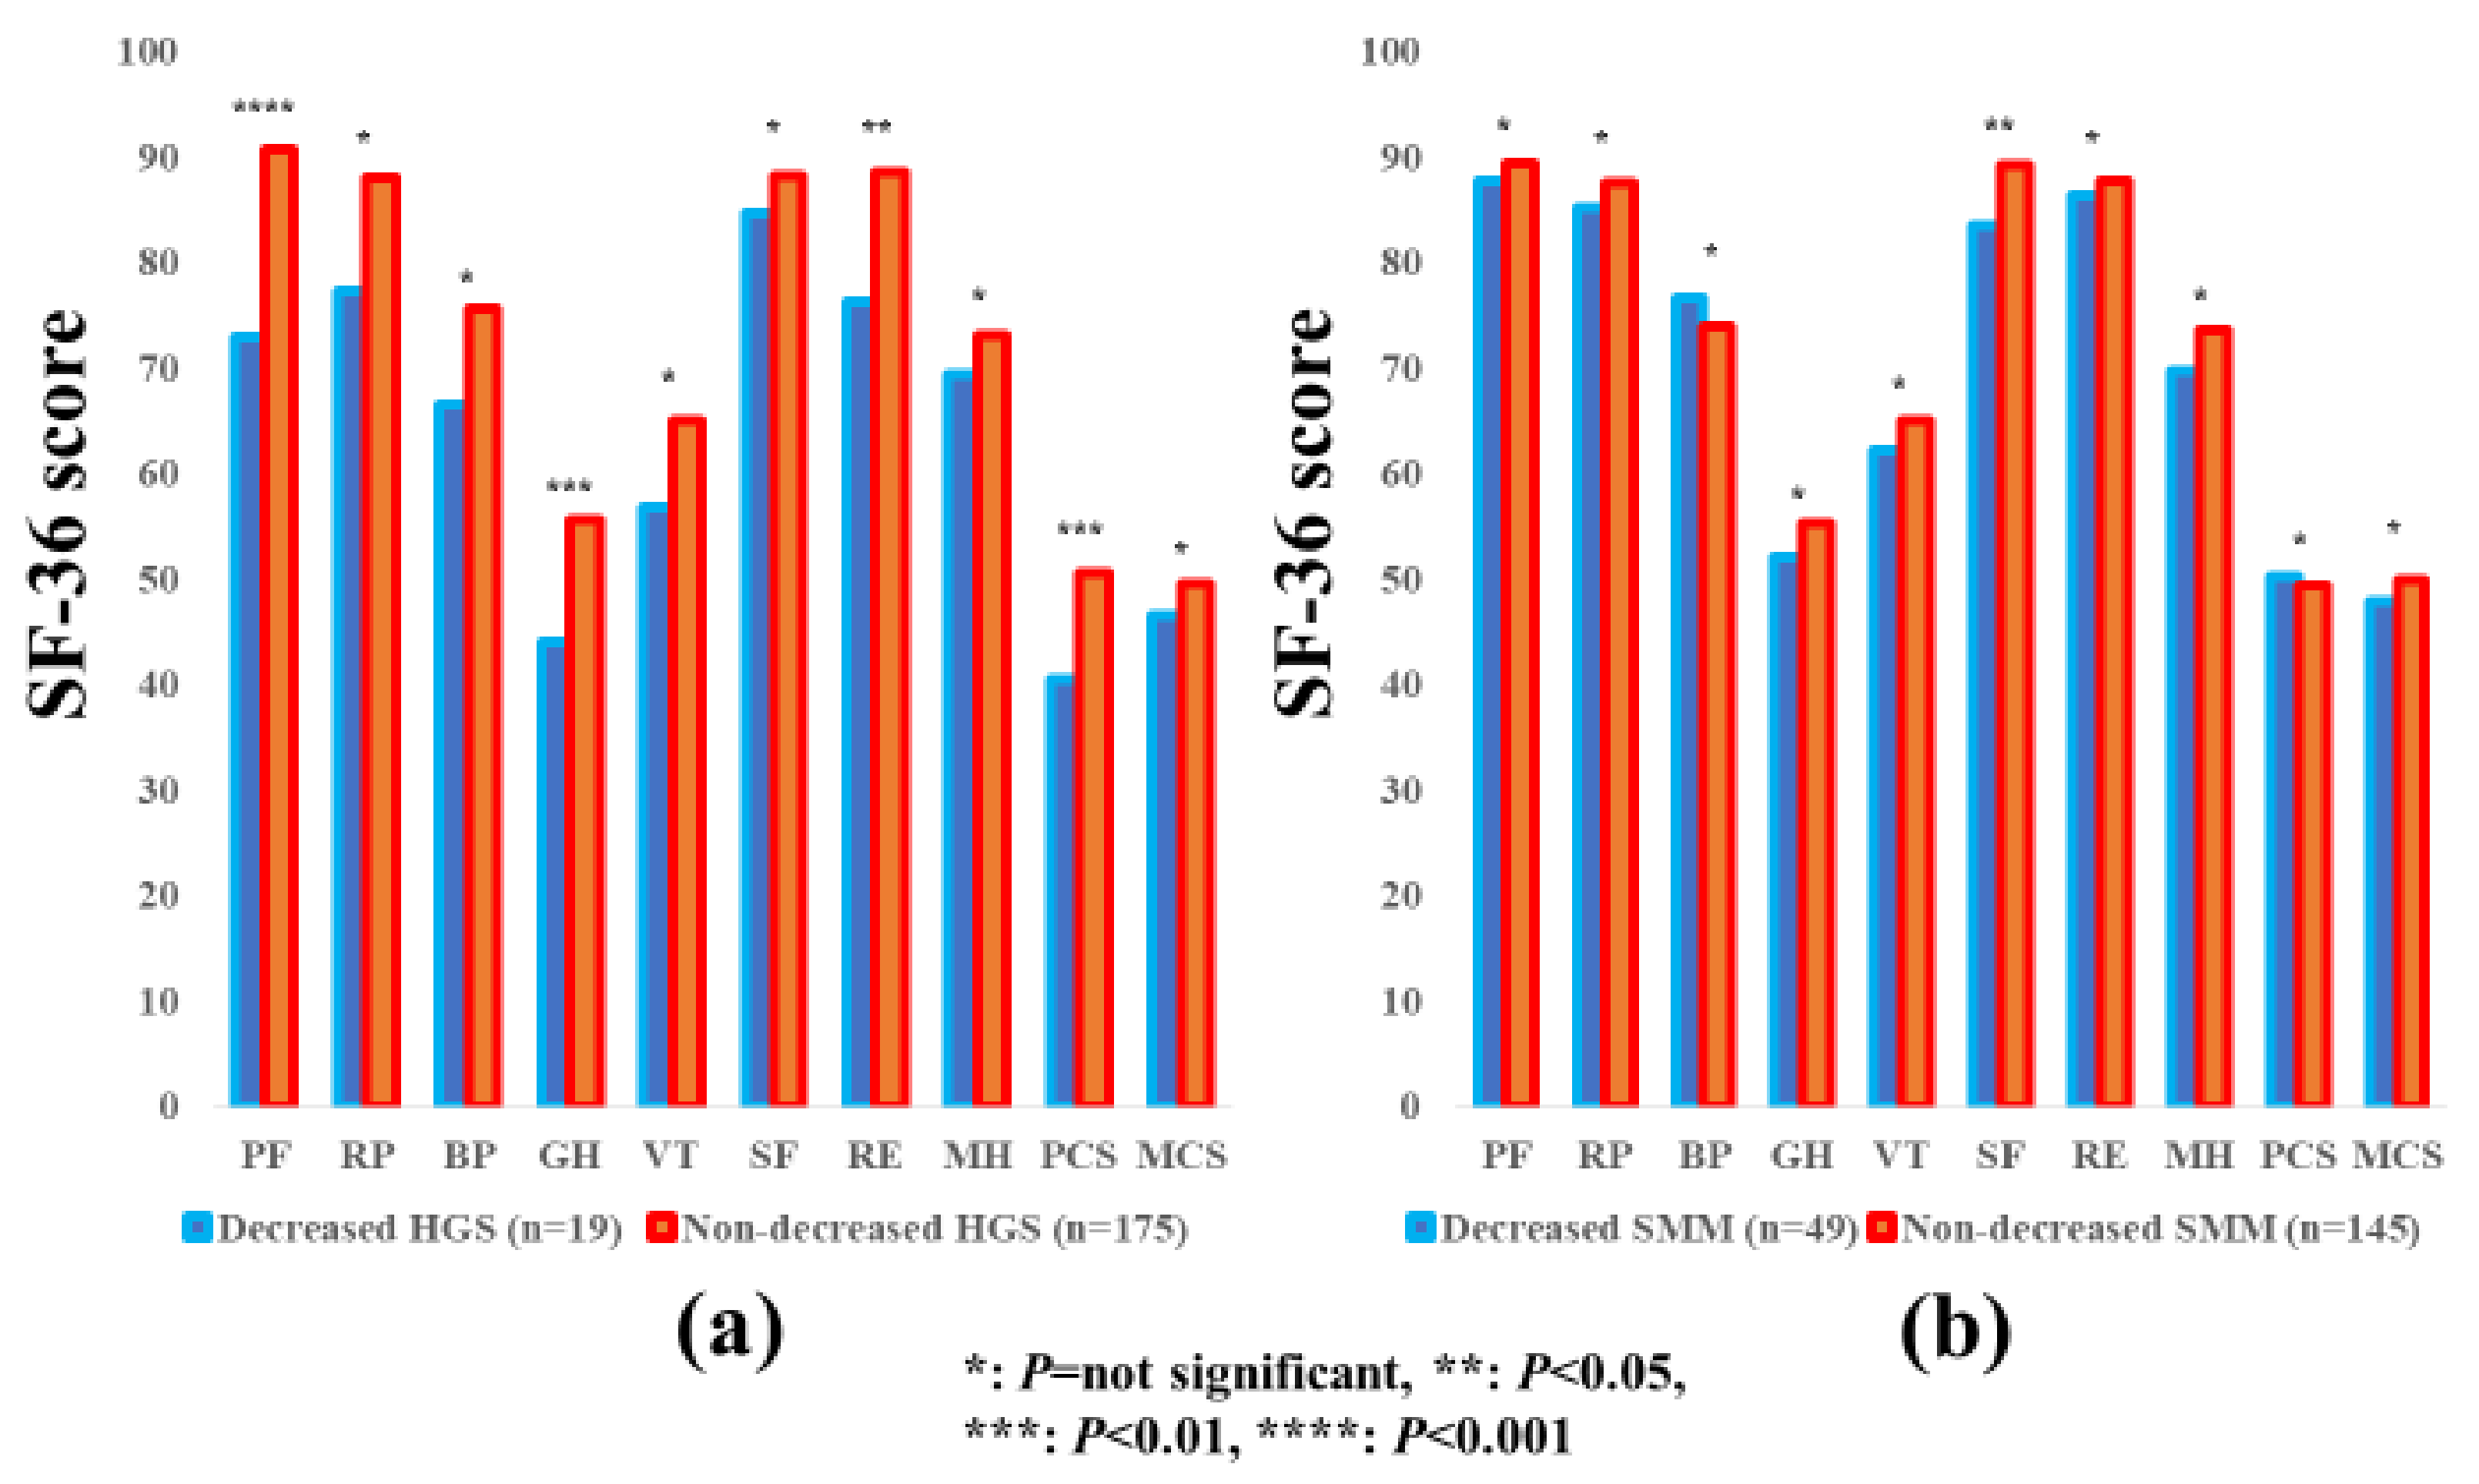
3.8. Subgroup Analysis 6: Impact of HGS and SMM on the SF-36 Scores for Patients Aged <65 Years

The average ± SD SF-36 scores (95% CIs) in the d-HGS and nd-HGS groups (n = 19 and 175) and the d-SMM and nd-SMM groups (n = 49 and 145) in patients aged <65 years are indicated in Table 3. Between-group differences (the d-HGS group vs. the nd-HGS group) in the items of PF (p < 0.0001), GH (p = 0.0088), RE (p = 0.0281), and PCS (p = 0.0081) reached significance, while in the d-SMM group vs. the nd-SMM group, between-group difference was significant only in the item of SF (p = 0.0286) (Figure 7a,b).

3.9. Relationship between the SF-36 Scores and Baseline Parameters in Male Patients and Female Patients

Correlation coefficients and p values between the SF-36 scores across 10 items, and baseline parameters in male patients and female patients are summarized in Table 4.
In male patients, HGS significantly correlated with PF (r = 0.32, p < 0.0001), RP (r = 0.25, p = 0.0007), RE (r = 0.16, p = 0.0324), and PCS (r = 0.29, p < 0.0001), while SMI did not significantly correlate with any item. Serum albumin level significantly correlated with all items other than MH and HCS.
In female patients, HGS significantly correlated with PF (r = 0.35, p < 0.0001), RP (r = 0.18, p = 0.0195), VT (r = 0.23, p = 0.0022), SF (r = 0.18, p = 0.0179), RE (r = 0.19, p = 0.0112), MH (r = 0.17, p = 0.0222), PCS (r = 0.28, p = 0.0003), and MCS (r = 0.15, p = 0.0446), whereas SMI significantly correlated with PF only (r = 0.20, p = 0.0053). Serum albumin levels significantly correlated with all items other than MH.

3.10. Multivariate Analyses of Factors Linked to the SF-36 Scores in Male Patients and Female Patients

In male patients, multivariate analyses of factors for the SF-36 scores revealed that HGS was significantly linked to PF (p = 0.0031), RP (p = 0.0185) and PCS (p = 0.0421), while serum albumin was a significant factor for PF (p = 0.0048), RP (p = 0.0004), VT (p = 0.0327), SF (p = 0.0085), RE (p = 0.0002) and PCS (p < 0.0001) (Table 5).
In female patients, multivariate analyses of factors for the SF-36 scores revealed that HGS was significantly linked to PF (p = 0.0034), VT (p = 0.0150), RE (p = 0.0422), and PCS (p = 0.0191), whereas serum albumin did not significantly correlate with any item (Table 5).

4. Discussion

The loss of SMM in CLDs is caused by the progressive withdrawal of anabolism, and an increase in catabolism [34]. The liver is an essential organ that is involved in protein, fat, and carbohydrate metabolism, and energy generation [35,36]. H-QOL in CLDs has been demonstrated to be significantly compromised, and the decrease in H-QOL in CLDs is frequently overlooked or unrecognized [37]. To our knowledge, this is the first study demonstrating the relevance between HGS and SMM and H-QOL in CLD patients. To elucidate these issues is clinically of importance, because sarcopenia in liver diseases has been gaining much attention these days, due to its high prognostic predictability, and its definition includes HGS and SMM [18,19,20,21,22,23,24,25,26,27,28]. We therefore conducted the current analysis.
In our results, mean values in the d-HGS and nd-HGS groups were largely different, with statistical significance in the items of PF and PCS for all cases and all subgroup analyses, while in comparison, between the d-SMM and nd-SMM groups, such tendencies were not observed. Additionally, our multivariate analyses revealed that HGS was an independent predictor associated with PF and PCS irrespective of gender; however, in terms of mentality-related domains such as MH or MCS, both HGS and SMI appeared not to have an impact on the SF-36 scores. These results demonstrated that not SMM, but HGS has a strong influence on the physiological domains in the SF-36, which may be linked to clinical outcomes in CLD patients [11]. Numerous previous studies have reported that SMM is an independent outcome predictor in CLD patients [18,19,21,23,25,26]. However, reviewing our current results, decreased SMM itself is not possibly a prognostic factor, but the presence of a large number of patients with diminished muscle strength in diminished SMM patients leads to poor prognosis. Our data showing that SMI was significantly correlated with HGS, both in males (r = 0.37, p < 0.0001) and females (r = 0.46, p < 0.0001), support this hypothesis. In this respect, the current results seem to shed some insights on the better understanding of muscle mass and muscle weakness in CLD patients.
Notably, as presented in Table 1, age affected both HGS and SMI, while the presence of LC, serum albumin, and the CONUT score affected only HGS, and BMI affected only SMM. As described above, SMM decreases by approximately 1% after the age of 50 years, owing to changes in muscle fiber type and size [17]. These morphological and functional changes of skeletal muscle due to aging appear to account for the impact of aging on HGS and SMM. On the other hand, our current results denoted that d-SMM does not occur by poor nutritional state alone, and d-HGS does not occur by lower BMI alone, although the mechanisms for these remains unclear. In our comparison of the SF-36 scores across 10 items in patients with and without LC, significant differences were noted in numerous items, which are in agreement with previous reports [19,21,38,39]. LC patients tend to have worse H-QOL and exercise training can be a pivotal recommendation for LC patients [38]. While there have been few reports regarding H-QOL in non-LC patients. In that sense, our data are worthy of report.
In our multivariate analyses, serum albumin was an independent factor in several items of the SF-36 in male patients, while in female patients, serum albumin was not significant in any item of the SF-36. The average ± SD serum albumin levels in male and female in this study were 4.1 ± 0.53 g/dL and 4.2 ± 0.47 g/dL (p = 0.4726). Gender differences of hormones, including estrogen and progesterone or physiological and psychological attributes of men and women, may be attributed to our current results, however, it is likely that the ability of protein synthesis is associated with H-QOL in male CLD patients [40,41]. In our previous investigation, we have reported that serum levels of myostatin, which is a negative regulator of muscle protein synthesis, significantly differed in male and female LC patients [23].
The proportions of sarcopenia in LC and non-LC patients were 26.4% and 9.1%, respectively, in this study. Sarcopenia includes primary and secondary sarcopenia [18]. LC patients may have secondary sarcopenia due to impaired protein synthesis, and non-LC patients may have aging-related primary sarcopenia [18]. Clinicians should fully consider the etiology for sarcopenia in each patient.
Several limitations related to the study warrant mention. Firstly, the study was a single-center observational study with a retrospective nature. Secondly, the study data was derived from a Japanese liver disease population data, and additional investigations on other races are required to further verify and extend the application to other races. Thirdly, HGS can vary depending on patients’ daily life activities. Fourthly, patients with massive ascites or hepatic encephalopathy, who are potentially involved in sarcopenia were excluded, due to the lack of reliability in the BIA or the self-reported questionnaire, creating bias. Finally, the interpretation of our results should be done cautiously, since the direction of the association between the SF-36 scores and HGS or SMM remains unclear, due to the cross-sectional nature of our data. Nevertheless, our study results denoted that patients with d-HGS scored lower in the SF-36 vs. those with nd-HGS, especially in the physical health domains. In conclusion, HGS appears to have a strong impact on H-QOL in patients with CLDs, and exercise may be beneficial for improving H-QOL. In CLD patients with d-HGS, clinicians should be aware of the presence of CLD patients with decreased H-QOL.

5. Conclusions

HGS appears to have a strong impact on H-QOL in patients with CLDs.

Author Contributions

Data curation, K.Y., Y.I., Y.S., K.K., N.I. (Naoto Ikeda), T.T., N.A., R.T., K.H., N.I. (Noriko Ishii), Y.Y., T.N. and H.I.; Supervision, S.N.; Writing—Original draft, H.N.; Writing—Review & editing, H.E.

Funding

This research received no external funding.

Acknowledgments

The authors gratefully thank all medical staff in our nutritional guidance room for their help with data collection. No funding was provided for this study, and none of the authors has any conflicts of interest to declare.

Conflicts of Interest

The authors declare no conflict of interest.

Abbreviation

H-QOLhealth-related quality of life
CLDchronic liver disease
SF-3636-Item Short Form Health Survey
SMMskeletal muscle mass
JSHJapanese Society of Hepatology
HGShand grip strength
d-HGSdecreased HGS
nd-HGSnon-decreased HGS
BIAbioimpedance analysis
BMIbody mass index
SMIskeletal muscle mass index
d-SMMdecreased SMM
nd-SMMnon-decreased SMM
LCliver cirrhosis
CONUT scorecontrolling nutritional score
PFphysical functioning
RProle physical
BPbodily pain
GHgeneral health perception
VTvitality
SFsocial functioning
RErole emotion
MHmental health
PCSphysical component summary score
MCSmental component summary score
SDstandard deviation
CIconfidence interval

References

  1. Lloyd, A.; Sawyer, W.; Hopkinson, P. Impact of long-term complications on quality of life in patients with type 2 diabetes not using insulin. Value Health 2001, 4, 392–400. [Google Scholar] [CrossRef] [PubMed]
  2. Zambroski, C.H.; Moser, D.K.; Bhat, G.; Ziegler, C. Impact of symptom prevalence and symptom burden on quality of life in patients with heart failure. Eur. J. Cardiovasc. Nurs. 2005, 4, 198–206. [Google Scholar] [CrossRef]
  3. Rebollo, P.; Ortega, F.; Baltar, J.M.; Díaz-Corte, C.; Navascués, R.A.; Naves, M.; Ureña, A.; Badía, X.; Alvarez-Ude, F.; Alvarez-Grande, J. Health-related quality of life (HRQOL) in end stage renal disease (ESRD) patients over 65 years. Geriatr. Nephrol. Urol. 1998, 8, 85–94. [Google Scholar] [CrossRef] [PubMed]
  4. Bottomley, A.; Pe, M.; Sloan, J.; Basch, E.; Bonnetain, F.; Calvert, M.; Campbell, A.; Cleeland, C.; Cocks, K.; Collette, L.; et al. Setting International Standards in Analyzing Patient-Reported Outcomes and Quality of Life Endpoints Data (SISAQOL) consortium. Setting International Standards in Analyzing Patient-Reported Outcomes and Quality of Life Endpoints Data (SISAQOL) consortium. Analysing data from patient-reported outcome and quality of life endpoints for cancer clinical trials: A start in setting international standards. Lancet Oncol. 2016, 17, e510–e514. [Google Scholar] [PubMed]
  5. Spiegel, B.M.; Younossi, Z.M.; Hays, R.D.; Revicki, D.; Robbins, S.; Kanwal, F. Impact of hepatitis C on health-related quality of life: A systematic review and quantitative assessment. Hepatology 2005, 41, 790–800. [Google Scholar] [CrossRef]
  6. Younossi, Z.M.; Stepanova, M.; Younossi, I.; Pan, C.Q.; Janssen, H.L.A.; Papatheodoridis, G.; Nader, F. Long-term Effects of Treatment for Chronic HBV Infection on Patient-Reported Outcomes. Clin. Gastroenterol. Hepatol. 2018, in press. [Google Scholar] [CrossRef] [PubMed]
  7. Schramm, C.; Wahl, I.; Weiler-Normann, C.; Voigt, K.; Wiegard, C.; Glaubke, C.; Brähler, E.; Löwe, B.; Lohse, A.W.; Rose, M. Health-related quality of life, depression, and anxiety in patients with autoimmune hepatitis. J. Hepatol. 2014, 60, 618–624. [Google Scholar] [CrossRef]
  8. Dyson, J.K.; Wilkinson, N.; Jopson, L.; Mells, G.; Bathgate, A.; Heneghan, M.A.; Neuberger, J.; Hirschfield, G.M.; Ducker, S.J.; UK-PBC Consortium; et al. The inter-relationship of symptom severity and quality of life in 2055 patients with primary biliary cholangitis. Aliment. Pharmacol. Ther. 2016, 44, 1039–1050. [Google Scholar] [CrossRef] [Green Version]
  9. Younossi, Z.M. Patient-reported Outcomes and the Economic Effects of Non-Alcoholic Fatty Liver Disease and Non-alcoholic Steatohepatitis—The Value Proposition. Hepatology 2018, in press. [Google Scholar] [CrossRef]
  10. Gao, F.; Gao, R.; Li, G.; Shang, Z.M.; Hao, J.Y. Health-related quality of life and survival in Chinese patients with chronic liver disease. Health Qual. Life Outcomes 2013, 11, 131. [Google Scholar] [CrossRef] [Green Version]
  11. Li, L.; Yeo, W. Value of quality of life analysis in liver cancer: A clinician’s perspective. World J. Hepatol. 2017, 9, 867–883. [Google Scholar] [CrossRef]
  12. Aber, A.; Howard, A.; Woods, H.B.; Jones, G.; Michaels, J. Impact of Carotid Artery Stenosis on Quality of Life: A Systematic Review. Patient 2018, in press. [Google Scholar] [CrossRef] [PubMed]
  13. Mikdashi, J. Measuring and monitoring health-related quality of life responsiveness in systemic lupus erythematosus patients: Current perspectives. Patient Relat. Outcome Meas. 2018, 9, 339–343. [Google Scholar] [CrossRef] [PubMed]
  14. Gerth, A.M.J.; Hatch, R.A.; Young, J.D.; Watkinson, P.J. Changes in health-related quality of life after discharge from an intensive care unit: A systematic review. Anaesthesia 2018, in press. [Google Scholar] [CrossRef]
  15. Paracha, N.; Abdulla, A.; MacGilchrist, K.S. Systematic review of health state utility values in metastatic non-small cell lung cancer with a focus on previously treated patients. Health Qual. Life Outcomes 2018, 16, 179. [Google Scholar] [CrossRef] [PubMed]
  16. Behboodi Moghadam, Z.; Fereidooni, B.; Saffari, M.; Montazeri, A. Measures of health-related quality of life in PCOS women: A systematic review. Int. J. Womens Health 2018, 10, 397–408. [Google Scholar] [CrossRef] [PubMed]
  17. Goodpaster, B.H.; Park, S.W.; Harris, T.B.; Kritchevsky, S.B.; Nevitt, M.; Schwartz, A.V.; Simonsick, E.M.; Tylavsky, F.A.; Visser, M.; Newman, A.B. The loss of skeletal muscle strength, mass, and quality in older adults: The health, aging and body composition study. J. Gerontol. A Biol. Sci. Med. Sci. 2006, 61, 1059–1064. [Google Scholar] [CrossRef]
  18. Nishikawa, H.; Shiraki, M.; Hiramatsu, A.; Moriya, K.; Hino, K.; Nishiguchi, S. Japan Society of Hepatology guidelines for sarcopenia in liver disease (1st edition): Recommendation from the working group for creation of sarcopenia assessment criteria. Hepatol. Res. 2016, 46, 951–963. [Google Scholar] [CrossRef] [PubMed]
  19. Montano-Loza, A.J. Clinical relevance of sarcopenia in patients with cirrhosis. World J. Gastroenterol. 2014, 20, 8061–8071. [Google Scholar] [CrossRef]
  20. Cruz-Jentoft, A.J.; Landi, F.; Schneider, S.M.; Zúñiga, C.; Arai, H.; Boirie, Y.; Chen, L.K.; Fielding, R.A.; Martin, F.C.; Michel, J.P.; et al. Prevalence of and interventions for sarcopenia in ageing adults: A systematic review. Report of the International Sarcopenia Initiative (EWGSOP and IWGS). Age Ageing 2014, 43, 748–759. [Google Scholar] [CrossRef]
  21. Sinclair, M.; Gow, P.J.; Grossmann, M.; Angus, P.W. Review article: Sarcopenia in cirrhosis—Aetiology, implications and potential therapeutic interventions. Aliment. Pharmacol. Ther. 2016, 43, 765–777. [Google Scholar] [CrossRef] [PubMed]
  22. Chen, L.K.; Liu, L.K.; Woo, J.; Assantachai, P.; Auyeung, T.W.; Bahyah, K.S.; Chou, M.Y.; Chen, L.Y.; Hsu, P.S.; Krairit, O.; et al. Sarcopenia in Asia: Consensus Report of the Asian Working Group for Sarcopenia. J. Am. Med. Dir. Assoc. 2014, 15, 95–101. [Google Scholar] [CrossRef] [PubMed]
  23. Nishikawa, H.; Enomoto, H.; Ishii, A.; Iwata, Y.; Miyamoto, Y.; Ishii, N.; Yuri, Y.; Hasegawa, K.; Nakano, C.; Nishimura, T.; et al. Elevated serum myostatin level is associated with worse survival in patients with liver cirrhosis. J. Cachexia. Sarcopenia. Muscle 2017, 8, 915–925. [Google Scholar] [CrossRef] [PubMed]
  24. Norman, K.; Otten, L. Financial impact of sarcopenia or low muscle mass—A short review. Clin. Nutr. 2018, in press. [Google Scholar] [CrossRef] [PubMed]
  25. Shirai, H.; Kaido, T.; Hamaguchi, Y.; Kobayashi, A.; Okumura, S.; Yao, S.; Yagi, S.; Kamo, N.; Taura, K.; Okajima, H.; et al. Preoperative Low Muscle Mass and Low Muscle Quality Negatively Impact on Pulmonary Function in Patients Undergoing Hepatectomy for Hepatocellular Carcinoma. Liver Cancer 2018, 7, 76–89. [Google Scholar] [CrossRef] [PubMed]
  26. De Bandt, J.P.; Jegatheesan, P.; Tennoune-El-Hafaia, N. Muscle Loss in Chronic Liver Diseases: The Example of Nonalcoholic Liver Disease. Nutrients 2018, in press. [Google Scholar] [CrossRef] [PubMed]
  27. Chang, K.V.; Chen, J.D.; Wu, W.T.; Huang, K.C.; Hsu, C.T.; Han, D.S. Association between Loss of Skeletal Muscle Mass and Mortality and Tumor Recurrence in Hepatocellular Carcinoma: A Systematic Review and Meta-Analysis. Liver Cancer 2018, 7, 90–103. [Google Scholar] [CrossRef]
  28. Anderson, L.J.; Liu, H.; Garcia, J.M. Sex Differences in Muscle Wasting. Adv. Exp. Med. Biol 2017, 1043, 153–197. [Google Scholar]
  29. Tsugawa, A.; Ogawa, Y.; Takenoshita, N.; Kaneko, Y.; Hatanaka, H.; Jaime, E.; Fukasawa, R.; Hanyu, H. Decreased muscle strength and quality in diabetes-related dementia. Dement. Geriatr. Cogn. Dis. Extra 2017, 7, 454–462. [Google Scholar] [CrossRef]
  30. Cantarero-Villanueva, I.; Fernández-Lao, C.; Díaz-Rodríguez, L.; Fernández-de-Las-Peñas, C.; Ruiz, J.R.; Arroyo-Morales, M. The handgrip strength test as a measure of function in breast cancer survivors: Relationship to cancer-related symptoms and physical and physiologic parameters. Am. J. Phys. Med. Rehabil. 2012, 91, 774–782. [Google Scholar] [CrossRef]
  31. Tada, T.; Kumada, T.; Toyoda, H.; Kiriyama, S.; Tanikawa, M.; Hisanaga, Y.; Kanamori, A.; Kitabatake, S.; Yama, T.; Tanaka, J. Long-term prognosis of patients with chronic hepatitis C who did not receive interferon-based therapy: Causes of death and analysis based on the FIB-4 index. J. Gastroenterol. 2016, 51, 380–389. [Google Scholar] [CrossRef] [PubMed]
  32. González-Madroño, A.; Mancha, A.; Rodríguez, F.J.; Culebras, J.; de Ulibarri, J.I. Confirming the validity of the CONUT system for early detection and monitoring of clinical undernutrition: Comparison with two logistic regression models developed using SGA as the gold standard. Nutr. Hosp. 2012, 27, 564–571. [Google Scholar] [PubMed]
  33. Fukuhara, S.; Ware, J.E., Jr.; Kosinski, M.; Wada, S.; Gandek, B. Psychometric and clinical tests of validity of the Japanese SF-36 Health Survey. J. Clin. Epidemiol. 1998, 51, 1045–1053. [Google Scholar] [CrossRef]
  34. Anand, A.C. Nutrition and muscle in cirrhosis. J. Clin. Exp. Hepatol. 2017, 7, 340–357. [Google Scholar] [CrossRef] [PubMed]
  35. Hanai, T.; Shiraki, M.; Miwa, T.; Watanabe, S.; Imai, K.; Suetsugu, A.; Takai, K.; Moriwaki, H.; Shimizu, M. Effect of loop diuretics on skeletal muscle depletion in patients with liver cirrhosis. Hepatol. Res. 2018, in press. [Google Scholar] [CrossRef] [PubMed]
  36. Fukui, H.; Saito, H.; Ueno, Y.; Uto, H.; Obara, K.; Sakaida, I.; Shibuya, A.; Seike, M.; Nagoshi, S.; Segawa, M.; et al. Evidence-based clinical practice guidelines for liver cirrhosis 2015. J. Gastroenterol. 2016, 51, 629–650. [Google Scholar] [CrossRef] [PubMed] [Green Version]
  37. Vidot, H.; Carey, S.; Allman-Farinelli, M.; Shackel, N. Systematic review: The treatment of muscle cramps in patients with cirrhosis. Aliment. Pharmacol. Ther. 2014, 40, 221–232. [Google Scholar] [CrossRef]
  38. Tandon, P.; Ismond, K.P.; Riess, K.; Duarte-Rojo, A.; Al-Judaibi, B.; Dunn, M.A.; Holman, J.; Howes, N.; Haykowsky, M.J.F.; Josbeno, D.A.; et al. Exercise in cirrhosis: Translating evidence and experience to practice. J. Hepatol. 2018, 69, 1164–1177. [Google Scholar] [CrossRef]
  39. Iwasa, M.; Karino, Y.; Kawaguchi, T.; Nakanishi, H.; Miyaaki, H.; Shiraki, M.; Nakajima, T.; Sawada, Y.; Yoshiji, H.; Okita, K.; et al. Relationship of muscle cramps to quality of life and sleep disturbance in patients with chronic liver diseases: A nationwide study. Liver Int. 2018, in press. [Google Scholar] [CrossRef]
  40. Sinclair, M.; Grossmann, M.; Hoermann, R.; Angus, P.W.; Gow, P.J. Testosterone therapy increases muscle mass in men with cirrhosis and low testosterone: A randomised controlled trial. J. Hepatol. 2016, 65, 906–913. [Google Scholar] [CrossRef]
  41. Durazzo, M.; Belci, P.; Collo, A.; Prandi, V.; Pistone, E.; Martorana, M.; Gambino, R.; Bo, S. Gender specific medicine in liver diseases: A point of view. World J. Gastroenterol. 2014, 20, 2127–2135. [Google Scholar] [CrossRef] [PubMed]
Figure 1. The SF-36 scores across 10 items in the decreased and non-decreased HGS groups (a), and the decreased and non-decreased SMM groups (b) for all cases (n = 389). The average scores in each item of the SF-36 were plotted.
Jcm 07 00553 g001
Figure 2. The SF-36 scores across 10 items in the decreased and non-decreased HGS groups (a), and the decreased and non-decreased SMM groups (b) in LC patients (n = 148). The average scores in each item of the SF-36 were plotted.
Jcm 07 00553 g002
Figure 3. The SF-36 scores across 10 items in the decreased and non-decreased HGS groups (a), and the decreased and non-decreased SMM groups (b) in non-LC patients (n = 241). The average scores in each item of the SF-36 were plotted.
Jcm 07 00553 g003
Figure 4. The SF-36 scores across 10 items in the decreased and non-decreased HGS groups (a), and the decreased and non-decreased SMM groups (b) in male patients (n = 198). The average scores in each item of the SF-36 were plotted.
Jcm 07 00553 g004
Figure 5. The SF-36 scores across 10 items in the decreased and non-decreased HGS groups (a), and the decreased and non-decreased SMM groups (b) in female patients (n = 191). The average scores in each item of the SF-36 were plotted.
Jcm 07 00553 g005
Figure 6. The SF-36 scores across 10 items in the decreased and non-decreased HGS groups (a), and the decreased and non-decreased SMM groups (b) in patients aged >65 years (n = 195). The average scores in each item of the SF-36 were plotted.
Jcm 07 00553 g006
Figure 7. The SF-36 scores across 10 items in the decreased and non-decreased HGS groups (a), and the decreased and non-decreased SMM groups (b) in patients aged <65 years (n = 194). The average scores in each item of the SF-36 were plotted.
Jcm 07 00553 g007
Table 1. Baseline characteristics.
VariablesAll Cases (n = 389)Decreased HGS (n = 93)Non-Decreased HGS (n = 296)p ValueDecreased SMM (n = 159)Non-decreased SMM (n = 230)p Value
Age (years)62.0 ± 12.869.7 ± 10.659.5 ± 12.5<0.000166.7 ± 12.258.7 ± 12.2<0.0001
Gender, male/female198/19136/57162/1340.008793/66105/1250.0135
Etiology, HBV/HCV/HBV, and HCV/NBNC61/234/8/8610/60/2/2151/174/6/650.513021/101/5/3240/133/3/540.3102
Presence of LC, yes/no148/24161/3287/209<0.000165/9483/1470.3416
Body mass index (kg/m2)23.2 ± 3.822.7 ± 3.323.3 ± 4.00.155420.9 ± 2.424.8 ± 3.8<0.0001
Total bilirubin (mg/dL)0.96 ± 0.580.96 ± 0.620.96 ± 0.570.95450.86 ± 0.391.02 ± 0.680.0718
Serum albumin (g/dL)4.1 ± 0.53.9 ± 0.574.2 ± 0.45<0.00014.2 ± 0.484.1 ± 0.520.2688
Prothrombin time (%)86.7 ± 16.684.1 ± 17.187.5 ± 16.30.079087.5 ± 16.986.1 ± 16.30.4112
Platelet count (×104/mm3)16.8 ± 6.915.1 ± 6.517.3 ± 6.90.008116.7 ± 6.216.8 ± 7.30.7315
White blood cell (/mm3)5165 ± 16145193 ± 16595156 ± 16020.84555240 ± 14665113 ± 17100.3114
Lymphocyte count (/mm3)3112 ± 9581395 ± 5981627 ± 6130.00151513 ± 5421613 ± 6610.2045
Total cholesterol (mg/dL)181.3 ± 41.3170.5 ± 47.2184.7 ± 38.80.0038182.0 ± 43.9180.8 ± 39.50.7775
CONUT score1.9 ± 1.92.7 ± 2.51.6 ± 1.60.00031.9 ± 1.71.9 ± 2.00.8450
AST (IU/L)37.7 ± 27.340.3 ± 29.236.8 ± 26.60.288636.9 ± 26.138.2 ± 28.10.6286
ALT (IU/L)37.3 ± 37.335.0 ± 38.438.1 ± 37.00.496635.4 ± 36.338.7 ± 38.00.3828
FIB-4 index3.3 ± 3.34.0 ± 2.83.1 ± 3.40.01423.2 ± 2.23.4 ± 3.90.0215
Serum creatinine (mg/dL)0.73 ± 0.540.76 ± 0.530.72 ± 0.550.47690.81 ± 0.810.67 ± 0.180.0095
HbA1c (NGSP)5.9 ± 0.885.9 ± 0.805.8 ± 0.900.70855.9 ± 0.845.8 ± 0.900.7085
Serum sodium (mmol/L)140.1 ± 2.3139.9 ± 2.5140.2 ± 2.30.2330140.3 ± 2.4140.0 ± 2.30.3413
HGS (kg), male33.6 ± 8.722.0 ± 3.936.3 ± 6.4<0.000129.4 ± 6.937.4 ± 7.5<0.0001
HGS (kg), female20.9 ± 5.214.8 ± 3.123.3 ± 3.6<0.000118.2 ± 4.122.4 ± 5.1<0.0001
SMI (kg/m2), male7.5 ± 1.17.0 ± 0.977.6 ± 1.090.00396.8 ± 0.438.1 ± 1.13<0.0001
SMI (kg/m2), female6.0 ± 0.75.6 ± 0.746.1 ± 0.68<0.00015.2 ± 0.396.4 ± 0.50<0.0001
Data are expressed as average ± standard deviation. HBV; hepatitis B virus, HCV; hepatitis C virus, NBNC; non-B and non-C, LC; liver cirrhosis, CONUT score; controlling nutritional score, AST; aspartate aminotransferase, ALT; alanine aminotransferase, NGSP; National Glycohemoglobin Standardization Program, HGS; hand grip strength, SMM; skeletal muscle mass, SMI; skeletal muscle mass index.
Table 2. Comparison of the SF-36 scores across 10 items in patients with LC and non-LC.
ALL CasesLC Patients (n = 148)Non-LC Patients (n = 241)p Value
PF79.9 ± 20.2 [76.6, 83.2]87.5 ± 15.8 [85.5, 89.5]<0.0001
RP77.0 ± 30.7 [72.0, 82.0]87.2 ± 21.4 [84.5, 90.0]0.0005
BP71.6 ± 26.1 [67.3, 75.9]76.3 ± 23.9 [73.3, 79.3]0.0709
GH51.6 ± 19.7 [48.4, 54.8]58.4 ± 19.1 [55.9, 60.9]0.0011
VT59.3 ± 22.6 [55.6, 63.0]67.6 ± 20.5 [65.0, 70.2]0.0002
SF82.9 ± 25.1 [78.8, 87.0]89.4 ± 19.4 [86.9, 91.9]0.0004
RE78.6 ± 28.3 [74.0, 83.3]88.1 ± 21.4 [85.4, 90.8]<0.0001
MH73.0 ± 20.6 [69.6, 76.4]74.9 ± 20.7 [72.2, 77.5]0.3845
PCS42.3 ± 16.2 [39.6, 45.1]48.7 ± 11.9 [47.1, 50.2]<0.0001
MCS49.9 ± 10.1 [48.2, 51.6]51.8 ± 10.4 [50.4, 53.1]0.0891
Data are expressed as average ± standard deviation and 95% confidence interval. LC; liver cirrhosis, PF; physical functioning, RP; role physical, BP; bodily pain, GH; general health perception, VT; vitality, SF; social functioning, RE; role emotion, MH; mental health, PCS; physical component summary score, MCS; mental component summary score.
Table 3. Comparison of the SF-36 scores across 10 items.
ALL CasesDecreased HGS (n = 93)Non-Decreased HGS (n = 296)p Value
PF72.8 ± 22.6 [68.1, 77.5]88.3 ± 14.3 [86.7, 90.0]<0.0001
RP70.6 ± 33.1 [63.7, 77.4]87.3 ± 21.7 [84.8, 89.8]<0.0001
BP68.1 ± 24.0 [63.2, 73.1]76.5 ± 24.8 [73.7, 79.4]0.0043
GH54.8 ± 22.7 [50.1, 59.5]56.1 ± 18.5 [53.9, 58.2]0.6190
VT57.7 ± 25.1 [52.5, 62.9]66.6 ± 20.0 [64.3, 68.9]0.0011
SF79.5 ± 25.4 [74.2, 84.8]89.3 ± 20.2 [86.9, 91.6]<0.0001
RE72.4 ± 30.3 [66.1, 78.8]88.3 ± 21.2 [85.9, 90.7]<0.0001
MH72.3 ± 24.1 [67.3, 77.3]74.7 ± 19.4 [72.5, 77.0]0.7439
PCS37.3 ± 16.7 [33.8, 40.8]49.2 ± 11.7 [47.8, 50.6]<0.0001
MCS50.5 ± 11.0 [48.2, 52.9]51.2 ± 10.1 [50.5, 52.4]0.5941
ALL CasesDecreased SMM (n = 159)Non-Decreased SMM (n = 230)p Value
PF81.3 ± 18.1 [78.5, 84.2]86.8 ± 17.5 [84.6, 89.1]0.0032
RP80.4 ± 27.2 [76.2, 84.7]85.3 ± 24.7 [82.1, 88.6]0.0660
BP74.7 ± 25.1 [70.8, 78.7]74.4 ± 24.6 [71.2, 77.6]0.8891
GH55.2 ± 20.4 [52.0, 58.5]56.1 ± 19.1 [53.6, 58.7]0.6656
VT62.6 ± 23.6 [58.9, 66.3]65.8 ± 20.2 [63.2, 68.4]0.3364
SF84.9 ± 24.7 [80.9, 88.8]88.3 ± 19.7 [85.7, 91.0]0.0031
RE82.0 ± 26.6 [77.8, 86.1]86.4 ± 23.0 [83.3, 89.4]0.0030
MH72.7 ± 22.4 [69.2, 76.2]75.2 ± 19.3 [72.7, 77.7]0.4683
PCS45.3 ± 14.2 [43.0, 47.6]47.0 ± 13.9 [45.1, 48.8]0.2610
MCS51.3 ± 10.5 [49.6, 53.0]50.8 ± 10.1 [49.5, 52.2]0.6601
LCDecreased HGS (n = 61)Non-Decreased HGS (n = 87)p Value
PF71.1 ± 23.1 [65.2, 77.1]86.2 ± 15.0 [82.9, 89.4]0.0002
RP68.0 ± 34.0 [59.3, 76.7]83.4 ± 26.5 [77.7, 89.1]0.0006
BP65.3 ± 22.8 [59.5, 71.2]76.1 ± 27.5 [70.2, 82.0]0.0002
GH51.0 ± 19.9 [46.0, 56.1]52.0 ± 19.7 [47.7, 56.3]0.7691
VT53.8 ± 23.7 [47.7, 59.9]63.2 ± 21.1 [58.7, 67.7]0.0132
SF76.7 ± 26.8 [69.8, 83.6]87.4 ± 22.9 [82.4, 92.3]0.0112
RE67.2 ± 30.9 [59.3, 75.2]86.7 ± 23.3 [81.7, 91.7]<0.0001
MH71.1 ± 22.8 [65.2, 77.0]74.3 ± 18.9 [70.3, 78.4]0.3514
PCS34.9 ± 16.5 [30.7, 39.2]47.9 ± 13.7 [44.8, 50.9]<0.0001
MCS49.3 ± 9.7 [46.8, 51.8]50.3 ± 10.5 [48.0, 52.7]0.5382
LCDecreased SMM (n = 66)Non-Decreased SMM (n = 82)p Value
PF75.7 ± 20.7 [70.5, 80.8]83.2 ± 19.2 [79.0, 87.4]0.0252
RP72.1 ± 31.6 [64.3, 80.0]80.9 ± 29.6 [74.4, 87.4]0.0867
BP72.3 ± 26.1 [65.8, 78.8]71.1 ± 26.3 [65.3, 76.8]0.7832
GH51.0 ± 20.0 [46.1, 56.0]52.1 ± 19.6 [47.7, 56.4]0.7589
VT56.3 ± 24.3 [50.2, 62.4]61.7 ± 21.0 [57.1, 66.3]0.1519
SF81.1 ± 28.4 [74.1, 88.3]84.3 ± 22.1 [79.4, 89.2]0.4615
RE73.1 ± 31.9 [65.2, 81.1]83.0 ± 24.4 [77.6, 88.4]0.0131
MH71.1 ± 23.7 [65.2, 77.0]74.5 ± 17.8 [70.6, 78.4]0.6602
PCS41.5 ± 17.2 [37.2, 45.8]43.0 ± 15.5 [39.5, 46.6]0.5729
MCS50.4 ± 10.4 [47.8, 53.1]49.4 ± 9.9 [47.2, 51.7]0.5615
Non-LCDecreased HGS (n = 32)Non-Decreased HGS (n = 209)p Value
PF76.1 ± 21.6 [68.1, 84.0]89.2 ± 14.0 [87.3, 91.1]<0.0001
RP75.7 ± 30.9 [64.4, 87.1]88.9 ± 19.2 [86.3, 91.6]<0.0001
BP73.5 ± 25.6 [64.3, 82.7]76.7 ± 23.6 [73.5, 79.9]0.4782
GH62.0 ± 26.2 [52.5, 71.5]57.8 ± 17.7 [55.3, 60.3]0.0876
VT65.0 ± 26.5 [55.5, 74.6] 68.0 ± 19.4 [65.4, 70.7]0.4422
SF84.9 ± 22.1 [76.8, 93.0]90.1 ± 18.9 [87.5, 92.7]0.1629
RE82.5 ± 27.0 [72.6, 92.4]89.0 ± 20.3 [86.2, 91.7]0.0002
MH74.6 ± 26.6 [65.0, 84.2]74.9 ± 19.7 [72.2, 77.6]0.4130
PCS41.9 ± 16.4 [35.8, 48.0]49.7 ± 10.6 [48.2, 51.2]0.0018
MCS53.1 ± 13.1 [48.2, 58.0]51.6 ± 9.9 [40.2, 52.9]0.3525
Non-LCDecreased SMM (n = 94)Non-Decreased SMM (n = 147)p Value
PF85.3 ± 14.9 [82.2, 88.3]88.9 ± 16.2 [86.3, 91.5]0.0830
RP86.2 ± 21.9 [81.7, 90.7]87.9 ± 21.2 [84.4, 91.3]0.5689
BP76.6 ± 24.4 [71.4, 81.5]76.2 ± 23.6 [72.4, 80.1]0.9476
GH58.3 ± 20.2 [54.0, 62.5]58.4 ± 18.5 [55.4, 61.5]0.9482
VT66.9 ± 22.2 [62.4, 71.5]68.1 ± 19.4 [64.9, 71.2]0.6748
SF87.7 ± 21.5 [83.0, 91.9]90.7 ± 17.8 [87.7, 93.6]0.2185
RE87.9 ± 20.5 [83.8, 92.1]88.2 ± 22.0 [84.6, 91.8]0.9205
MH73.8 ± 21.5 [69.3, 78.2]75.6 ± 20.2 [72.3, 78.9]0.5102
PCS48.0 ± 11.1 [45.7, 50.3]49.1 ± 12.4 [47.1, 51.2]0.4689
MCS52.0 ± 10.6 [49.7, 54.2]51.6 ± 10.2 [49.9, 53.3]0.8203
MaleDecreased HGS (n = 36)Non-Decreased HGS (n = 162)p Value
PF72.9 ± 23.7 [64.9, 80.9]88.9 ± 13.9 [86.7, 91.1]<0.0001
RP69.8 ± 34.9 [58.0, 81.6]88.6 ± 20.1 [85.4, 91.7]<0.0001
BP72.2 ± 26.0 [63.4, 81.0]78.9 ± 23.6 [75.2, 82.5]0.1328
GH55.1 ± 23.1 [47.3, 62.9]54.7 ± 18.3 [51.8, 57.6]0.9145
VT60.2 ± 26.3 [51.1, 69.2]65.8 ± 20.5 [62.7, 69.0]0.1614
SF81.2 ± 27.2 [71.8, 90.5]88.9 ± 20.3 [85.7, 92.1]<0.0001
RE71.5 ± 33.2 [60.1, 82.9]88.9 ± 20.8 [85.6, 92.1]<0.0001
MH74.8 ± 24.0 [66.6, 83.1]72.9 ± 20.0 [69.7, 76.0]0.6112
PCS37.0 ± 18.7 [30.6, 43.4]50.4 ± 11.6 [48.5, 52.3]<0.0001
MCS52.7 ± 11.5 [48.8, 56.7]50.1 ± 10.3 [48.4, 51.7]0.1817
MaleDecreased SMM (n = 92)Non-Decreased SMM (n = 106)p Value
PF83.4 ± 16.5 [80.0. 86.8]88.3 ± 17.5 [84.9, 91.7]0.0451
RP81.6 ± 26.8 [76.1, 87.1]88.3 ± 21.8 [84.1, 92.6]0.0035
BP77.1 ± 24.8 [72.0, 82.2]78.2 ± 23.6 [73.6, 82.7]0.7508
GH53.9 ± 20.9 [49.6, 58.3]55.5 ± 17.8 [52.0, 59.0]0.5712
VT63.6 ± 24.5 [58.6, 68.7]65.9 ± 18.9 [62.2, 69.5]0.9880
SF85.3 ± 25.0 [80.1, 90.5]89.5 ± 18.6 [85.8, 93.1]0.0507
RE82.6 ± 27.1 [77.0, 88.2]88.5 ± 21.3 [84.4, 92.7]0.0904
MH73.2 ± 22.5 [68.6, 77.9]73.2 ± 19.2 [69.5, 76.9]0.9942
PCS46.3 ± 14.6 [43.3, 49.4]49.4 ± 13.7 [46.6, 52.1]0.1419
MCS51.1 ± 11.2 [48.7, 53.4]50.1 ± 10.1 [48.1, 52.1]0.5428
FemaleDecreased HGS (n = 57)Non-Decreased HGS (n = 134)p Value
PF72.7 ± 22.1 [66.8, 78.7]87.6 ± 14.9 [85.0, 90.1]<0.0001
RP71.1 ± 32.2 [62.5, 79.7]85.8 ± 23.4 [81.8, 89.8]<0.0001
BP65.6 ± 22.5 [59.6, 71.6]73.6 ± 25.9 [69.2, 78.1]0.0432
GH54.6 ± 22.7 [48.6, 60.6]57.8 ± 18.6 [54.5, 61.0]0.3266
VT56.2 ± 24.5 [49.7, 62.7]67.5 ± 19.4 [64.2, 70.9]0.0006
SF78.4 ± 24.5 [71.9, 85.0]89.7 ± 20.1 [86.2, 93.3]0.0012
RE73.0 ± 8.7 [65.3, 80.7]87.6 ± 21.7 [83.9, 91.3]<0.0001
MH70.8 ± 24.3 [64.3, 77.2]77.1 ± 18.5 [73.9, 80.3]0.1394
PCS37.4 ± 15.5 [33.2, 41.6]47.7 ± 11.6 [45.7, 49.8]<0.0001
MCS49.2 ± 10.5 [46.3, 52.0]52.6 ± 9.6 [50.9, 54.3]0.0326
FemaleDecreased SMM (n = 66)Non-Decreased SMM (n = 125)p Value
PF78.5 ± 19.9 [73.6, 83.5]85.6 ± 17.5 [82.5, 88.7]0.0124
RP78.8 ± 27.8 [71.9, 85.7]82.8 ± 26.7 [78.1, 87.6]0.3273
BP71.3 ± 25.3 [65.0, 77.6]71.1 ± 25.2 [66.7, 75.6]0.9672
GH57.1 ± 19.7 [52.2, 62.0]56.6 ± 20.2 [53.0, 60.3]0.8853
VT61.1 ± 22.3 [55.6, 66.6]65.7 ± 21.2 [61.9, 69.5]0.1652
SF84.2 ± 24.5 [78.2, 90.3]87.4 ± 20.6 [83.7, 91.2]0.3527
RE81.0 ± 26.2 [74.6, 87.5]84.5 ± 24.1 [80.3, 88.8]0.3546
MH71.9 ± 22.4 [66.4, 77.5]76.9 ± 19.4 [73.4, 80.3]0.1161
PCS43.9 ± 13.7 [40.4, 47.3]45.0 ± 13.8 [42.5, 47.5]0.5979
MCS51.7 ± 9.7 [49.3, 54.1]51.5 ± 10.2 [49.6, 53.3]0.8719
≥65 yearsDecreased HGS (n = 74)Non-Decreased HGS (n = 121)p Value
PF72.8 ± 23.5 [67.3, 78.3]84.9 ± 14.0 [82.3, 87.4]0.0001
RP68.8 ± 34.6 [60.8, 76.9]86.3 ± 20.6 [82.6, 90.1]<0.0001
BP68.8 ± 24.3 [63.2, 74.4]78.0 ± 24.1 [73.6, 82.4]0.0111
GH57.6 ± 23.3 [52.2, 63.0]56.8 ± 18.9 [53.3, 60.3]0.7950
VT57.9 ± 25.7 [52.0. 63.9]68.9 ± 19.8 [65.3, 72.5]0.0021
SF78.3 ± 25.1 [72.5, 84.1]91.1 ± 18.3 [87.7, 94.4]<0.0001
RE71.5 ± 30.6 [64.4, 78.7]88.0 ± 20.5 [84.2, 91.7]<0.0001
MH73.0 ± 25.1 [67.2, 78.8]77.4 ± 17.9 [74.1, 80.6]0.5509
PCS36.5 ± 17.6 [32.4, 40.6]47.2 ± 10.1 [45.3, 49.1]<0.0001
MCS51.5 ± 11.2 [48.9, 54.1]53.5 ± 9.2 [51.8, 55.2]0.1822
≥65 yearsDecreased SMM (n = 110)Non-Decreased SMM (n = 85)p Value
PF78.5 ± 18.6 [75.0, 82.1]82.6 ± 19.4 [78.4, 86.8]0.1435
RP78.3 ± 28.6 [72.8, 83.7]81.6 ± 27.4 [75.6, 87.5]0.4226
BP73.9 ± 26.2 [68.9, 78.9]75.2 ± 22.4 [70.3, 80.0]0.7338
GH56.6 ± 21.9 [52.4, 60.8]57.8 ± 19.0 [53.6, 62.0]0.6926
VT62.8 ± 24.4 [58.2, 67.4]67.2 ± 20.6 [62.8, 71.7]0.1809
SF85.5 ± 23.8 [80.9, 90.0]86.9 ± 19.5 [82.6, 91.2]0.6548
RE80.1 ± 27.3 [74.9, 85.2]83.9 ± 24.2 [78.6, 89.3]0.3090
MH74.0 ± 22.3 [69.8, 78.2]77.9 ± 19.1 [73.8, 82.1]0.1972
PCS43.3 ± 14.1 [40.6, 45.9]42.7 ± 15.2 [39.3, 46.1]0.7951
MCS52.8 ± 10.1 [50.9, 54.7]52.6 ± 10.1 [50.4, 54.9]0.9288
<65 yearsDecreased HGS (n = 19)Non-Decreased HGS (n = 175)p Value
PF72.8 ± 19.6 [63.3, 82.2]90.7 ± 14.1 [88.6, 92.8]<0.0001
RP77.3 ± 25.9 [64.8, 89.8]88.0 ± 22.4 [84.6, 91.3]0.0530
BP65.5 ± 23.1 [54.4, 76.7]75.5 ± 25.2 [71.8, 79.3]0.0990
GH44.0 ± 16.9 [35.8, 52.1]55.6 ± 18.3 [52.8, 58.4]0.0088
VT56.8 ± 23.2 [45.3, 68.3]65.0 ± 20.0 [62.0, 68.0]0.1042
SF84.6 ± 27.1 [70.7, 98.6]88.1 ± 21.3 [84.9, 91.3]0.5338
RE76.2 ± 29.8 [61.4, 91.0]88.5 ± 21.7 [85.3, 91.8]0.0281
MH69.4 ± 20.2 [59.3, 79.4]73.0 ± 20.3 [70.0, 76.0]0.4708
PCS40.5 ± 11.8 [34.4, 46.6]50.5 ± 12.5 [48.6, 52.4]0.0018
MCS46.5 ± 9.4 [41.7, 51.3]49.6 ± 10.3 [48.1, 51.2]0.2286
<65 yearsDecreased SMM (n = 49)Non-Decreased SMM (n = 145)p Value
PF87.7 ± 15.1 [83.4, 92.1]89.3 ± 15.8 [86.7, 91.9]0.5386
RP85.2 ± 23.3 [78.6, 91.9]87.5 ± 22.8 [83.8, 91.3]0.5501
BP76.5 ± 22.8 [69.9, 83.0]73.9 ± 25.9 [69.7, 78.2]0.5389
GH52.0 ± 16.1 [47.3, 56.8]55.2 ± 19.1 [52.0, 58.4]0.3182
VT62.2 ± 21.9 [55.8, 68.5]65.0 ± 19.9 [61.7, 68.2]0.4133
SF83.4 ± 26.9 [75.5, 91.4]89.2 ± 19.8 [85.9, 92.5]0.0286
RE86.3 ± 24.8 [79.1, 93.5]87.7 ± 22.2 [84.1, 91.4]0.7097
MH69.7 ± 22.5 [63.2, 76.3]73.6 ± 19.4 [70.4, 76.8]0.2510
PCS50.2 ± 13.6 [46.1, 54.3]49.4 ± 12.5 [47.3, 51.5]0.7120
MCS47.9 ± 10.9 [44.6, 51.1]49.8 ± 10.0 [48.2, 51.5]0.2593
Data are expressed as average ± standard deviation and 95% confidence interval. HGS; hand grip strength, SMM; skeletal muscle mass, LC; liver cirrhosis, PF; physical functioning, RP; role physical, BP; bodily pain, GH; general health perception, VT; vitality, SF; social functioning, RE; role emotion, MH; mental health, PCS; physical component summary score, MCS; mental component summary score.
Table 4. Relationship between baseline data and the SF-36 scores in each item in male and female patients.
MalePFRPBPGHVT
rp Valuerp Valuerp Valuerp Valuerp Value
Age−0.210.0036−0.120.0939−0.120.08690.110.12980.0690.3346
BMI−0.0570.4246−0.0510.4740−0.0470.50910.0390.5925−0.0440.5394
HGS0.32<0.00010.250.00070.0480.5242−0.0160.89240.00580.9383
SMI−0.00660.9268−0.00280.9685−0.0810.2577−0.000350.9961−0.0620.3920
Albumin0.42<0.00010.38<0.00010.210.00250.180.01430.250.0005
Bilirubin0.0110.8784−0.0210.7731−0.0410.5686−0.0610.4026−0.02780.7018
PT0.260.00020.160.02450.0630.37730.170.02090.190.0086
Platelet0.110.12500.0420.5583−0.0310.66530.110.14490.0200.7802
CONUT−0.4<0.0001−0.30<0.0001−0.120.0924−0.170.0164−0.170.0181
AST−0.010.1626−0.270.0013−0.150.0412−0.210.0030−0.160.0220
ALT−0.0270.7035−0.180.0104−0.110.1393−0.170.0189−0.130.0707
MaleSFREMHPCSMCS
rp Valuerp Valuerp Valuerp Valuerp Value
Age−0.0190.7916−0.0640.37320.140.0509−0.240.00110.220.0030
BMI−0.0460.52940.0550.44410.0310.6637−0.0830.2600.00990.8930
HGS0.100.18270.160.0324−0.100.17720.290.0001−0.160.0353
SMI−0.0430.56010.0560.43910.0460.5193−0.0500.4976−0.020.7834
Albumin0.270.00020.33<0.00010.0860.22730.46<0.00010.0460.5348
Bilirubin−0.0640.3845−0.00710.92150.0670.3569−0.020.7925−0.0350.6371
PT0.160.02860.100.15030.0200.78490.190.00880.0690.3468
Platelet0.100.1614−0.0400.5762−0.12430.08180.0510.4905−0.0230.7590
CONUT−0.190.0091−0.210.00310.0260.71970.36<0.00010.0110.8773
AST−0.0700.3345−0.190.0071−0.130.0675−0.160.0286−0.120.1021
ALT−0.0250.7311−0.200.0050−0.150.03310.100.1650−0.110.1172
FemalePFRPBPGHVT
rp Valuerp Valuerp Valuerp Valuerp Value
Age−0.250.0004−0.150.03840.0510.48350.0770.2987−0.0350.6346
BMI−0.0370.6128−0.00650.9292−0.0250.7329−0.02480.73830.00590.9357
HGS0.35<0.00010.180.01950.0980.19530.0540.48150.230.0022
SMI0.200.00530.100.1677−0.0480.5136−0.00550.94090.0960.1877
Albumin0.240.00110.270.00020.150.04070.160.03510.200.0058
Bilirubin−0.0780.2909−0.180.0133−0.130.0711−0.0920.2216−0.110.1427
PT0.0210.77590.120.09780.0660.36630.0880.23490.140.0552
Platelet0.110.12470.130.0800.0690.34440.0400.59080.0830.2585
CONUT−0.20.0051−0.270.0002−0.160.0246−0.190.0088−0.150.0423
AST−0.110.1441−0.120.1023−0.100.1521−0.0940.2403−0.170.0181
ALT−0.030.6782−0.0390.5944−0.140.0507−0.0870.2403−0.130.0662
FemaleSFREMHPCSMCS
rp Valuerp Valuerp Valuerp Valuerp Value
Age0.0170.8212−0.110.1373−0.0210.7774−0.200.00660.0970.1948
BMI−0.0120.8759−0.00450.9511−0.00750.9186−0.0620.4035−0.0440.5541
HGS0.180.01790.190.01120.170.02220.280.00030.150.0446
SMI0.0250.73190.110.13750.0570.43950.0870.2433−0.0600.4255
Albumin0.200.00720.190.00980.120.08780.30<0.00010.150.0481
Bilirubin−0.180.0148−0.160.0304−0.040.5927−0.210.0043−0.0740.3295
PT0.140.05030.130.07660.120.10360.120.10300.190.0119
Platelet0.0980.18370.120.10670.120.11030.160.03110.0930.2115
CONUT−0.170.0253−0.170.02060.0810.2708−0.31<0.0001−0.110.1407
AST−0.160.0336−0.130.0719−0.160.0245−0.110.1386−0.170.0206
ALT−0.0840.2597−0.0510.4811−0.980.1817−0.0250.7397−0.150.0462
PF; physical functioning, RP; role physical, BP; bodily pain, GH; general health perception, VT; vitality, SF; social functioning, RE; role emotion, MH; mental health, PCS; physical component summary score, MCS; mental component summary score, BMI; body mass index, HGS; hand grip strength, SMI; skeletal muscle mass index, PT; prothrombin time, CONUT; controlling nutritional score, AST; aspartate aminotransferase, ALT; alanine aminotransferase.
Table 5. Multivariate analyses of factors linked to the SF-36 scores in male and female patients.
MaleParameter (Significant Factor Only)EstimatesStandard Errorp Value
PFHGS0.4940.1040.0031
Serum albumin9.0083.1520.0048
CONUT score−1.6560.7960.0389
RPHGS0.5790.2440.0185
Serum albumin17.5934.8990.0004
BPNANANANA
GHNANANANA
VTSerum albumin8.9444.1580.0327
SFSerum albumin10.4563.9290.0085
RESerum albumin18.7654.8910.0002
ALT−0.2450.08450.0042
MHNANANANA
PCSHGS0.2880.1410.0421
Serum albumin11.0162.692<0.0001
MCSNANANANA
FemaleParameter (significant factor only)EstimatesStandard errorp Value
PFHGS0.9580.3220.0034
RPNANANANA
BPNANANANA
GHNANANANA
VTHGS0.8510.3460.0150
SFNANANANA
REHGS0.7290.360.0422
MHAST−0.1240.06090.0440
PCSHGS0.5210.220.0191
MCSNANANANA
PF; physical functioning, RP; role physical, BP; bodily pain, GH; general health perception, VT; vitality, SF; social functioning, RE; role emotion, MH; mental health, PCS; physical component summary score, MCS; mental component summary score, HGS; hand grip strength, CONUT score; controlling nutritional score, NA; not applicable, ALT; alanine aminotransferase, AST; aspartate aminotransferase.

