 Janette S. Y. Kwok1*
 Stephen K. F. Cheung1
 Jenny C. Y. Ho1
 Ivan W. H. Tang1Patrick W. K. Chu1Eric Y. S. Leung1
 Pamela P. W. Lee2
 Daniel K. L. Cheuk2Vincent Lee3Patrick Ip2
 Y. L. Lau2
- 1Division of Transplantation and Immunogenetics, Department of Pathology, Queen Mary Hospital, Hong Kong, Hong Kong
- 2Department of Paediatrics and Adolescent Medicine, The University of Hong Kong, Hong Kong, Hong Kong
- 3Department of Paediatrics, The Chinese University of Hong Kong, Hong Kong, Hong Kong
The clinical experience gathered throughout the years has raised awareness of primary immunodeficiency diseases (PIDD). T cell receptor excision circles (TREC) and kappa-deleting recombination excision circles (KREC) assays for thymic and bone marrow outputs measurement have been widely implemented in newborn screening (NBS) programs for Severe Combined Immunodeficiency. The potential applications of combined TREC and KREC assay in PIDD diagnosis and immune reconstitution monitoring in non-neonatal patients have been suggested. Given that ethnicity, gender, and age can contribute to variations in immunity, defining the reference intervals of TREC and KREC levels in the local population is crucial for setting up cut-offs for PIDD diagnosis. In this retrospective study, 479 healthy Chinese sibling donors (240 males and 239 females; age range: 1 month−74 years) from Hong Kong were tested for TREC and KREC levels using a simultaneous quantitative real-time PCR assay. Age-specific 5th–95th percentile reference intervals of TREC and KREC levels (expressed in copies per μL blood and copies per 106 cells) were established in both pediatric and adult age groups. Significant inverse correlations between age and both TREC and KREC levels were observed in the pediatric age group. A significant higher KREC level was observed in females than males after 9–12 years of age but not for TREC. Low TREC or KREC levels were detected in patients diagnosed with mild or severe PIDD. This assay with the established local reference intervals would allow accurate diagnosis of PIDD, and potentially monitoring immune reconstitution following haematopoietic stem cell transplantation or highly active anti-retroviral therapy in the future.
Introduction
T and B cells undergo V(D)J recombination to generate diverse and functional TCR and BCR repertoires, and these are crucial processes in the maturation of T and B cells that allow the recognition of unlimited numbers of antigens (1). During the TCR rearrangement process, excised DNA fragments create T cell receptor excision circles (TREC) that are exported to the T cell cytoplasm (2, 3). In particular, the δRec-ψJα signal joint TREC (sjTREC) is produced during TCRD deletion and detected in ~70% of (alpha-beta) αβ T cells. They are considered the most optimal target to measure the evaluation of thymic output (4–6). Kappa-deleting recombination excision circles (KREC) are produced during BCR rearrangement in naïve B cells and are analogous to TREC (7). Similarly, sjKREC formed during intronRSS-Kde rearrangements in IGK locus is a robust target for the evaluation of B cell neogenesis from bone marrow (8, 9).
Both TREC and KREC are stable and non-replicative, and are subsequently diluted during cell proliferation (10, 11). Hence, TREC and KREC analyses have been widely applied in different clinical settings to evaluate thymic and bone marrow output. Measurement of TREC and KREC levels in peripheral blood can be used for screening of Primary immunodeficiency diseases (PIDD). PIDD, also known as inborn errors of immunity (IEI), are a group of disorders that lead to defects in the development or function of the immune system. The international Union of Immunological Societies (IUIS) has classified and described over 400 PIDD (12). There is an increasing number of PIDD due to an updated definition and advancements in diagnostic technology. The disease prevalence is reported to be as high as 127 in 100,000 (13, 14), and higher rates are expected in regions where consanguinity is more common. In Hong Kong, as there is no formal registry for PIDD, the Asian Primary Immunodeficiency Network (APIN) was formed to collect data on PIDD with a mission to improve care, education, and research (15, 16). Up to January 2020, over 140 local and 750 overseas PIDD patients referred via APIN have been diagnosed at the Department of Pediatrics and Adolescent Medicine, Queen Mary Hospital, the University of Hong Kong. Pediatric patients with PIDD are more likely to have recurrent bacterial or fungal infections (17). Severe forms of PIDD such as Severe Combined Immunodeficiency (SCID) are highly fatal if diagnosis and treatment are delayed, particularly after the onset of such infections.
Since 2015, newborn screening (NBS) using TREC levels for the early identification of SCID has been implemented in Israel, New Zealand, Norway, Taiwan, Switzerland, Germany, Iceland, Italy and several regions in Canada, United States, and Australia (18–20). Recently, Sweden, Spain, and Saudi Arabia have evaluated the application of both TREC and KREC levels for screening of SCID and agammaglobulinemia (6, 21, 22). The reference intervals and cut-off values TREC and KREC have been established for neonates. Studies have demonstrated the impact of aging on thymopoiesis and bone marrow output (23, 24). In order to interpret the TREC and KREC levels for non-neonatal PIDD patients, it is necessary to establish local and ethnic reference intervals in healthy individuals of different age groups.
In this study, we measured the TREC and KREC levels of healthy Chinese individuals in Hong Kong with essential age groups of 0–18 years, as PIDD occurs in patients mainly in this age range (16, 25). We also determined the reference intervals for adults in age groups of 19–74 years for applications in thymic and/or bone marrow output monitoring for post-HSCT patients. The effects of age and gender on the KREC and TREC levels were also analyzed. The analysis of TREC and KREC levels was performed using a multiplex real-time PCR method and the values were expressed in both copies per μL blood and copies per 106 cells.
Materials and Methods
Subjects
Archived DNA extracted from whole blood specimens from 479 healthy Chinese sibling donors aged 1 month−74 years collected during 2011–2019 for work-up for related patients requiring HSCT were used in this study. All healthy controls underwent thorough clinical evaluations and were screened for a normal blood cell count. Blood samples from 12 PIDD patients with definitive diagnosis of SCID (n = 2), X-SCID (n = 3), Agammaglobulinemia (n = 3), DiGeroge Syndrome (DGS, n = 1), and Activated PI3K-Delta Syndrome (APDS, n = 1), GATA2 deficiency (n = 1) and X-linked hyper-IgM syndrome (HIGM, n = 1) were used as disease controls. Reference DBS specimens were generous gifts from Dr. Francis Lee, Centers for Disease Control and Prevention (CDC), US. This study was carried out in accordance with the Declaration of Helsinki and the ICH-GCP. The protocol was approved by the Institutional Review Board of the University of Hong Kong/Hospital Authority Hong Kong West Cluster (HKU/HA HKWC IRB No. UW 18-185). The tests were performed at the Division of Transplantation and Immunogenetics, Queen Mary Hospital, Hong Kong.
DNA Extraction From Whole Blood Specimens
Genomic DNA from EDTA whole blood samples was extracted by a magnetic beads-based purification method using the TBG EZbead blood DNA Extraction Kit (Texas BioGene Inc., Taiwan) according to the manufacturer's instructions. DNA extracted from whole blood samples (300 μL) was eluted in 100 μL Tris-EDTA buffer and stored at −70°C. DNA purity was assessed using spectrophotometer and all samples had OD260/280 ratio between 1.7 and 2.0. DNA integrity was assessed by loading 50 ng DNA in 1% agarose gel electrophoresis and no DNA degradation was detected.
DNA Elution From Dried Blood Spot Specimens
Dried blood spot (DBS) cards were stored in low-gas permeable bags at −20°C according to Clinical and Laboratory Standards Institute (CLSI) guideline NBS06-A. DBS discs (2 mm) were punched and washed once in 100 μL Qiagen DNA elution buffer with shaking at 1,500 rpm for 10 min. The wash buffer was removed and a fresh 40 μL DNA elution buffer was added and subsequently heated at 95°C for 30 min. The eluted DNA in the supernatant was collected for TREC/KREC analysis and the TREC results were compared with those measured using CDC in-house assay. TREC/KREC analysis of 3 different spots on the same DBS sample were performed.
Quantitative PCR Assay
Levels of TREC, KREC, and β-actin (internal control) were simultaneously quantified in a 20-μL reaction volume containing 5 μL DNA, 4 μL LightCycler Multiplex DNA Master Mix (Roche Diagnostics, Germany), 500 nM primers (TREC primer, KREC primer, and β-actin primer), and 125 nM probes (FAM-labeled TREC probe, HEX-labeled KREC probe, and Cy5-labeled β-actin probe; Integrated DNA Technologies, Singapore). The primer and probe sequences are listed in Table 1, and their designs have been previously described by Chan et al. and Sottini et al. (18, 26). The PCR analysis was performed using the LC480 II Real-Time PCR (RT-PCR) System (Roche Diagnostics, Germany) with PCR conditions of 5 min at 95°C followed by 45 cycles of 5 s at 95°C and 1 min at 60°C. The TREC/KREC plasmids were a generous gift from Dr. Sottini (26). The β-actin plasmid coding the human β-actin DNA sequence was commercially manufactured (Integrated DNA Technologies, Singapore). Standard curves for the quantification of TREC, KREC, and β-actin were obtained by using 10-fold serially diluted TREC, KREC, and β-actin plasmids (1 × 10⁶-1 × 10 copies/reaction). The copies of TREC and KREC were calculated and expressed as copies/μL blood or copies/106 nucleated cells as follow:
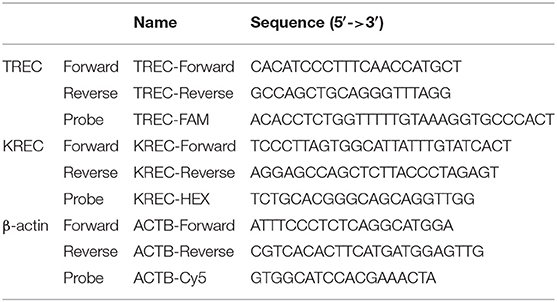
Table 1. Primer and probe sequences of TREC, KREC, and β-actin.
Statistical Analysis
Analysis of the data was performed using the Prism program version 5.01. Data were expressed as median ± SD or range and 5th–95th percentile for quantitative non-parametric measures, and both number and percentage for categorized data. Mann-Whitney U-test was used for comparisons between two independent groups for non-parametric data. Spearman's correlation coefficient test was performed to assess the strength of the relationship between studied parameters and age. A p-value of less than 0.05 was considered significant.
Results
This study included 294 healthy pediatric sibling donors (150 males and 144 females; age range: 1 month−18 years; median age: 9.9 years) and 185 adult donors (90 males and 95 females; median age: 44.1 years). The number of males and females in the different age groups are listed in Table 2. The TREC and KREC levels were calculated as copies/μL blood and copies/106 cells. The medians and ranges of TREC and KREC levels of male and female in different age groups were provided in the Supplementary Tables 1, 2. Samples with TREC and KREC levels below the detection limit (10 copies/reaction) were checked for the presence of β-actin copies to confirm that the low levels were not due to amplification errors and therefore amplification failure can be ruled out.
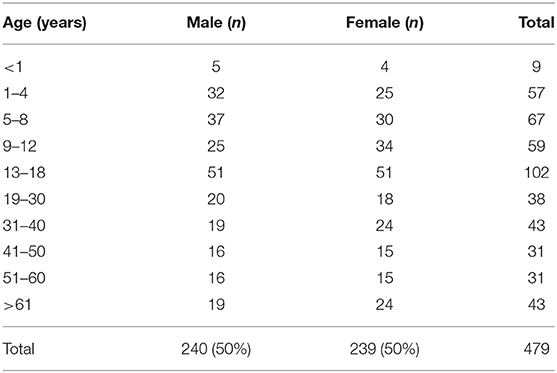
Table 2. Number of subjects in different age groups.
TREC and KREC Levels Declined With Increasing Age
The TREC and KREC levels were plotted against age of healthy individuals to assess any overall correlations (Figures 1, 2). A distinct pattern was observed in pediatric individuals (0–18 years) compared to adults (>18 years), thus the data was divided into pediatric and adult age groups and analyzed separately. The highest levels of TREC and KREC were observed in those of early age. There was a significant inverse correlation between TREC levels (both copies/μL blood and copies/106 cells) and age for both pediatric and adult groups. The rate of decline in TREC level with age was greater in the pediatric group and slowed down with age in the adult group. A significant inverse correlation between KREC level (both copies/μL blood and copies/106 cells) was also found in the pediatric group, but not in the adult group. The KREC level varied but was maintained at a stably low level in adult. No difference in TREC level was observed between males and females in all age groups. A significantly higher KREC level (copies/μL blood) was detected in females than in males after 9–12 years of age (Figure 3). In addition, a significant positive correlation was observed between units in copies/μL blood and units in copies/106 cells for both TREC and KREC levels (Figure 4).
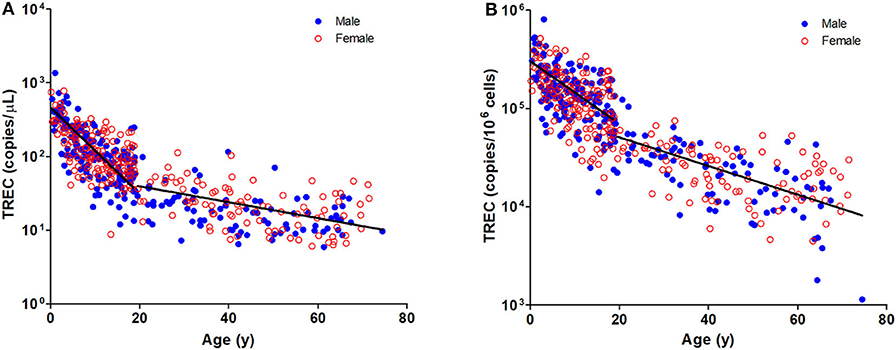
Figure 1. Dot Plot showing TREC copies/μL blood (A) and TREC copies/106 cells (B) among the study age groups. Blue full circles represent healthy males and red empty circles represent healthy females. A significant inverse correlation was observed between TREC levels and both pediatric and adult age groups (Pediatric: r = −0.6488, p < 0.0001 for copies/μL and r = −0.5487, p < 0.0001 for copies/106 cells; Adult: r = −0.4924, p < 0.0001 for copies/μL and r = −0.6289, p < 0.0001 for copies/106 cells).
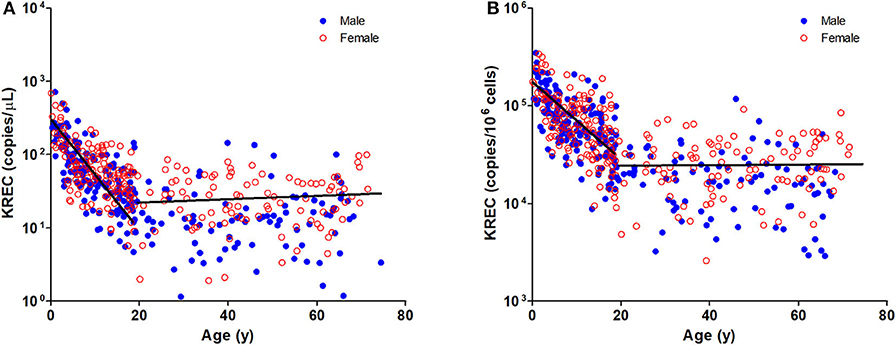
Figure 2. Dot Plot showing KREC copies/μL blood (A) and TREC copies/106 cells (B) among the study age groups. Blue full circles represent healthy males and red empty circles represent healthy females. A significant inverse correlation was observed between KREC levels and pediatric age groups (Pediatric: r = −0.6577, p < 0.0001 for copies/μL and r = −0.6241, p < 0.0001 for copies/106 cells; Adult: r = 0.0903, p = 0.2216 for copies/μL and r = −0.0171, p = 0.8176 for copies/106 cells).
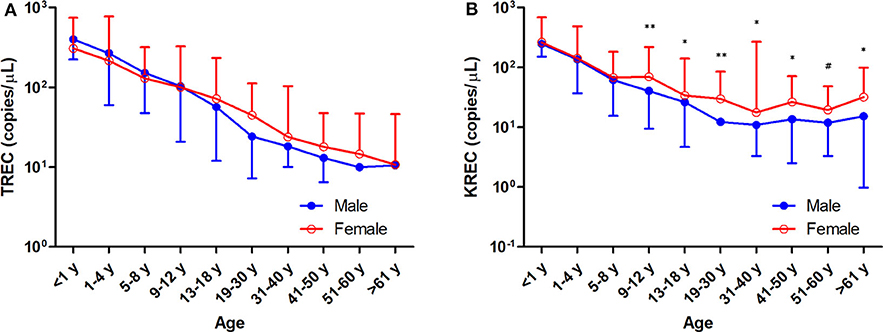
Figure 3. Trend of TREC copies/μL blood (A) and KREC copies/μL blood (B) among the study age groups. Data is expressed as median ± range. Blue full circles represent healthy males and red empty circles represent healthy females. A significant higher KREC level was observed for age groups after 9–12 years, except for 51–60 years. *p < 0.05, **p < 0.01, #p = 0.0510.
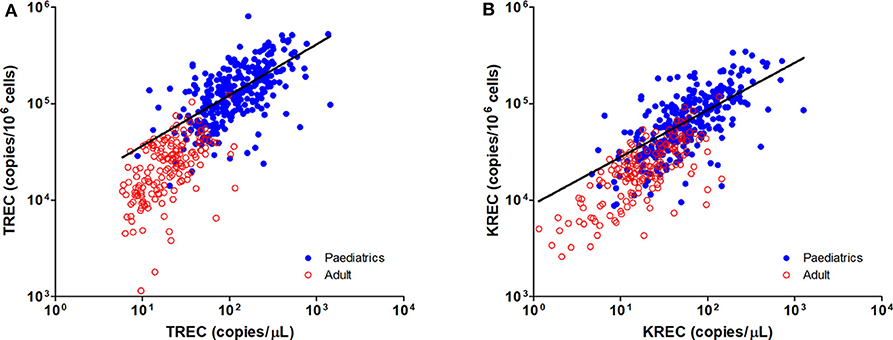
Figure 4. Dot Plot showing the correlations between copies/μL blood and copies/106 cells for TREC (A) and KREC (B) levels. Blue full circles represent healthy pediatric individuals and red empty circles represent healthy adults. A significant positive correlation was observed between both units for TREC and KREC levels (TREC level: r = 0.8319, p < 0.0001; KREC level: r = 0.7794, p < 0.0001).
Reference Intervals of Healthy Individuals for Different Age Group
To establish reference intervals for TREC and KREC levels in the Hong Kong Chinese population, subjects were divided into 10 different age groups (5 groups for pediatric age and 5 groups for adults) and reference intervals were expressed as median and 5th–95th percentile range (Table 3). The lower threshold (5th percentile) of reference ranges for TREC (copies/μL blood and copies/106 cells) in pediatric age groups were 223 and 151,107 (<1 year), 74 and 66,845 (1–4 years), 53 and 58,281 (5–8 years), 30 and 38,206 (9–12 years), 21 and 27,173 (13–18 year); and in adult groups were 12 and 20,831 (19–30 years), 10 and 8,436 (31–40 years), 7 and 6,644 (41–50 years), 0 and 0 (51–60 year), and 0 and 0 (>61 years). The lower threshold (5th percentile) of reference ranges for KREC (copies/μL blood and copies/106 cells) in pediatric age groups were 134 and 115,946 (<1 year), 31 and 35,491 (1–4 years), 21 and 29,471 (5–8 years), 16 and 25,425 (9–12 years), 8 and 11,684 (13–18 years); and in adult groups were 1 and 3,063 (19–30 years), 2 and 6,098 (31–40 years), 4 and 7,363 (41–50 years), 3 and 5,566 (51–60 years) and 1 and 2,907 (>61 years).
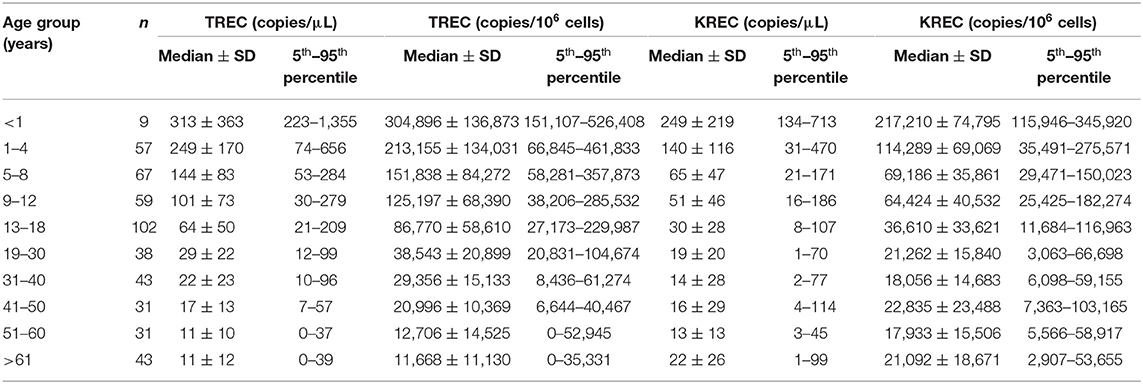
Table 3. Reference intervals of TREC and KREC in different age groups.
Validation of Assay With Reference DBS Specimens
DNA from the 21 reference DBS specimens were eluted and tested using the TREC and KREC assays (Table 4). “Expected” TREC levels of the reference samples measured using an in-house RT-PCR TREC assay were provided by Dr. Francis Lee, CDC, US. Beta-actin (internal control) was detected in all DBS specimens except the negative control that was prepared from leukocyte-depleted blood and served as a negative control. Out of the 15 DBS specimens prepared from normal cord blood (within TREC reference range), we detected positive TREC levels ranging from 144 to 514 copies/μL blood. For the five SCID-like DBS samples prepared from PBMC-depleted blood, TREC levels were all below the detection limit. These results were in concordance with the expected results, and the TREC levels measured using our assay were highly correlated with those measured by the CDC (Supplementary Figure 1). On the other hand, there was no reference KREC samples available, no comparison could be done.
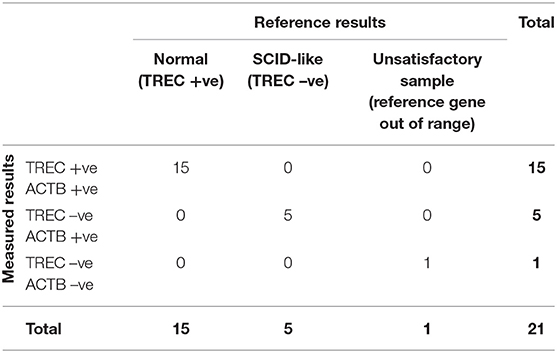
Table 4. Comparison of TREC results with reference DBS specimens.
Use of TREC and KREC Assays in PIDD Patients
Blood samples from patients diagnosed with PIDD were tested with the TREC and KREC assays and compared with their age-matched reference intervals. The results and genetic diagnosis of the patients are listed in Table 5. Patient P1 presented with recurrent infections as well as low CD4+ T cell and CD19+ B cell counts. The patient was diagnosed with compound heterozygous mutations in RAG1 and both TREC and KREC levels were very low or undetectable. Patient P2 has a history of severe chest infection, profound T cell lymphopenia and borderline low B cell count. The patient was diagnosed with compound heterozygous mutations in IL7RA and Diffuse Large B cell Lymphoma (DLBCL). The patient had much lower TREC and KREC levels than the age-matched reference intervals. Patients P3, P4, and P5 were classical T−B+NK+ X-linked SCID patients with IL2RG defects. They all had undetectable TREC which was in agreement with their low T cell counts. Patient P5 had lower KREC level which could be explained by the low B cell count. Patient P6 was diagnosed with partial DGS, and had low TREC and normal KREC levels compared with the corresponding age group. Patient P7 was diagnosed with APDS, and had both lower TREC and KREC levels compared with the age-matched reference interval which were in concordance with the low T and B cells counts. Patients P8 and P9 were both diagnosed with XLA and had defects in BTK gene. Patient P10 had agammaglobulinemia phenotype with unknown genetic cause as found by Whole Exome Sequencing while patient P11 was diagnosed with GATA2 deficiency. Patients P8, P9, P10, and P11 were T+B− PIDD and they all had normal TREC but very low KREC levels. Patient P12 was diagnosed with HIGM and the TREC and KREC levels were normal which were consistent with normal T and B cell counts. The 5th percentile lower thresholds of TREC and KREC were able to detect severe and mild abnormalities in the thymic function and B cell neogenesis in these patients.
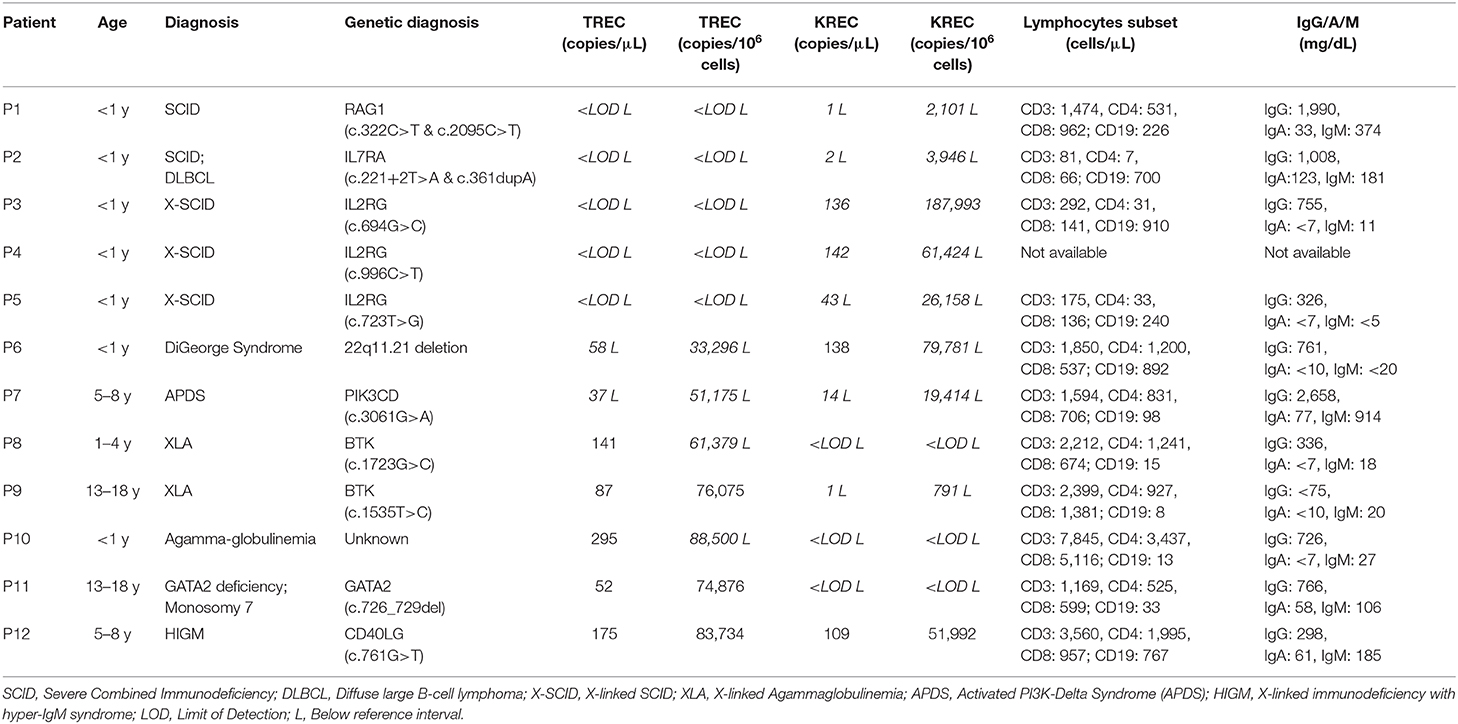
Table 5. Results of TREC and KREC levels in patients with primary immunodeficiency diseases.
Discussion
To the best of our knowledge, this is the first and largest study to determine TREC and KREC reference levels in healthy Chinese pediatric and adult individuals. A total of 479 healthy individuals were divided into 10 different age groups for calculating the age-specific reference intervals, with the lower threshold defined as the 5th percentile. The pediatrics age ranges were selected with reference to previous studies (26, 27). We also determined the reference intervals for adults in age groups between 19 and 74 years for the potential applications in thymic and/or bone marrow output monitoring for post-HSCT patients and HIV patients.
We and other groups have observed a significant inverse correlation of TREC levels with increasing age (28–31). A greater downward trend was observed in the pediatric group than in adults, which is in agreement with other studies (28, 32). We detected the highest TREC and KREC levels in infants <1 year old (33, 34), which may be explained by the continual thymic development in the first year of life (35, 36). We found the TREC levels decreased with age, which is suggested to be related to thymic involution (37), and lower TREC and KREC levels result from dilution during homeostatic replication of T or B memory cells or antigen-induced proliferation (9, 38). In contrast to the steady decline of TREC levels in the adult age group, KREC levels remained at a relatively stable level indicating sustainable B cell neogenesis throughout life, which was in agreement with the findings reported previously (26, 39). The rapid decline of TREC and KREC levels in pediatrics emphasized the importance of establishing the age-specific reference intervals for PIDD diagnosis as the patients occurred mainly in this age range (16, 25).
Our findings showed no significant differences in TREC levels between females and males, regardless of age, which echoed some studies that also found no differences between genders (32, 40, 41). However, several studies observed a higher TREC level in female adolescents and a slower decline of TREC levels in adult females compared to males (26, 28, 42), and Rechavi et al. reported a higher TREC level in female neonates than in male neonates (43). Interestingly, we observed a significantly higher level of KREC in females than males after 9–12 years (except for the 51–60 year age group), indicating a slower decline in KREC levels. This may be explained by the substantial immunomodulatory role of sex hormones on immune responses (44, 45). However, differences in the genetic backgrounds of ethnic groups may contribute to the contradictory findings. A larger sample size of infant healthy controls (<1 year) is needed to elucidate differences in TREC and KREC levels taking into account these factors. Moreover, TREC levels are maintained at very low levels or even undetectable in older age due to physiological decline of thymic function in the fifth and sixth decades of life, which might suggest that this assay is not suitable for adults over 50 years.
The diagnosis of PIDD is usually delayed until presentation of clinical symptoms, such as recurrent infections. The conventional tests for diagnosis of PIDD include total lymphocyte count, lymphocyte subset, immunoglobulin measurement, functional assays, and genetic analysis. The latter two remain the most important tests and are critical for diagnosis. TREC and KREC analysis is a fast, cost-effective and sensitive tool to for SCID screening and PIDD diagnosis, especially as only a small sample volume is needed for DNA extraction which minimizes harm to young age infants. It may not be feasible to perform all the conventional tests if sufficient blood is not available. The protocols of TREC and KREC assay varies in laboratories, and the genetic difference in populations may also contribute to the variation of cut-off in NBS programs in different countries. Therefore, the age- and ethnicity-matched TREC and KREC reference intervals reported in this study are crucial for the diagnosis of PIDD in young children and adolescents in the local population. Nevertheless, PIDD is a rare disease with around 140 cases diagnosed in Hong Kong in the past 30 years (46–48). Implementation of TREC (and KREC) based NBS program with local cut-off can greatly facilitate the early identification of severe PIDD patients. A quicker diagnosis allows earlier genotype-specific treatments (e.g., HSCT) prior to life-threatening infections, which offers a better outcome and improves the quality of life (49–51). This will also significantly reduce the costs of delayed diagnosis and treatment of related morbidities (52–54). We have shown a good correlation between the TREC results using our established assay with the CDC in-house method, indicating this assay is potentially applicable for the NBS program for severe PIDD.
Our TREC and KREC assay was able to correctly identify the 11 selected PIDD patients with aberrant T and/or B cell counts. The findings for SCID (RAG1 and IL2RG), XLA and GATA2 deficiency are in agreement with previous reports (55–59). Typical defect in IL7RA results in a phenotype of T−B+NK+. However, the patient P2 in this study has concomitant EBV associated DLBCL. This might explain the low KREC level even the patient had a CD19 count of 600/μL and the circulating B cells might be dominated by the monoclonal expansion of cancer cells. Borte et al. also reported that patients with IL7RA defects could have variable KREC levels with the lowest level at ~10 copies/μL (55). Recent pilot KREC NBS studies and our study have demonstrated the feasibility in detecting XLA and agammaglobulinemia (6, 60, 61). The identification of DGS has been challenging as the phenotypes vary from “partial” to “complete” reduction of thymus. Fronkova et al. reported that DGS patients had significantly lower TREC levels compared with controls, whereas TREC and KREC levels in most patients were within normal ranges (62). In our study, we detected a low TREC level and normal KREC level in a partial DGS patient compared with their age-matched 5th percentile reference interval. Gul et al. and Liao et al. also found their DGS patients had TREC levels below the 5th percentile and <90 copies, respectively (63, 64). Moreover, our assay was able to detect APDS caused by gain of function in PIK3CD which is a common variable immunodeficiency (CVID) with low TREC and KREC levels (65). As expected, HIGM patient with CD40LG defect has TREC and KREC levels within normal ranges (55). The application of 5th percentile for TREC and KREC levels as the lower cut-off allows the detection of milder forms of T and B cells lymphopenia in PIDD diagnosis. Therefore, TREC and KREC assay is a valuable tool to facilitate the diagnosis of PIDD, in combination with other laboratory tests, such as lymphocyte subset and immunoglobulin measurement.
Since the first use of TREC level in determining thymic output by Douek et al., the units of measurement for TREC level have varied, including TREC/μg DNA of T cells, TREC/CD45RA+ T cell, TREC/105 CD4+ T cells, TREC/106 PBMCs, and TREC/mL or μL of blood (19, 28, 66). In this study, we measured the TREC, KREC, and β-actin (internal control) copy number using a multiplex RT-PCR assay and presented the TREC and KREC levels using two methods. We first aligned the formula used for the NBS program and expressed the levels in copies/μL blood (18, 19, 67). The TREC and KREC levels were then normalized with β-actin to calculate the levels in copies/106 cells (26). We showed a high correlation between the two units for both TREC and KREC levels. These calculation approaches avoided the need for flow cytometry to estimate the numbers of T cells or differential WBC counts, as the values may not be always available. The TREC and KREC levels in copies/μL of blood is suggested to be a better estimation of new lymphocyte maturation regardless of homeostatic cell replication (67). However, patients with lymphopenia due to immunosuppressive treatments may show “false positives” of low TREC and KREC copies per blood volume (6). In addition, patients with high T cells lymphoproliferation or monoclonal B cells proliferation may produce low TREC or KREC levels due to dilution in maturing cells (68). The TREC and KREC levels in copies/106 cells were normalized with the cell number in blood, which provides a more accurate evaluation of T and B cell function in such cases. However, elevated neutrophil numbers (e.g., during infection) may lead to under-estimation of TREC and KREC levels when using copies/106 cells. Therefore, TREC and KREC levels measured in both units should be interpreted with care and other clinical information should be reviewed. Quantification of TREC levels can reflect the thymic output, as it is present in new and recent maturing lymphocytes, but low levels of TREC can still remain in some long-lived naïve cells, which can lead to over-estimation in the results (5, 69, 70).
Multiple methods have been applied for the quantitative measurement of TREC and/or KREC including RT-PCR, which is one of the most commonly used and cost-effective technologies (55). The introduction of KREC measurement offers an additional tool for detecting B cell lymphopenia. On the other hand, multiplex TREC, KREC and internal control in a single reaction using RT-PCR eliminates the variability associated with pipetting errors and allows accurate evaluation of TREC and KREC levels in a cost-effective manner (71). Pilot NBS study using TREC and KREC has also demonstrated improved diagnostic rates for severe PIDD (6, 60). Recent developments have also included the detection of exon 7 of SMN1 in a single reaction for the diagnostic testing of Spinal Muscular Atrophy (72–74). The use of digital PCR technology offers even better limits of detection and higher precision, which is particularly useful for samples with low copy numbers to help reduce the false positive rate (75–77). However, the drawback is the higher instrument costs (91, 93). Measurement of donor cell engraftment using chimerism analysis is a standard tool to determine immunity reconstitution (61). The TREC and KREC assay has been applied in post-HSCT monitoring of functional reconstitution of T and B cells (78, 79). The results obtained in this study could serve as age-matched reference intervals for the comparison of adult patients. Further study with more clinical samples for such applications is ongoing.
The findings in this study need to be interpreted with the following caveats. First, the number of archived samples for healthy infants (<1 year) was limited, which constitutes the major drawback of this study. This may be overcome by recruitment of more healthy subjects. This study also lacked adult PIDD samples for the evaluation of reference intervals in certain adult age groups. An international quality assurance program is available only for TREC measurements, thus an equivalent program for KREC measurements is warranted for standardizing assay performance across different laboratories (80).
Conclusion
To the best of our knowledge, we are first to report reference intervals of TREC and KREC levels from the largest sample size of healthy individuals in a Chinese population. Our study demonstrated that TREC and KREC levels decline with age, which is an important factor for the accurate measurement of TREC and KREC levels. This study generated age-matched reference values that allow us to interpret and compare results in samples of children, adolescents, and adults with suspected compromised immunity. The quantification of TREC and KREC levels simultaneously obtained by RT-PCR can be easily introduced into routine laboratory practice and is highly informative. PIDD including SCID, X-SCID, XLA, partial DGS, GATA2 deficiency, and APDS were successfully diagnosed using this assay. This assay is fast and cost-effective and the established age-specific reference intervals can be applied as a diagnostic tool for PIDD.
Data Availability Statement
All datasets presented in this study are included in the article/Supplementary Material.
Ethics Statement
The studies involving human participants were reviewed and approved by Institutional Review Board of the University of Hong Kong/Hospital Authority Hong Kong West Cluster (HKU/HA HKW IRB). Written, informed consent was obtained from the individuals and/or minors' legal guardian/next of kin for the publication of any potentially identifiable images or data included in this article.
Author Contributions
The study was designed by JK, JH, SC, and PL. The TREC/KREC assays were developed by JH, SC, and IT. The samples were provided by PL, YL, DC, and VL. The TREC/KREC assays were performed by IT, PC, and EL. Data were collated by JH, SC, EL, and JK and analyzed by SC and JK. Statistical analyses were carried out by SC, EL, and JK. The manuscript was written by SC, PI, YL, and JK. The final manuscript was reviewed by all authors.
Funding
This work was supported by the Transplant Training and Research Assistance Scheme (TTRAS), Queen Mary Hospital, Hong Kong.
Conflict of Interest
The authors declare that the research was conducted in the absence of any commercial or financial relationships that could be construed as a potential conflict of interest.
The handling editor declared a past co-authorship with one of the authors YL.
Acknowledgments
The authors would like to thank Dr. Alessandra Sottini for providing the TREC plasmid construct used in this study. The authors would also like to thank Dr. Francis Lee for providing the dried blood spot reference samples for validation of the assay.
Supplementary Material
The Supplementary Material for this article can be found online at: https://www.frontiersin.org/articles/10.3389/fimmu.2020.01411/full#supplementary-material
Supplementary Figure 1. Dot Plot comparing the TREC copies/μL blood from measured results and expected results provided by the CDC for reference DBS specimens. A significant and strong positive correlation was observed between both methods (r = 0. 9176, p < 0.0001).
References
1. Jung D, Alt FW. Unraveling V(D)J recombination; insights into gene regulation. Cell. (2004) 116:299–311. doi: 10.1016/S0092-8674(04)00039-X
2. Livak F, Schatz DG. Identification of V(D)J recombination coding end intermediates in normal thymocytes. J Mol Biol. (1997) 267:1–9. doi: 10.1006/jmbi.1996.0834
3. Takeshita S, Toda M, Yamagishi H. Excision products of the T cell receptor gene support a progressive rearrangement model of the alpha/delta locus. EMBO J. (1989) 8:3261–70. doi: 10.1002/j.1460-2075.1989.tb08486.x
4. Ye P, Kirschner DE. Reevaluation of T cell receptor excision circles as a measure of human recent thymic emigrants. J Immunol. (2002) 168:4968–79. doi: 10.4049/jimmunol.168.10.4968
5. Hazenberg MD, Verschuren MC, Hamann D, Miedema F, van Dongen JJ. T cell receptor excision circles as markers for recent thymic emigrants: basic aspects, technical approach, and guidelines for interpretation. J Mol Med. (2001) 79:631–40. doi: 10.1007/s001090100271
6. Barbaro M, Ohlsson A, Borte S, Jonsson S, Zetterstrom RH, King J, et al. Newborn screening for severe primary immunodeficiency diseases in Sweden-a 2-year pilot TREC and KREC screening study. J Clin Immunol. (2017) 37:51–60. doi: 10.1007/s10875-016-0347-5
7. Siminovitch KA, Bakhshi A, Goldman P, Korsmeyer SJ. A uniform deleting element mediates the loss of kappa genes in human B cells. Nature. (1985) 316:260–2. doi: 10.1038/316260a0
8. van Zelm MC, van der Burg M, Langerak AW, van Dongen JJ. PID comes full circle: applications of V(D)J recombination excision circles in research, diagnostics and newborn screening of primary immunodeficiency disorders. Front Immunol. (2011) 2:12. doi: 10.3389/fimmu.2011.00012
9. van Zelm MC, Szczepanski T, van der Burg M, van Dongen JJ. Replication history of B lymphocytes reveals homeostatic proliferation and extensive antigen-induced B cell expansion. J Exp Med. (2007) 204:645–55. doi: 10.1084/jem.20060964
10. Kong FK, Chen CL, Six A, Hockett RD, Cooper MD. T cell receptor gene deletion circles identify recent thymic emigrants in the peripheral T cell pool. Proc Natl Acad Sci USA. (1999) 96:1536–40. doi: 10.1073/pnas.96.4.1536
11. Livak F, Schatz DG. T-cell receptor alpha locus V(D)J recombination by-products are abundant in thymocytes and mature T cells. Mol Cell Biol. (1996) 16:609–18. doi: 10.1128/MCB.16.2.609
12. Tangye SG, Al-Herz W, Bousfiha A, Chatila T, Cunningham-Rundles C, Etzioni A, et al. Human inborn errors of immunity: 2019 update on the classification from the international union of immunological societies expert committee. J Clin Immunol. (2020) 40:24–64. doi: 10.1007/s10875-020-00763-0
13. Rubin Z, Pappalardo A, Schwartz A, Antoon JW. Prevalence and outcomes of primary immunodeficiency in hospitalized children in the United States. J Allergy Clin Immunol Pract. (2018) 6:1705–10.e1. doi: 10.1016/j.jaip.2017.12.002
14. Modell V, Knaus M, Modell F, Roifman C, Orange J, Notarangelo LD, et al. Global overview of primary immunodeficiencies: a report from Jeffrey Modell Centers worldwide focused on diagnosis, treatment, and discovery. Immunol Res. (2014) 60:132–44. doi: 10.1007/s12026-014-8498-z
15. Lee PP, Lau YL. Improving care, education, and research: the Asian primary immunodeficiency network. Ann NY Acad Sci. (2011) 1238:33–41. doi: 10.1111/j.1749-6632.2011.06225.x
16. Lee PP, Lau YL. Primary immunodeficiencies: “new” disease in an old country. Cell Mol Immunol. (2009) 6:397–406. doi: 10.1038/cmi.2009.51
17. Reust CE. Evaluation of primary immunodeficiency disease in children. Am Fam Physician. (2013) 87:773–8.
18. Chan K, Puck JM. Development of population-based newborn screening for severe combined immunodeficiency. J Allergy Clin Immunol. (2005) 115:391–8. doi: 10.1016/j.jaci.2004.10.012
19. van der Spek J, Groenwold RH, van der Burg M, van Montfrans JM. TREC based newborn screening for severe combined immunodeficiency disease: a systematic review. J Clin Immunol. (2015) 35:416–30. doi: 10.1007/s10875-015-0152-6
20. van der Burg M, Mahlaoui N, Gaspar HB, Pai SY. Universal newborn screening for severe combined immunodeficiency (SCID). Front Pediatr. (2019) 7:373. doi: 10.3389/fped.2019.00373
21. Olbrich P, de Felipe B, Delgado-Pecellin C, Rodero R, Rojas P, Aguayo J, et al. A first pilot study on the neonatal screening of primary immunodeficiencies in Spain: TRECS and KRECS identify severe T- and B-cell lymphopenia. Pediatr. (2014) 81:310–7. doi: 10.1016/j.anpede.2014.08.003
22. Al-Mousa H, Al-Dakheel G, Jabr A, Elbadaoui F, Abouelhoda M, Baig M, et al. High incidence of severe combined immunodeficiency disease in Saudi Arabia detected through combined t cell receptor excision circle and next generation sequencing of newborn dried blood spots. Front Immunol. (2018) 9:782. doi: 10.3389/fimmu.2018.00782
23. Palmer S, Albergante L, Blackburn CC, Newman TJ. Thymic involution and rising disease incidence with age. Proc Natl Acad Sci USA. (2018) 115:1883–8. doi: 10.1073/pnas.1714478115
24. Sempowski GD, Gooding ME, Liao HX, Le PT, Haynes BF. T cell receptor excision circle assessment of thymopoiesis in aging mice. Mol Immunol. (2002) 38:841–8. doi: 10.1016/S0161-5890(01)00122-5
25. McCusker C, Upton J, Warrington R. Primary immunodeficiency. Allergy Asthma Clin Immunol. (2018) 14(Suppl 2):61. doi: 10.1186/s13223-018-0290-5
26. Sottini A, Serana F, Bertoli D, Chiarini M, Valotti M, Vaglio Tessitore M, et al. Simultaneous quantification of T-cell receptor excision circles (TRECs) and K-deleting recombination excision circles (KRECs) by real-time PCR. J Vis Exp. (2014) 52184. doi: 10.3791/52184
27. Atschekzei F, Ahmad F, Witte T, Jacobs R, Schmidt RE. Limitation of simultaneous analysis of t-cell receptor and kappa-deleting recombination excision circles based on multiplex real-time polymerase chain reaction in common variable immunodeficiency patients. Int Arch Allergy Immunol. (2016) 171:136–40. doi: 10.1159/000450950
28. Douek DC, McFarland RD, Keiser PH, Gage EA, Massey JM, Haynes BF, et al. Changes in thymic function with age and during the treatment of HIV infection. Nature. (1998) 396:690–5. doi: 10.1038/25374
29. Chen X, Barfield R, Benaim E, Leung W, Knowles J, Lawrence D, et al. Prediction of T-cell reconstitution by assessment of T-cell receptor excision circle before allogeneic hematopoietic stem cell transplantation in pediatric patients. Blood. (2005) 105:886–93. doi: 10.1182/blood-2004-04-1405
30. Steffens CM, Al-Harthi L, Shott S, Yogev R, Landay A. Evaluation of thymopoiesis using T cell receptor excision circles (TRECs): differential correlation between adult and pediatric TRECs and naive phenotypes. Clin Immunol. (2000) 97:95–101. doi: 10.1006/clim.2000.4938
31. Naylor K, Li G, Vallejo AN, Lee WW, Koetz K, Bryl E, et al. The influence of age on T cell generation and TCR diversity. J Immunol. (2005) 174:7446–52. doi: 10.4049/jimmunol.174.11.7446
32. Zhang L, Lewin SR, Markowitz M, Lin HH, Skulsky E, Karanicolas R, et al. Measuring recent thymic emigrants in blood of normal and HIV-1-infected individuals before and after effective therapy. J Exp Med. (1999) 190:725–32. doi: 10.1084/jem.190.5.725
33. Morinishi Y, Imai K, Nakagawa N, Sato H, Horiuchi K, Ohtsuka Y, et al. Identification of severe combined immunodeficiency by T-cell receptor excision circles quantification using neonatal guthrie cards. J Pediatr. (2009) 155:829–33. doi: 10.1016/j.jpeds.2009.05.026
34. Kamae C, Nakagawa N, Sato H, Honma K, Mitsuiki N, Ohara O, et al. Common variable immunodeficiency classification by quantifying T-cell receptor and immunoglobulin kappa-deleting recombination excision circles. J Allergy Clin Immunol. (2013) 131:1437–40 e5. doi: 10.1016/j.jaci.2012.10.059
35. Hasselbalch H, Jeppesen DL, Ersboll AK, Engelmann MD, Nielsen MB. Thymus size evaluated by sonography. a longitudinal study on infants during the first year of life. Acta Radiol. (1997) 38:222–7. doi: 10.1080/02841859709172053
36. Yekeler E, Tambag A, Tunaci A, Genchellac H, Dursun M, Gokcay G, et al. Analysis of the thymus in 151 healthy infants from 0 to 2 years of age. J Ultrasound Med. (2004) 23:1321–6. doi: 10.7863/jum.2004.23.10.1321
37. Lynch HE, Goldberg GL, Chidgey A, Van den Brink MR, Boyd R, Sempowski GD, et al. Thymic involution and immune reconstitution. Trends Immunol. (2009) 30:366–73. doi: 10.1016/j.it.2009.04.003
38. Verstegen RHJ, Aui PM, Watson E, De Jong S, Bartol SJW, Bosco JJ, et al. Quantification of T-Cell and B-cell replication history in aging, immunodeficiency, and newborn screening. Front Immunol. (2019) 10:2084. doi: 10.3389/fimmu.2019.02084
39. Shakerian L, Pourpak Z, Shamlou S, Domsgen E, Kazemnejad A, Dalili H, et al. Determining laboratory reference values of TREC and KREC in different age groups of iranian healthy individuals. Iran J Allergy Asthma Immunol. (2019) 18:143–52. doi: 10.18502/ijaai.v18i2.917
40. Arismendi MI, Kallas EG, Santos BA, Carneiro-Sampaio MM, Kayser C. Thymopoiesis and regulatory T cells in healthy children and adolescents. Clinics. (2012) 67:425–9. doi: 10.6061/clinics/2012(05)04
41. Geenen V, Poulin JF, Dion ML, Martens H, Castermans E, Hansenne I, et al. Quantification of T cell receptor rearrangement excision circles to estimate thymic function: an important new tool for endocrine-immune physiology. J Endocrinol. (2003) 176:305–11. doi: 10.1677/joe.0.1760305
42. Pido-Lopez J, Imami N, Aspinall R. Both age and gender affect thymic output: more recent thymic migrants in females than males as they age. Clin Exp Immunol. (2001) 125:409–13. doi: 10.1046/j.1365-2249.2001.01640.x
43. Rechavi E, Lev A, Simon AJ, Stauber T, Daas S, Saraf-Levy T, et al. First year of israeli newborn screening for severe combined immunodeficiency-clinical achievements and insights. Front Immunol. (2017) 8:1448. doi: 10.3389/fimmu.2017.01448
44. Giefing-Kroll C, Berger P, Lepperdinger G, Grubeck-Loebenstein B. How sex and age affect immune responses, susceptibility to infections, and response to vaccination. Aging Cell. (2015) 14:309–21. doi: 10.1111/acel.12326
45. Klein SL, Flanagan KL. Sex differences in immune responses. Nat Rev Immunol. (2016) 16:626–38. doi: 10.1038/nri.2016.90
46. Leung D, Lee PPW, Lau YL. Review of a decade of international experiences in severe combined immunodeficiency newborn screening using t-cell receptor excision circle. HK J Paediatr. (2020) 25:30–41.
47. Luk ADW, Lee PP, Mao H, Chan KW, Chen XY, Chen TX, et al. Family History of early infant death correlates with earlier age at diagnosis but not shorter time to diagnosis for severe combined immunodeficiency. Front Immunol. (2017) 8:808. doi: 10.3389/fimmu.2017.00808.eCollection2017
48. Lee PP, Chan KW, Chen TX, Jiang LP, Wang XC, Zeng HS, et al. Molecular diagnosis of severe combined immunodeficiency–identification of IL2RG, JAK3, IL7R, DCLRE1C, RAG1, and RAG2 mutations in a cohort of Chinese and Southeast Asian children. J Clin Immunol. (2011) 31:281–96. doi: 10.1007/s10875-010-9489-z
49. Buckley RH, Schiff SE, Schiff RI, Markert L, Williams LW, Roberts JL, et al. Hematopoietic stem-cell transplantation for the treatment of severe combined immunodeficiency. N Engl J Med. (1999) 340:508–16. doi: 10.1056/NEJM199902183400703
50. Castagnoli R, Delmonte OM, Calzoni E, Notarangelo LD. Hematopoietic stem cell transplantation in primary immunodeficiency diseases: current status and future perspectives. Front Pediatr. (2019) 7:295. doi: 10.3389/fped.2019.00295
51. Pai SY, Logan BR, Griffith LM, Buckley RH, Parrott RE, Dvorak CC, et al. Transplantation outcomes for severe combined immunodeficiency, 2000-2009. N Engl J Med. (2014) 371:434–46. doi: 10.1056/NEJMoa1401177
52. Gardulf A, Winiarski J, Thorin M, Heibert Arnlind M, von Dobeln U, Hammarstrom L, et al. Costs associated with treatment of severe combined immunodeficiency-rationale for newborn screening in Sweden. J Allergy Clin Immunol. (2017) 139:1713–6 e6. doi: 10.1016/j.jaci.2016.10.043
53. Bessey A, Chilcott J, Leaviss J, de la Cruz C, Wong R. A cost-effectiveness analysis of newborn screening for severe combined immunodeficiency in the UK. Int J Neonat Screen. (2019) 5:28. doi: 10.3390/ijns5030028
54. Thomas C, Durand-Zaleski I, Frenkiel J, Mirallie S, Leger A, Cheillan D, et al. Clinical and economic aspects of newborn screening for severe combined immunodeficiency: DEPISTREC study results. Clin Immunol. (2019) 202:33–9. doi: 10.1016/j.clim.2019.03.012
55. Borte S, von Dobeln U, Fasth A, Wang N, Janzi M, Winiarski J, et al. Neonatal screening for severe primary immunodeficiency diseases using high-throughput triplex real-time PCR. Blood. (2012) 119:2552–5. doi: 10.1182/blood-2011-08-371021
56. de Felipe B, Olbrich P, Lucenas JM, Delgado-Pecellin C, Pavon-Delgado A, Marquez J, et al. Prospective neonatal screening for severe T- and B-lymphocyte deficiencies in Seville. Pediatr Allergy Immunol. (2016) 27:70–7. doi: 10.1111/pai.12501
57. Serana F, Chiarini M, Zanotti C, Sottini A, Bertoli D, Bosio A, et al. Use of V(D)J recombination excision circles to identify T- and B-cell defects and to monitor the treatment in primary and acquired immunodeficiencies. J Transl Med. (2013) 11:119. doi: 10.1186/1479-5876-11-119
58. Novakova M, Zaliova M, Sukova M, Wlodarski M, Janda A, Fronkova E, et al. Loss of B cells and their precursors is the most constant feature of GATA-2 deficiency in childhood myelodysplastic syndrome. Haematologica. (2016) 101:707–16. doi: 10.3324/haematol.2015.137711
59. Borte S, Wang N, Oskarsdottir S, von Dobeln U, Hammarstrom L. Newborn screening for primary immunodeficiencies: beyond SCID and XLA. Ann NY Acad Sci. (2011) 1246:118–30. doi: 10.1111/j.1749-6632.2011.06350.x
60. Wakamatsu M, Muramatsu H, Kataoka S, Okuno Y, Yoshimi S, Nakajima Y, et al. Utility of newborn screening for severe combined immunodeficiency and X-Linked agammaglobulinemia using TREC and KREC assays. Blood. (2019) 134:3604. doi: 10.1182/blood-2019-126669
61. Khan F, Agarwal A, Agrawal S. Significance of chimerism in hematopoietic stem cell transplantation: new variations on an old theme. Bone Marrow Transplant. (2004) 34:1–12. doi: 10.1038/sj.bmt.1704525
62. Fronkova E, Klocperk A, Svaton M, Novakova M, Kotrova M, Kayserova J, et al. The TREC/KREC assay for the diagnosis and monitoring of patients with DiGeorge syndrome. PLoS ONE. (2014) 9:e114514. doi: 10.1371/journal.pone.0114514
63. Gul KA, Overland T, Osnes L, Baumbusch LO, Pettersen RD, Lima K, et al. Neonatal levels of T-cell Receptor Excision Circles (TREC) in patients with 22q11.2 deletion syndrome and later disease features. J Clin Immunol. (2015) 35:408–15. doi: 10.1007/s10875-015-0153-5
64. Liao HC, Liao CH, Kao SM, Chiang CC, Chen YJ. Detecting 22q11.2 deletion syndrome in newborns with low t cell receptor excision circles from severe combined immunodeficiency screening. J Pediatr. (2019) 204:219–24 e1. doi: 10.1016/j.jpeds.2018.08.072
65. Tsujita Y, Mitsui-Sekinaka K, Imai K, Yeh TW, Mitsuiki N, Asano T, et al. Phosphatase and tensin homolog (PTEN) mutation can cause activated phosphatidylinositol 3-kinase delta syndrome-like immunodeficiency. J Allergy Clin Immunol. (2016) 138:1672–80 e10. doi: 10.1016/j.jaci.2016.03.055
66. King JR, Hammarstrom L. Newborn screening for primary immunodeficiency diseases: history, current and future practice. J Clin Immunol. (2018) 38:56–66. doi: 10.1007/s10875-017-0455-x
67. Lorenzi AR, Patterson AM, Pratt A, Jefferson M, Chapman CE, Ponchel F, et al. Determination of thymic function directly from peripheral blood: a validated modification to an established method. J Immunol Methods. (2008) 339:185–94. doi: 10.1016/j.jim.2008.09.013
68. Ye P, Kirschner DE. Measuring emigration of human thymocytes by T-cell receptor excision circles. Crit Rev Immunol. (2002) 22:483–97. doi: 10.1615/CritRevImmunol.v22.i5-6.80
69. Hazenberg MD, Otto SA, Cohen Stuart JW, Verschuren MC, Borleffs JC, Boucher CA, et al. Increased cell division but not thymic dysfunction rapidly affects the T-cell receptor excision circle content of the naive T cell population in HIV-1 infection. Nat Med. (2000) 6:1036–42. doi: 10.1038/79549
70. De Boer RJ, Perelson AS. Quantifying T lymphocyte turnover. J Theor Biol. (2013) 327:45–87. doi: 10.1016/j.jtbi.2012.12.025
71. Sottini A, Ghidini C, Zanotti C, Chiarini M, Caimi L, Lanfranchi A, et al. Simultaneous quantification of recent thymic T-cell and bone marrow B-cell emigrants in patients with primary immunodeficiency undergone to stem cell transplantation. Clin Immunol. (2010) 136:217–27. doi: 10.1016/j.clim.2010.04.005
72. Prior TW, Snyder PJ, Rink BD, Pearl DK, Pyatt RE, Mihal DC, et al. Newborn and carrier screening for spinal muscular atrophy. Am J Med Genet A. (2010) 152A:1608–16. doi: 10.1002/ajmg.a.33474
73. Taylor JL, Lee FK, Yazdanpanah GK, Staropoli JF, Liu M, Carulli JP, et al. Newborn blood spot screening test using multiplexed real-time PCR to simultaneously screen for spinal muscular atrophy and severe combined immunodeficiency. Clin Chem. (2015) 61:412–9. doi: 10.1373/clinchem.2014.231019
74. Czibere L, Burggraf S, Fleige T, Gluck B, Keitel LM, Landt O, et al. High-throughput genetic newborn screening for spinal muscular atrophy by rapid nucleic acid extraction from dried blood spots and 384-well qPCR. Eur J Hum Genet. (2020) 28:23–30. doi: 10.1038/s41431-019-0476-4
75. Tessitore MV, Sottini A, Roccaro AM, Ghidini C, Bernardi S, Martellosio G, et al. Detection of newly produced T and B lymphocytes by digital PCR in blood stored dry on nylon flocked swabs. J Transl Med. (2017) 15:70. doi: 10.1186/s12967-017-1169-9
76. Vidal-Folch N, Milosevic D, Majumdar R, Gavrilov D, Matern D, Raymond K, et al. A droplet digital pcr method for severe combined immunodeficiency newborn screening. J Mol Diagn. (2017) 19:755–65. doi: 10.1016/j.jmoldx.2017.05.011
77. Profaizer T, Slev P. A multiplex, droplet digital PCR assay for the detection of T-cell receptor excision circles and kappa-deleting recombination excision circles. Clin Chem. (2019) 66:229–38. doi: 10.1373/clinchem.2019.308171
78. Mensen A, Ochs C, Stroux A, Wittenbecher F, Szyska M, Imberti L, et al. Utilization of TREC and KREC quantification for the monitoring of early T- and B-cell neogenesis in adult patients after allogeneic hematopoietic stem cell transplantation. J Transl Med. (2013) 11:188. doi: 10.1186/1479-5876-11-188
79. Gaballa A, Sundin M, Stikvoort A, Abumaree M, Uzunel M, Sairafi D, et al. T Cell Receptor Excision Circle (TREC) monitoring after allogeneic stem cell transplantation; a predictive marker for complications and clinical outcome. Int J Mol Sci. (2016) 17:1705. doi: 10.3390/ijms17101705
Keywords: T cell receptor excision circles, K-deleting recombination excision circles, primary immunodeficiency, immune reconstitution, reference interval
Citation: Kwok JSY, Cheung SKF, Ho JCY, Tang IWH, Chu PWK, Leung EYS, Lee PPW, Cheuk DKL, Lee V, Ip P and Lau YL (2020) Establishing Simultaneous T Cell Receptor Excision Circles (TREC) and K-Deleting Recombination Excision Circles (KREC) Quantification Assays and Laboratory Reference Intervals in Healthy Individuals of Different Age Groups in Hong Kong. Front. Immunol. 11:1411. doi: 10.3389/fimmu.2020.01411
Received: 08 April 2020; Accepted: 02 June 2020;
Published: 16 July 2020.
Edited by:
Antonio Condino-Neto, University of São Paulo, BrazilReviewed by:
Roshini Sarah Abraham, Nationwide Children's Hospital, United StatesAmos Etzioni, University of Haifa, Israel
Copyright © 2020 Kwok, Cheung, Ho, Tang, Chu, Leung, Lee, Cheuk, Lee, Ip and Lau. This is an open-access article distributed under the terms of the Creative Commons Attribution License (CC BY). The use, distribution or reproduction in other forums is permitted, provided the original author(s) and the copyright owner(s) are credited and that the original publication in this journal is cited, in accordance with accepted academic practice. No use, distribution or reproduction is permitted which does not comply with these terms.
*Correspondence: Janette S. Y. Kwok, kwoksy@ha.org.hk