


Abstract
Sedentary behavior is emerging as an independent risk factor for chronic disease and mortality. However, the evidence relating television (TV) viewing and other sedentary behaviors to cancer risk has not been quantitatively summarized.
We performed a comprehensive electronic literature search in Cochrane, EMBASE, Medline, and SciSearch databases through February 2014 for published articles investigating sedentary behavior in relation to cancer incidence. Because randomized controlled trials are difficult to perform on this topic, we focused on observational studies that met uniform inclusion criteria. Data were extracted independently by both authors and summarized using random-effects meta-analysis and meta-regression. All statistical tests were two-sided.
Data from 43 observational studies including a total of 68936 cancer cases were analyzed. Comparing the highest vs lowest levels of sedentary time, the relative risks (RRs) for colon cancer were 1.54 (95% confidence interval [CI] = 1.19 to 1.98) for TV viewing time, 1.24 (95% CI = 1.09 to 1.41) for occupational sitting time, and 1.24 (95% CI = 1.03 to 1.50) for total sitting time. For endometrial cancer, the relative risks were 1.66 (95% CI = 1.21 to 2.28) for TV viewing time and 1.32 (95% CI = 1.08 to 1.61) for total sitting time. A positive association with overall sedentary behavior was also noted for lung cancer (RR = 1.21; 95% CI = 1.03 to 1.43). Sedentary behavior was unrelated to cancers of the breast, rectum, ovaries, prostate, stomach, esophagus, testes, renal cell, and non-Hodgkin lymphoma.
Prolonged TV viewing and time spent in other sedentary pursuits is associated with increased risks of certain types of cancer.
In recent years, increased television (TV) viewing and computer use along with less physically demanding jobs have led people to become more sedentary in their daily routines ( 1 , 2 ). Objectively assessed measures indicate that adults spend 50% to 60% of their day in sedentary behaviors ( 3 ). Sedentary pursuits are undertaken in numerous domains of life, including recreation (eg, TV or video viewing, computer use, reading), occupation (eg, sitting at a desk or a counter), transportation (eg, sitting in a bus, car, or train), and as part of social activities (eg, playing cards, sit-down meals).
Sedentary behavior is emerging as a potential determinant of deleterious health outcomes ( 2 , 4–6 ), of which TV viewing has been the most commonly studied. Prolonged sitting time lowers energy expenditure and displaces time spent in light physical activities, which consequently leads to weight gain over time ( 7 ). Moreover, TV viewing is accompanied by increased consumption of unhealthy foods, such as sugar-sweetened beverages, sweets, and fast food ( 8 ), and it is related to enhanced smoking initiation ( 9 ). Obesity ( 10 ) and smoking ( 11 , 12 ) are associated with increased risk of cancer, whereas physical activity is related to reduced cancer risk ( 13 , 14 ).
To date, 43 epidemiologic studies have examined sedentary behavior in relation to cancer incidence, including cancers of the breast ( 15–26 ), colorectum ( 15 , 27–34 ), endometrium ( 15 , 35–41 ), ovaries ( 15 , 42–45 ), lung ( 15 , 46 , 47 ), prostate ( 15 , 48 , 49 ), stomach ( 15 , 34 , 50 , 51 ), esophagus ( 34 , 50 , 52 ), testes ( 15 , 53 , 54 ), renal cell ( 55 ), and non-Hodgkin lymphoma ( 56 , 57 ). Many ( 30 , 34 , 36–38 , 42 , 44 , 54 ), but not all, of those investigations found an apparent adverse effect of prolonged sitting time on cancer incidence. However, the epidemiologic evidence regarding sedentary behavior in relation to cancer risk has not been quantitatively assessed in a meta-analysis. Thus, we conducted a comprehensive systematic literature review and meta-analysis of published prospective studies of TV viewing time, recreational sitting time, occupational sitting time, and total sitting time in relation to site-specific cancers.
Methods
Literature Search and Inclusion Criteria
This meta-analysis was conducted according to the Preferred Reporting Items for Systematic reviews and Meta-Analyses (PRISMA) guidelines ( 58 ). We conducted a comprehensive literature search of the Cochrane Central Register of Controlled Trials, Cochrane Database of Systematic Reviews, Database of Abstracts of Reviews of Effects, EMBASE, EMBASE Alert, MEDLINE, SciSearch, and Social SciSearch from inception to February 2014 to identify articles evaluating the relations of TV viewing time, recreational sitting time, occupational sitting time, and total sitting time to the incidence of any type of cancer. Our search included the following terms for sedentary behavior: television (viewing, watching, usage, time, consumption), TV (viewing, watching, usage, time, consumption), video/video game (viewing, watching, usage, time, consumption), computer game (viewing, watching, usage, time, consumption), viewing time, screen time, sedentary (job, time, behavior, lifestyle), sitting (time, hours, behavior, occupational, office, prolonged), and physical inactivity. The search included the following terms for cancer: cancer, neoplasm, carcinoma, adenocarcinoma, tumor, leukemia, and lymphoma. We also searched for terms related to physical activity (eg, physical activity, motor activity, exercise) because several investigations of sedentary behavior were conducted within the context of physical activity studies. In addition, we screened references from retrieved original articles to identify further potentially eligible studies.
To be included in our meta-analysis, articles had to meet the following criteria: 1) be an observational human study; 2) investigate the association between TV viewing or other sedentary behavior and cancer incidence of any site; 3) report a relative risk (RR), odds ratio (OR), or standardized incidence ratio (SIR) and 95% confidence interval (CI) or provide sufficient data to calculate them; and 4) take into account age as a potential confounding factor either by statistical adjustment or as a matching factor.
We excluded physical activity studies that used the terms “sedentary” or “sitting” to define the reference level in a range of physical activity categories.
Data Extraction and Quality Assessment
Data were extracted independently by both authors, and any disagreements were resolved by consensus. Extracted data included information on authors, year of publication, country, numbers of participants and incident case patients, sex, type of assessment of sedentary behavior, cancer endpoint, study covariables adjusted for in the multivariable analysis, risk estimates and their 95% confidence intervals, and information needed to evaluate the study quality. If study populations were found to overlap between studies, we included the article with the most comprehensive data. For studies that considered “TV viewing or video watching” as sedentary behavior, we used “TV viewing time” as an umbrella term.
The quality of the studies was assessed using the validated Newcastle-Ottawa Scale for nonrandomized studies ( 59 ). That scale awards a maximum of nine points to each cohort study (four for quality of selection, two for comparability, and three for quality of outcome and adequacy of follow-up) and a score of nine points to each case–control study (four for quality of selection, two for comparability, and three for quality of exposure). We considered studies with scores of less than 6 as low-quality studies and those with scores of 6 or higher as high-quality studies.
Statistical Analysis
We considered risk estimates comparing the highest vs the lowest level of time spent in sedentary behavior in relation to site-specific cancer. If data were available for more than one domain of sedentary behavior in the same article, data for TV viewing time were prioritized. If articles provided risk estimates for women and men separately, we included both risk estimates because they were based on independent samples. Mathew et al. provided separate risk estimates for TV viewing during weekdays and during weekend days in premenopausal and postmenopausal women ( 22 ). Because the variation among the categories of TV viewing was greater during weekend days than weekdays, we pooled the risk estimates of TV viewing during weekend days from premenopausal and postmenopausal women using a random-effects model to obtain a single relative risk from that study. We also pooled the relative risks for pre- and postmenopausal women provided by Lynch et al. to obtain a single risk estimate from that investigation ( 20 ). Our meta-analysis focused on cancer sites for which at least two risk estimates were available and could be pooled.
Obesity is considered a likely intermediate variable in the biologic pathway linking sedentary behavior to cancer. Thus, in the main analysis, we prioritized multivariable-adjusted risk estimates that were unadjusted for body mass index (BMI) or other measures of adiposity. Because physical activity represents a potential confounding factor of the sedentary behavior and cancer relation, we used risk estimates that were adjusted for physical activity when available.
We calculated the natural logarithms of the study-specific relative risks (log(RR i )) with their corresponding standard errors [s i = (log(upper 95% CI bound of RR) − log(RR))/1.96]. Applying a random-effects model, we determined the weighted average of those log(RR i )s while allowing for effect measure heterogeneity. The log(RR i )s were weighted by w i = 1 / (s i2 + t 2 ), where s i represented the standard error of log(RR i ) and t 2 represented the restricted maximum likelihood estimate of the overall variance ( 60 ). Heterogeneity between studies was estimated by the Q and the I2 statistics ( 60 ). Potential publication bias was evaluated using funnel plots, Egger’s regression test ( 61 ), and Begg’s rank correlation test ( 62 ).
For cancers of the breast, colon, and endometrium, we used meta-regression to investigate whether the association between sedentary behavior and cancer varied according to total sitting time, TV viewing time, and occupational sitting time. We also examined whether the association between sedentary behavior and those cancers differed according to study design, sex, number of adjustment factors, adjustment for physical activity, adjustment for adiposity, adjustment for smoking, adjustment for dietary factors, study quality score, study geographic location, number of case patients, and number of study participants.
In a further analysis, we pooled risk estimates related to sedentary behavior and risk of cancer according to 2-hour increments per day of time spent sedentary. We used generalized least squares for trend estimation as described by Orsini et al. ( 63 ). Our dose–response analysis included cancer sites for which at least four risk estimates were available. To pool relative risks, we used the midpoints of the upper and lower boundaries of each category. We set the lowest category (reference category) to 0 hours per day if the lower bound of the lowest category was not provided. If the highest category was open-ended, we applied the range of the preceding category. All statistical analyses were performed using the R-package ‘metafor’( 64 ) and SAS version 9.2 (SAS Institute Inc, Cary, NC). All P values were two-sided and were considered significant at the .05 level.
Results
Identification and Description of Studies
Figure 1 illustrates the flow diagram of the literature search and study selection. We identified 5076 articles in the electronic databases and five articles by manual search. After removal of 2233 articles that were represented in more than one database, we further excluded 2800 studies that were unrelated to sedentary behavior and cancer incidence or that estimated associations using a combination of physical activity and sedentary behavior categories. Forty-three articles, of which 21 were cohort studies ( 16–18 , 21 , 28 , 29 , 32–37 , 42 , 43 , 46–50 , 55 , 56 ) and 22 were case– control studies ( 15 , 19 , 22–27 , 30 , 31 , 38–41 , 44 , 45 , 51–54 , 57 , 65 ) met the inclusion criteria and were included in the meta-analysis.
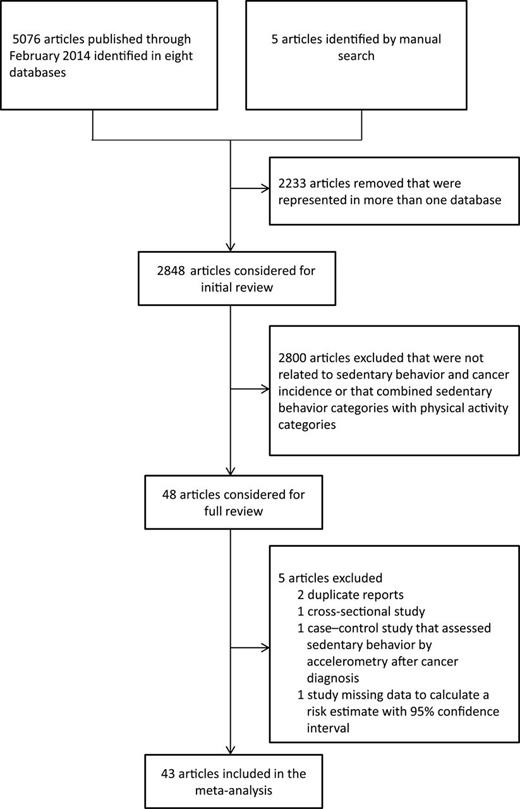
Flow diagram of literature search and study selection.
Descriptive data from studies included in our meta-analysis are shown in Table 1 . A total of 4068437 individuals and 68936 case patients were included in the analysis. Of the 43 included studies, 12 reported on breast cancer, nine reported on colorectal cancer, eight reported on endometrial cancer, five reported on ovarian cancer, three reported on lung cancer, three reported on prostate cancer, four reported on gastric cancer, three reported on esophageal cancer, three reported on testicular cancer, one reported on renal cell cancer, and two reported on non-Hodgkin lymphoma.
Characteristics of the 43 studies included in the meta-analysis*
| Reference, geographic location | Individuals/case patients | Cancer site | RR (95% CI) (highest vs lowest level of sedentary behavior) | Assessment of sedentary behavior | Adjusting variables for models used in the main meta-analysis | NOS points |
|---|---|---|---|---|---|---|
| Cohort studies | ||||||
| Cook et al. ( 50 ), USA | 303033/ 277(GNCA), 255 (GCA), 128 (ESCC), and 377 (EA) | Gastric cancer, esophageal cancer | TV viewing time: >7 vs <1hr/d | Self-administered questionnaire | Age, sex, BMI, education, ethnicity, perceived health status, alcohol consumption, cigarette smoking, fruit consumption, vegetable consumption | 6 |
| GNCA: RR = 0.94 (0.42 to 2.11) | ||||||
| GCA: RR = 1.36 (0.60 to 3.06) | ||||||
| ESCC: RR = 0.78 (0.26 to 2.32) | ||||||
| EA: RR = 0.55 (0.29 to 1.01) | ||||||
| Chow et al. ( 33 ), China | 83202/ 1293 (men) and 936 (women) | Colon cancer | Occupational sitting time: >6hr/d vs <2hr/d of sitting in job | Job titles based on census data and interview | Age-and sex-specific rates | 5 |
| RR (men) = 1.06 (0.98 to 1.16) RR (women) = 1.0 (0.91 to 1.1) | ||||||
| Dirx et al. ( 16 ), The Netherlands | 62537/755 | Breast cancer | Occupational sitting time: 6–8 vs <2hr/d | Occupational history based on self-administered questionnaire | Age, age at menarche, age at menopause, benign breast disease, parity, age at first birth, maternal breast cancer, breast cancer in sister(s), education, height, baseline alcohol, energy intake | 7 |
| RR = 0.83 (0.64 to 1.06) | ||||||
| Friberg et al. ( 36 ), Sweden | 33723/199 | Endometrial cancer | Recreational sitting time: ≥5 vs <5hr/d RR = 1.80 (1.14 to 2.83) | Self-administered questionnaire | Age, parity, history of diabetes, education, total fruit and vegetable intake, leisure-time physical activity, work/occupation, walking/bicycling, household work | 5 |
| Gerhardsson et al. ( 32 ), Sweden | 1223908/5100 (colon cancer) and 4533 (recal cancer) | Colon cancer Rectal cancer | Occupational sitting time: ≥50% vs <20% of sitting time | Job titles based on census data | Age, population density, social class | 6 |
| Colon cancer: RR = 1.30 (1.20 to 1.50) | ||||||
| Rectal cancer: RR = 1.10 (1.00 to 1.20) | ||||||
| George et al. ( 17 ), USA | 97039/2866 | Invasive breast cancer | Total sitting time: ≥9 vs <3hr/d | Self-administered questionnaire | Age, energy intake, recreational moderate to vigorous physical activity, parity or age at first live birth, menopausal hormone therapy use, number of breast biopsies, smoking, alcohol intake, race, education | 6 |
| RR = 1.12 (0.95 to 1.31) | ||||||
| TV or video viewing time: ≥9 vs <3.0hr/d | ||||||
| RR = 1.17 (0.93 to 1.47) | ||||||
| George et al. ( 55 ), USA | 289512 men and women/909 men and 297 women | Renal cell cancer | TV or video viewing time: ≥7 vs <1hr/d | Self-administered questionnaire | Age, race, history of diabetes, smoking, alcohol intake, diet quality, energy intake, recreational moderate to vigorous physical activity, age at live birth/parity (women only) | 6 |
| RR (men) = 0.97 (0.61 to 1.53) | ||||||
| RR (women) = 0.96 (0.51 to 1.82) | ||||||
| Gierach et al. ( 35 ), USA | 70351/649 | Endometrial cancer | Total sitting time: ≥7 vs <3hr/d | Self-administered questionnaire | Age, race, smoking, parity, oral contraceptive use, age at menopause, hormone therapy use (total sitting time: additionally adjusted for physical activity and BMI) | 6 |
| RR = 1.23 (0.96 to 1.57) | ||||||
| TV or video viewing time: ≥7 vs 0hr/d | ||||||
| RR = 1.66 (1.20 to 2.28) | ||||||
| Hildebrand et al. ( 18 ), USA | 73615/4,681 | Breast cancer | Recreational sitting time: ≥6 vs <3hr/d | Self-administered questionnaire | Age, race, education, BMI, weight change, alcohol use, smoking status, postmenopausal hormones use, number of live births, age at first live birth, age at menopause, family history of breast cancer, breast cysts, hysterectomy, oophorectomy, mammogram within last year, MET expenditure from total recreational activities | 7 |
| RR = 1.05 (0.96 to 1.16) | ||||||
| Howard et al. ( 28 ), USA | 488720 men and women/1264 men and 669 women | Colon cancer | Total sitting time: ≥9 vs <3hr/d | Self-administered questionnaire | Age, smoking, alcohol consumption, education, race, family history of colon cancer, total energy intake, energy-adjusted intakes of red meat, calcium, whole grains, fruits, and vegetables, total physical activity, menopausal hormone therapy (women) | 6 |
| RR (men) = 1.24 (0.98 to 1.57) | ||||||
| RR (women) = 1.24 (0.90 to 1.70) | ||||||
| TV or video viewing time: ≥9 vs 0hr/d | ||||||
| RR (men) = 1.61 (1.14 to 2.27) RR (women) = 1.45 (0.99 to 2.12) | ||||||
| Hsing et al. ( 49 ), China | 79965/264 | Prostate cancer | Occupational sitting time: >6 vs <2hr/d | Job titles based on census data and interview | Age-specific incidence rates | 3 |
| SIR = 1.23 (0.9 to 1.5) | ||||||
| Lam et al. ( 47 ), USA | 158415/205 | Lung cancer | TV or video viewing time: ≥5 vs >3hr/d | Self-administered questionnaire | Age, current BMI, education, ethnicity, vigorous activity, alcohol consumption, total caloric intake | 5 |
| RR = 1.06 (0.77 to 1.46) | ||||||
| Lynch et al. ( 48 ), USA | 170481/13751 | Prostate cancer | TV viewing or video time: ≥7 vs <1hr/d | Self-administered questionnaire | Age at baseline, age squared, family history of prostate cancer, race, marital status, highest level of education, digital rectal examination in the past three years, prostate specific antigen test in the past three years, history of diabetes, smoking status, caloric intake, alcohol intake, recreational moderate-to vigorous intensity physical activity, BMI at baseline | 7 |
| RR = 1.03 (0.92 to 1.15) | ||||||
| Patel et al. ( 42 ), USA | 59695/314 | Ovarian cancer | Recreational sitting time ≥6 vs <3hr/d RR = 1.55 (1.08 to 2.22) | Self-administered questionnaire | Age, race, BMI, oral contraceptive use, parity, age at menopause, age at menarche, family history of breast cancer and/or ovarian cancer, hysterectomy, postmenopausal hormone replacement therapy | 7 |
| Patel et al. ( 37 ), USA | 42672/454 | Endometrial cancer | Recreational sitting time: ≥6 vs <3hr/d | Self-administered questionnaire | Age, parity, age at menarche, age at menopause, postmenopausal hormone therapy use, personal history of diabetes, smoking, total calorie intake, duration of oral contraceptive use | 7 |
| RR = 1.40 (1.03 to 1.89) | ||||||
| Pronk et al. ( 21 ), China | 73049/717 | Breast cancer | Occupational sitting time: ≥4 vs <1.20hr/d RR = 1.23 (0.91 to 1.54) | Occupational history based on interview | Age, education, family history of breast cancer, age at first birth, number of pregnancies | 8 |
| Simons et al. ( 29 ), The Netherlands | 3988/1033 (colon cancer) and 402 (rectal cancer) | Colon cancer, rectal cancer | Occupational sitting time: >6 to 8 vs <2hr/d Colon cancer: RR = 1.39 (1.12 to 1.72) | Occupational history based on self- administered questionnaire | Age, family history of colorectal cancer, smoking status, alcohol intake, BMI, meat intake, processed meat intake, total energy intake | 7 |
| Rectal cancer: RR = 0.91 (0.68 to 1.22) | ||||||
| Teras et al. ( 56 ), USA | 69849 men and 77001 women/ 1139 men and 863 women | Non-Hodgkin lymphoma | Recreational sitting time: ≥6 vs <3hr/d | Self-administered questionnaire | Age at baseline, family history of hematopoietic cancer, education, smoking status, alcohol intake, BMI, height, physical activity | 7 |
| RR (men) = 0.95 (0.79 to 1.15) | ||||||
| RR (women) = 1.26 (1.01 to 1.59) | ||||||
| Ukawa et al. ( 46 ), Japan | 23090 men and 31168 women/598 men and 200 women | Lung cancer | TV viewing time: ≥4 vs <2hr/d | Self-administered questionnaire | Age, smoking | 7 |
| RR (men) = 1.36 (1.04 to 1.79) | ||||||
| RR (women) = 1.01 (0.66 to 1.59) | ||||||
| Weiderpass et al. ( 34 ), Finland | 413877/ 389 (esophageal cancer), 1881 (gastric cancer), 2009 (colon cancer), 1323 (rectal cancer) | Esophageal cancer, gastric cancer, colon cancer, rectal cancer | Occupational sitting time: medium/high vs no exposure (based on a score 0–2) | Job titles based on census data | Stratified by 5-year birth cohort, 5-year follow-up period, social class, turnover rate (proportion of individuals stay within a job title between 1970–1975) (esophageal cancer: additionally adjusted for alcohol use) | 5 |
| RR (colon cancer) = 1.32 (1.10 to 1.59) | ||||||
| RR (rectal cancer) = 0.92 (0.70 to 1.20) | ||||||
| RR (gastric cancer) = 1.08 (0.87 to 1.34) | ||||||
| RR (esophageal cancer) = 1.24 (0.73 to 2.11) | ||||||
| Xiao et al. ( 43 ), USA | 96,247/463 | Ovarian cancer | Television or video viewing time: ≥7 vs <3hr/d | Self-administered questionnaire | Age, no. of live births, age at menarche, age at menopause, race, education, marital status, oral contraceptive use, menopause hormone therapy use, smoking | 5 |
| RR = 1.02 (0.67 to 1.55) | ||||||
| Case-control studies | ||||||
| Arbman et al. ( 31 ), Sweden | 899/98 (colon cancer) 880/79 (rectal cancer) | Colon cancer Rectal cancer | Occupational sitting time: >20 vs 0 y of sedentary work | Occupational history based on self- administered questionnaire | Age | 5 |
| Colon cancer: OR = 1.50 (0.90 to 2.50) | ||||||
| Rectal cancer: OR = 0.30 (0.10 to 0.80) | ||||||
| Arem et al. ( 38 ), USA | 1329/667 | Endometrial cancer | Total sitting time: ≥8 vs 0 to <4hr/d OR = 1.52 (1.07 to 2.16) | Interview | Age, race, number of live births, menopausal status, oral contraceptive use, smoking status, hypertension, BMI; matching factor: age | 6 |
| Boyle et al. ( 27 ), Australia | 1866/ 284 (proximal colon cancer), 268 (distal colon cancer), 318 (rectal cancer) | Proximal colon cancer, distal colon cancer, rectal cancer | Occupational sitting time: ≥10 vs 0 y in sedentary work | Occupational history based on self- administered questionnaire | Age, lifetime recreational physical activity level, cigarette smoking, diabetes, education, energy intake from food, alcohol intake, BMI at age 20 years, BMI at age 40 years, socioeconomic status, years in a heavy or very heavy occupation; matching factors: age, sex | 6 |
| Proximal cancer: OR = 1.11 (0.69 to 1.76) | ||||||
| Distal colon cancer: OR = 1.94 (1.28 to 2.93) | ||||||
| Rectal cancer: OR = 1.44 (0.96 to 2.18) | ||||||
| Cohen et al. ( 19 ), USA (nested case-control study) | 2643/459 | Breast cancer | Total sitting time: ≥12 vs <5.5hr/d | Self-administered questionnaire | Education, household income, BMI at age 21, cigarette smoking, ever use of hormone replacement therapy, parity, age at menarche, first-degree family history of breast cancer, having health insurance, total activity (for TV viewing and occupational sitting time additionally adjusted for TV or video viewing, sitting at work, sitting in a car or bus, other sitting where appropriate); matching factors: age, race, menopausal status, enroll ment source; | 6 |
| OR = 1.41 (1.01 to 1.95) | ||||||
| TV or video viewing time: ≥5 vs <2hr/d | ||||||
| OR = 0.97 (0.70 to 1.35) | ||||||
| Occupational sitting time: ≥3 vs 0hr/d | ||||||
| OR = 1.13 (0.82 to 1.56) | ||||||
| Dosemeci et al. ( 15 ), Turkey | 3961 men and 565 women/241 (women, breast cancer), 31(men, breast cancer), 93 (colon cancer), 120 (rectal cancer), 1148 (lung cancer), 31 (endometrial cancer), 49 (ovarian cancer), 27 (prostate cancer), 224 (gastric cancer), 191 (testicular cancer) | Breast cancer, colon cancer, rectal cancer, lung cancer, endometrial cancer, ovarian cancer, prostate cancer, gastric cancer | Occupational sitting time: >6 vs <2 hr/d (sitting time index) | Job titles | Age, smoking, socioeconomic status | 5 (colon cancer, rectal cancer, lung cancer, prostate cancer, gastric cancer), 4 (breast cancer, endometrial cancer, ovarian cancer) |
| Breast cancer: OR (women): 1.0 (0.40 to 2.50); OR (men): 1.10 (0.10 to 11.0) | ||||||
| Colon cancer: OR = 1.40 (0.50 to 4.10) | ||||||
| Rectal cancer: OR = 1.10 (0.40 to 2.60) | ||||||
| Endometrial cancer: OR = 0.50 (0.10 to 4.40) | ||||||
| Lung cancer: OR = 1.30 (0.90 to 1.80) | ||||||
| Ovarian cancer: OR = 0.40 (0.10 to 1.90) | ||||||
| Prostate cancer: OR = 1.10 (0.10 to 12.00) | ||||||
| Gastric cancer: OR = 0.70 (0.40 to 1.40) | ||||||
| Testicular cancer: OR = 0.70 (0.40 to 1.50) | ||||||
| Friedenreich et al. ( 39 ), Canada | 1574/542 | Endometrial cancer | Occupational sitting time: >16.94 vs 0–≤3.59hr/wk | Occupational history based on interview | Age, physical activity, matching factor: age | 6 |
| OR = 1.29 (0.92 to 1.79) | ||||||
| Kruk et al. ( 24 ), Poland | 1942/857 | Breast cancer | Occupational sitting time: >80% vs <20% of working hours sitting: OR = 1.16 (0.86 to 1.56) | Self-administered questionnaire | Age, BMI, lifetime household, physical activity, lifetime recreational physical activity, age at menarche, age at first full-term pregnancy, parity, months of breastfeeding, active and passive smoking, matching factors: age, place of residence | 5 |
| Lee et al. ( 45 ), China | 1000/500 | Ovarian cancer | Total sitting time: >8.5 vs 4hr/d | Interview | Age, parity, oral contraceptive use, BMI, menopausal status, education level, smoking status, family history of ovarian or breast cancer, matching factor age | 6 |
| OR = 1.07 (0.77 to 1.48) | ||||||
| Littman et al. ( 53 ), USA | 1414/391 | Testicular cancer | TV or video viewing time: ≥21 vs <7hr/wk | Interview | Age, income, race, history of undescended testes, moderate intensity activities, vigorous intensity activities, duration of competitive sports | 5 |
| OR = 1.3 (0.80 to 2.0) | ||||||
| Lynch et al. ( 65 ), Canada | 2452/1222 | Breast cancer | Occupational sitting time: ≥7.3 vs 0hr/wk OR (premenopausal women) = 0.85 (0.58 to 1.24) OR (postmenopausal women) = 0.71 (0.52 to 0.97) | Occupational history based on interview | Age, educational level, lifetime total physical activity, calorie intake, alcohol consumption, smoking status, waist-to-hip ratio, total number of mammograms, first-degree family history of breast cancer, ever use of hormone replacement therapy, number of children breastfed, matching factors: age, place of residence | 5 |
| Marcus et al. ( 23 ), USA | 1650/ 863 | Breast cancer | TV viewing time: daily or almost daily vs never | Interview | Age at diagnosis/selection, age, sampling design, matching factors: age, race | 4 |
| OR = 1.10 (0.80 to 1.50) | ||||||
| Mathew et al. ( 22 ), India | 3739/1866 | Breast cancer | TV viewing time during weekends: ≥180 vs <60min/d | Interview | Age, locality, religion, marital status, education, socioeconomic status, residential status, BMI, waist and hip sizes, parity, age at first child-birth, duration of breast feeding, and various activities | 6 |
| OR (premenopausal women) = 0.90 (0.61 to 1.34) | ||||||
| OR (postmenopausal women) = 1.01 (0.64 to 1.59) | ||||||
| Matthews et al. ( 26 ), China | 3015/ 1459 | Breast cancer | Occupational sitting time: Q5 (long) vs Q1 (short) (job to code classifications) | Occupational history based on interview | Age, education, household income, first-degree family history of breast cancer, history of breast fibroadenoma, age at menarche, age at first live birth, and age at menopause; matching factors: age | 6 |
| RR = 1.11 (0.83 to 1.47) | ||||||
| Matthews et al. ( 40 ), China | 1677/832 | Endometrial cancer | Occupational sitting time: Q5 (more) vs Q1 (less): | Occupational history based on interview | Age, age at menarche, menopausal status and age, number of pregnancies, oral contraceptive use, current smoking, ever drinking, family history of cancer, education, height, BMI, matching factor: age | 5 |
| OR = 0.93 (0.67 to 1.30) | ||||||
| Peplonska et al. ( 25 ), Poland | 4502/ 2176 | Breast cancer | Occupational sitting time: >47.8 vs < 11.3 MET hr/wk: | Occupational history based on interview | Age, study site, education, BMI, age at menarche, age at menopause, menopausal status, number of full-term births, age at first full-term birth, breast feeding, family history of breast cancer, previous screening mammography, total lifetime recreational physical activity and household physical activity, matching factor: age, city of residence | 6 |
| OR = 1.09 (0.90 to 1.31) | ||||||
| Santibanez et al. ( 52 ), Spain | 43/19 | Esophageal cancer | Occupational sitting time: high vs unexposed (based on a score 0–2) | Occupational history based on interview | Age, province, educational level, alcohol drinking and tobacco smoking (matching factors: age group, sex and province) | 6 |
| RR = 0.99 (0.46 to 2.10) | ||||||
| Santibanez et al. ( 51 ), Spain | 69/35 | Gastric cancer | Occupational sitting time: high vs unexposed (based on a score 0–2) | Occupational history based on interview | Age, province, educational level, alcohol drinking, tobacco smoking, fruits and vegetables intake and total energy intake, matching factors: age, sex, province | 6 |
| RR = 1.06 (0.58 to 1.95) | ||||||
| Shu et al. ( 41 ), China | 517/261 | Endometrial cancer | Occupational sitting: Q4 (>80% sitting) vs Q1 (<20% sitting): | Occupational history based on interview | Age, number of pregnancies, matching factor: age | 5 |
| OR = 1.2 (0.7 to 2.0) | ||||||
| Steindorf et al. ( 30 ), Poland | 360/180 | Colorectal cancer | TV viewing time: >2 vs <1.14hr/d | Interview | Education, total energy intake (matching factors: age and sex) | 5 |
| OR = 2.22 (1.19 to 4.17) | ||||||
| United Kingdom Testicular Cancer Study Group, ( 54 ), United Kingdom | 1587/793 | Testicular cancer | Total sitting time: ≥10 vs 0–2hr/d | Interview | Undescended testis and inguinal hernia diagnosed <15 years (matching factor: age) | 6 |
| OR = 1.71 (1.08 to 2.72) | ||||||
| Zahm et al. ( 57 ), USA | 3856 men and 854 women/985 men and 180 women | Non-Hodgkin lymphoma | Occupational sitting time: >6 vs <2hr/d | Occupational history based on interview | Age, state of residence, matching factor age | 5 |
| OR (men) = 1.00 (0.77 to 1.25) | ||||||
| OR (women) = 0.83 (0.43 to 1.43) | ||||||
| Zhang et al. ( 44 ), China | 906/254 | Ovarian cancer | TV viewing time: >4 vs <2hr/d | Interview | Age, locality, education, family income, BMI, smoking, alcohol consumption, tea consumption, physical activity, marital status, menopausal status, parity, oral contraceptive use, tubal ligation, hormone replacement therapy, ovarian cancer in first-degree relatives, total energy intake | 5 |
| OR = 3.39 (1.0 to 11.5) | ||||||
* BMI = body mass index; CI = confidence interval; EA = esophageal adenocarcinoma; ESCC = esophageal squamous cell carcinoma; GCA = gastric cardia adenocarcinoma; GNCA = gastric noncardia adenocarcinoma; NOS = Newcastle-Ottawa Scale; OR = odds ratio; PA = physical activity; RR = relative risk; TV = television.
Fifteen studies used self-administered questionnaires to assess TV viewing time, recreational sitting time, or total sitting time, and eight studies used an interview-based approach. Regarding occupational sitting time, six studies used self-administered questionnaires to assess occupational history, and 10 studies applied an interview-based approach. Three studies used job titles based on census data, and two studies used a combination of job titles and interview. Twenty-seven studies used hours per day of sitting as a measure of sedentary behavior. The number of adjustment factors in the models ranged from two to 17. Twenty-seven studies had a quality score equal to or greater than 6 points, and 16 studies showed a quality score of less than 6 points ( Table 1 ).
Sedentary Behavior in Relation to Cancer Risk
Sedentary Behavior and Site-Specific Cancer Risk.
Comparing the highest vs the lowest levels of sedentary behavior, statistically significant positive relations were observed for cancers of the colon (RR = 1.28; 95% CI = 1.13 to 1.45), endometrium (RR = 1.36; 95% CI = 1.15 to 1.60), and lung (RR = 1.21; 95% CI = 1.03 to 1.43) ( Figures 2 and 3 ). In contrast, sedentary behavior was unrelated to breast cancer (RR = 1.03; 95% CI = 0.95 to 1.12), ovarian cancer (RR = 1.22; 95% CI = 0.93 to 1.59), prostate cancer (RR = 1.10; 95% CI = 0.93 to 1.30), gastric cancer (RR = 1.05; 95% CI = 0.87 to 1.26), esophageal cancer (RR = 0.87; 95% CI = 0.57 to 1.34), testicular cancer (RR = 1.27; 95% CI = 0.84 to 1.92), renal cell cancer (RR = 0.97; 95% CI = 0.67 to 1.40), and non-Hodgkin lymphoma (RR = 1.03; 95% CI = 0.89 to 1.20).
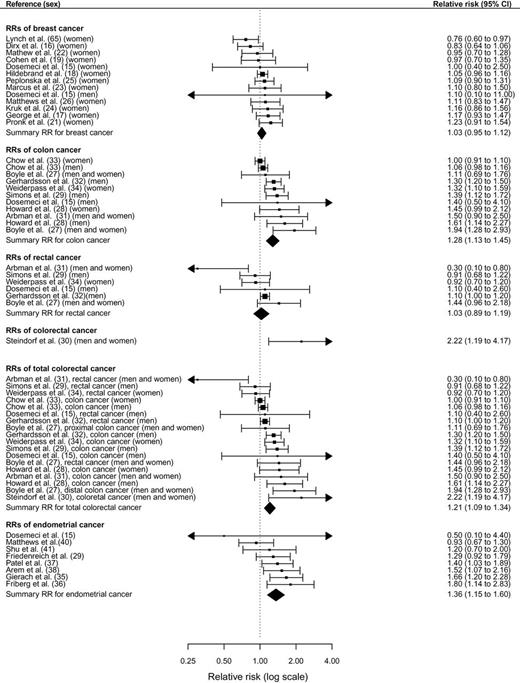
Forest plot corresponding to the main random effects meta-analysis quantifying the relationships between sedentary behavior and breast cancer, colon cancer, rectal cancer, colorectal cancer, and endometrial cancer. All statistical tests were two-sided. CI = confidence interval; RR = relative risk.
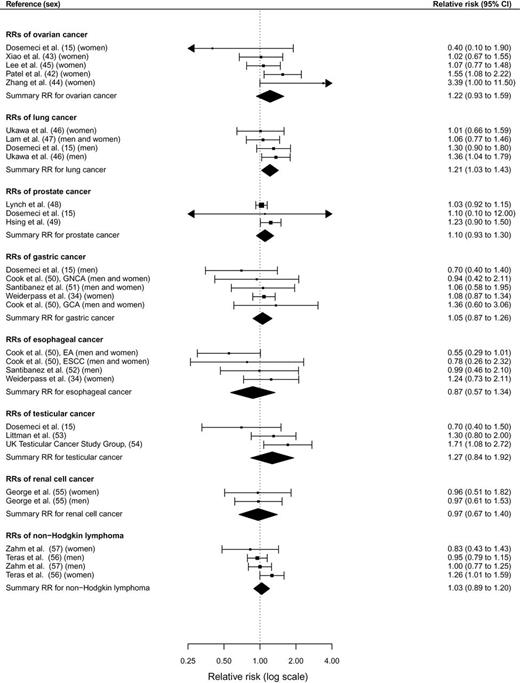
Forest plot corresponding to the main random effects meta-analysis quantifying the relationships between sedentary behavior and ovarian, lung, prostate, gastric, esophageal, testicular, and renal cell cancer and non-Hodgkin lymphoma. All statistical tests were two-sided. CI = confidence interval; EA = esophageal adenocarcinoma; ESCC = esophageal squamous cell carcinoma; GCA = gastric cardia adenocarcinoma; GNCA = gastric noncardia adenocarcinoma; RR = relative risk.
No heterogeneity across studies was observed for sedentary behavior in relation to cancers of the breast ( I2 = 27.4%; Pheterogeneity = .27), endometrium ( I2 = 28.8%; Pheterogeneity = .22); ovaries ( I2 = 28.3%; Pheterogeneity = .10), lung ( I2 = 0%; Pheterogeneity = .54), prostate ( I2 = 39.8%; Pheterogeneity = .31), stomach ( I2 = 0%; Pheterogeneity = .76), esophagus ( I2 = 34.1%; Pheterogeneity = .26), testes ( I2 = 45.8%; Pheterogeneity = .15), renal cell ( I2 = 0%; Pheterogeneity = .98), and non-Hodgkin lymphoma ( I2 = 32.1%; Pheterogeneity = .24). We observed some heterogeneity for studies of sedentary behavior and rectal cancer ( I2 = 31.2%; Pheterogeneity = .047). Initial evidence for study heterogeneity for colon cancer ( I2 = 71.2%; Pheterogeneity = .0004) was no longer evident after excluding the study by Chow et al. (which reported the weakest association with sedentary behavior) ( 33 ) ( I2 = 0%; Pheterogeneity = .73).
No publication bias was evident for the relations of sedentary time to breast cancer (Begg’s rank correlation test: P = .44; Egger’s regression test: P = .83) and endometrial cancer (Begg’s rank correlation test: P = .40; Egger’s regression test: P = .46). With regards to sedentary behavior and colon cancer, funnel plot asymmetry and Egger’s regression test ( P = .01) suggested publication bias, whereas Begg’s rank correlation test did not ( P = .88). We did not evaluate publication bias for other cancer sites because of small numbers of studies for those sites. For all cancer sites combined, the funnel plot, Egger’s regression test ( P = .95), and Begg’s rank correlation test ( P = .86) did not indicate publication bias.
Individual Domains of Sedentary Behavior and Site-Specific Cancer Risk.
Table 2 shows the relative risks comparing the highest vs lowest levels of total sitting time, TV viewing time, and occupational sitting time in relation to cancers of the breast, colon, and endometrium. Increased total sitting time showed positive associations with colon cancer (RR = 1.24; 95% CI = 1.03 to 1.50) and endometrial cancer (RR = 1.32; 95% CI = 1.08 to 1.61). Likewise, TV viewing time displayed positive relations to colon cancer (RR = 1.54; 95% CI = 1.19 to 1.98) and endometrial cancer (RR = 1.66; 95% CI = 1.21 to 2.28; based on one study). A positive association with occupational sitting time was restricted to colon cancer (RR = 1.24; 95% CI = 1.09 to 1.41).
Relative risks (95% confidence intervals) and I2 measures of heterogeneity from random effects models of sedentary behavior* in relation to risks of breast, colon, and endometrial cancer, stratified by physical activity domain, and P values for difference obtained from random effects meta-regression†
| Variable | Number of RRs | RR (95% CI) | I2 | Pdifference |
|---|---|---|---|---|
| Breast cancer | ||||
| Total sitting time | 2 | 1.20 (0.98 to 1.48) | 36 | .44 |
| TV viewing time | 4 | 1.07 (0.92 to 1.23) | 0 | |
| Occupational sitting time | 9 | 1.03 (0.90 to 1.18) | 46 | |
| Colon cancer | ||||
| Total sitting time | 2 | 1.24 (1.03 to 1.50) | 0 | .43 |
| TV viewing time | 2 | 1.54 (1.19 to 1.98) | 0 | |
| Occupational sitting time | 9 | 1.24 (1.09 to 1.41) | 73 | |
| Endometrial cancer | ||||
| Total sitting time | 2 | 1.32 (1.08 to 1.61) | 0 | .13 |
| TV viewing time | 1 | 1.66 (1.21 to 2.28) | ||
| Occupational sitting time | 4 | 1.11 (0.88 to 1.39) | 10 | |
* Recreational sitting time not listed due to insufficient number of available studies of recreational sitting time in relation to cancer risk.
† The P values were calculated using meta-regression comparing the model including the stratification variable as explanatory variable with the null model without any explanatory variables; all statistical tests were two-sided. CI =confidence interval; RR = relative risk; TV = television.
Dose–Response Relation Between Sedentary Behavior and Site-Specific Cancer Risk
Each 2-hour per day increase in sitting time was related to an 8% increased risk of colon cancer (RR = 1.08; 95% CI = 1.04 to 1.11), a 10% increased risk of endometrial cancer (RR = 1.10; 95% CI = 1.05 to 1.15), and a borderline statistically significant 6% increased risk of lung cancer (RR = 1.06; 95% CI = 1.00 to 1.11). By comparison, increasing sedentary time was unassociated with breast cancer (RR = 1.01; 95% CI = 0.98 to 1.04), ovarian cancer (RR = 1.02; 95% CI = 0.95 to 1.11), prostate cancer (RR = 1.02; 95% CI = 0.98 to 1.07), and non-Hodgkin lymphoma (RR = 1.01; 95% CI = 0.97 to 1.06).
Potential Modifying Factors of the Sedentary Behavior and Cancer Relation
Adjustments for dietary factors and alcohol intake modified the association between sedentary behavior and breast cancer ( Table 3 ). Specifically, we observed a positive relation for studies that did not adjust for dietary factors (RR = 1.07; 95% CI = 1.01 to 1.15) or alcohol consumption (RR = 1.10; 95% CI = 1.00 to 1.21), whereas an inverse association was noted for studies that adjusted for dietary factors (RR = 0.91; 95% CI = 0.70 to 1.18; Pdifference = .04) or alcohol consumption (RR = 0.95; 95% CI = 0.79 to 1.15; Pdifference = .04). The positive association between sedentary behavior and colon cancer was slightly more pronounced in high-quality studies (RR = 1.38; 95% CI = 1.25 to 1.53) than low quality studies (RR = 1.13; 95% CI = 0.97 to 1.30; Pdifference = .03).
Relative risks (95% confidence intervals) from random effects models of high vs low levels of sedentary behavior in relation to cancer risk, stratified by selected study characteristics, and P values for difference from random effects meta-regression*
| Variable | Breast cancer | Colon cancer | Endometrial cancer | ||||||
|---|---|---|---|---|---|---|---|---|---|
| Number of RRs | RR (95% CI) | Pdifference | Number of RRs | RR (95% CI) | Pdifference | Number of RRs | RR (95% CI) | Pdifference | |
| Sex | |||||||||
| RRs among men | 0 | 5 | 1.27 (1.08 to 1.50) | 0 | |||||
| RRs among women | 13 | 1.08 (0.95 to 1.12) | 3 | 1.19 (0.95 to 1.50) | 8 | 1.36 (1.15 to 1.60) | |||
| RRs among men and women | 0 | 3 | 1.50 (1.07 to 2.09) | 0.22 | 0 | ||||
| Study design | |||||||||
| Case–control | 9 | 1.01 (0.90 to 1.13) | 4 | 1.49 (1.10 to 2.02) | 5 | 1.20 (0.96 to 1.50) | |||
| Cohort | 4 | 1.06 (0.92 to 1.22) | .39 | 7 | 1.23 (1.08 to 1.40) | .12 | 3 | 1.57 (1.29 to 1.91) | .07 |
| Number of adjustment factors | |||||||||
| RRs within upper tertile of number of adjustment factors | 4 | 1.04 (0.96 to 1.13) | 4 | 1.53 (1.25 to 1.86) | 3 | 1.30 (0.91 to 1.87) | |||
| RRs within intermediate tertile of number of adjustment factors | 4 | 0.96 (0.77 to 1.19) | 2 | 1.35 (1.17 to 1.55) | 2 | 1.60 (1.26 to 2.02) | |||
| RRs within lower tertile of number of adjustment factors | 5 | 1.16 (0.99 to 1.34) | .17 | 5 | 1.13 (0.98 to 1.30) | .10 | 3 | 1.24 (0.95 to 1.64) | .45 |
| Adjustment for physical activity | |||||||||
| Adjusted for physical activity | 7 | 1.03 (0.93 to 1.13) | 4 | 1.53 (1.25 to 1.86) | 2 | 1.47 (1.07 to 2.02) | |||
| Not adjusted for physical activity | 6 | 1.05 (0.89 to 1.25) | .70 | 7 | 1.20 (1.06 to 1.36) | .21 | 6 | 1.32 (1.07 to 1.63) | .13 |
| Adjustment for adiposity† | |||||||||
| Adjusted for adiposity | 7 | 1.02 (0.94 to 1.11) | 5 | 1.45 (1.26 to 1.68) | 7 | 1.23 (1.07 to 1.41) | |||
| Not adjusted for adiposity | 8 | 1.07 (0.94 to 1.21) | .54 | 8 | 1.23 (1.07 to 1.40) | .14 | 6 | 1.45 (1.24 to 1.70) | .10 |
| Adjustment for smoking‡ | |||||||||
| Adjusted for smoking | 7 | 1.02 (0.88 to 1.17) | 6 | 1.46 (1.27 to 1.69) | 4 | 1.35 (1.05 to 1.73) | |||
| Not adjusted for smoking | 6 | 1.05 (0.94 to 1.18) | .46 | 5 | 1.16 (1.02 to 1.33) | .08 | 4 | 1.37 (1.09 to 1.74) | .11 |
| Adjustment for dietary factors‡ | |||||||||
| Adjusted for dietary factors | 3 | 0.91 (0.70 to 1.18) | 5 | 1.46 (1.27 to 1.69) | 2 | 1.51 (1.18 to 1.94) | |||
| Not adjusted for dietary factors | 10 | 1.07 (1.01 to 1.15) | .04 | 6 | 1.16 (1.02 to 1.33) | .09 | 6 | 1.29 (1.04 to 1.60) | .11 |
| Adjustment for alcohol consumption‡ | |||||||||
| Adjusted for alcohol consumption | 4 | 0.95 (0.79 to 1.15) | 5 | 1.46 (1.27 to 1.69) | 1 | 0.93 (0.67 to 1.30) | |||
| Not adjusted for alcohol consumption | 9 | 1.10 (1.00 to 1.21) | .04 | 6 | 1.16 (1.02 to 1.33) | .09 | 7 | 1.46 (1.26 to 1.69) | .19 |
| Study quality score | |||||||||
| NOS ≥6 | 8 | 1.06 (0.99 to 1.13) | 6 | 1.38 (1.25 to 1.53) | 5 | 1.34 (1.10 to 1.62) | |||
| NOS <6 | 5 | 0.98 (0.76 to 1.25) | .31 | 5 | 1.13 (0.97 to 1.30) | .03 | 3 | 1.44 (0.97 to 2.14) | .45 |
| Study geographic location | |||||||||
| North America | 5 | 1.01 (0.87 to 1.16) | 2 | 1.54 (1.19 to 1.98) | 4 | 1.46 (1.24 to 1.71) | |||
| Europe | 5 | 1.01 (0.85 to 1.21) | 5 | 1.33 (1.21 to 1.47) | 2 | 1.50 (0.63 to 3.60) | |||
| Asia | 3 | 1.12 (0.96 to 1.30) | .34 | 2 | 1.03 (0.97 to 1.10) | 2 | 1.00 (0.76 to 1.33) | .46 | |
| Australia | 2 | 1.48 (0.86 to 2.56) | .10 | ||||||
| Number of case patients | |||||||||
| <730 | 4 | 1.13 (0.92 to 1.38) | 6 | 1.31 (1.02 to 1.68) | 7 | 1.46 (1.26 to 1.69) | |||
| ≥730 | 9 | 1.02 (0.93 to 1.11) | .21 | 5 | 1.27 (1.11 to 1.45) | .64 | 1 | 0.93 (0.67 to 1.30) | .19 |
| Number of study participants | |||||||||
| <3000 | 6 | 0.97 (0.80 to 1.18) | 4 | 1.49 (1.10 to 2.02) | 5 | 1.20 (0.96 to 1.50) | |||
| ≥3000 | 7 | 1.06 (0.99 to 1.14) | .21 | 7 | 1.23 (1.08 to 1.40) | .12 | 3 | 1.57 (1.29 to 1.91) | .19 |
* The P values were calculated using meta-regression comparing the model including the stratification variable as explanatory variable with the null model without any explanatory variables. P values were adjusted for sedentary behavior domain; all statistical tests were two-sided. CI = confidence interval; NOS = Newcastle-Ottawa Scale; RR = relative risk.
† The number of risk estimates differed from those of the other variables because some studies provided risk estimates adjusted for adiposity and not adjusted for adiposity.
‡ For colon cancer, the summary relative risks and P values for differences regarding the analyses stratified by adjustments for smoking, dietary factors, and alcohol consumption are virtually identical because, with the exception of one study, those stratified analyses are based on the same studies.
Discussion
The primary finding from our meta-analysis is that prolonged TV viewing and time spent in other sedentary pursuits is associated with increased risks of colon and endometrial cancer. Each 2-hour per day increase in sedentary time was related to a statistically significant 8% increase in colon cancer risk and 10% increase in endometrial cancer risk. We also found a positive relation between high vs low sedentary behavior and lung cancer. By comparison, associations of sedentary behavior with cancer risk were null for cancers of the breast, ovaries, prostate, stomach, esophagus, testes, and renal cell and for non-Hodgkin lymphoma.
Several biologic mechanisms may mediate the observed positive association between sedentary behavior and cancer. Time spent sedentary displaces light intensity physical activity, causing decreased energy expenditure accompanied by weight gain and obesity ( 7 ), which are related to increased risk of cancer ( 66 , 67 ). Obesity facilitates carcinogenesis through a number of pathways, including insulin resistance, perturbations in the insulin-like growth factor axis ( 68 , 69 ), and low-grade systemic inflammation ( 70 , 71 ). In postmenopausal women, the adipose tissue represents the main site of androgen aromatization, leading to enhanced circulating levels of estrogen ( 72 ), which pose risk for endometrial cancer ( 73 ).
Vitamin D deficiency represents an additional biologic pathway through which sedentary behavior may contribute to cancer etiology. Vitamin D levels are lower in obese than normal weight individuals ( 74 ), and increased vitamin D levels are hypothesized to protect against colon cancer ( 75 ).
Results from bed-rest studies or animal experiments may provide further insight into the etiologic mechanisms linking sedentary behavior to cancer. One trial reported that 14 days of bed rest in young volunteers caused a proinflammatory response, with increased circulating levels of C-reactive protein and interleukin 6 ( 76 ), although another trial found that 7 days of bed rest in elderly individuals did not affect serum inflammatory markers ( 77 ). A study in mice reported that lifelong sedentariness impaired skeletal muscle mitochondrial function and increased oxidative damage to skeletal muscle mitochondria ( 78 ), events that may play a role in carcinogenesis ( 79 ).
Previous studies investigating sedentary behavior in relation to biomarkers of diabetes and cardiovascular disease found a stronger association with TV viewing time than with occupational sitting time ( 80 , 81 ). For example, one prospective investigation reported that each 2-hour per day increase in TV viewing time was associated with a 23% increased risk of obesity, whereas each 2-hour per day increment in sitting at work was related to an only 5% enhanced obesity risk ( 80 ). One potential explanation for a more deleterious effect of TV viewing than other sedentary pursuits on disease risk is that TV viewing is often accompanied by an unhealthy diet and enhanced smoking initiation ( 9 , 82 ), factors that are positively related to risk of major chronic diseases, including cancer ( 11 , 83 , 84 ). The possibility that TV viewing time better captures the aspect of sedentary behavior that is relevant to cancer than other domains of sedentary behavior is not supported by our data because the confidence intervals for the individual domains of sedentary behavior overlapped considerably. Also, we found that adjustment for smoking had no appreciable impact on the association between sedentary behavior and cancer, although this may in part be related to the imprecision in assessing smoking history ( 85 ).
The positive association between sedentary behavior and breast cancer was more pronounced in studies that did not adjust for dietary factors or alcohol consumption than in studies that adjusted for those variables. An unhealthy diet has been linked to both prolonged sitting time ( 8 , 86 ) and to breast cancer ( 87 , 88 ) and thus, failure to adjust for diet may have produced a more pronounced risk estimate between the two.
We evaluated whether obesity could represent an intermediate step in the causal pathway linking prolonged sitting time to increased risk of cancer. The positive relation between sedentary behavior and cancer was not consistently attenuated when the analysis was restricted to datasets that were adjusted for measures of adiposity. We note that our ability to assess the true contribution of adiposity to the sedentary behavior and cancer relation was limited because the majority of studies included in our meta-analysis used BMI as a measure of adiposity, which is an imperfect measure of adiposity because it also accounts for lean body mass. Future studies should use measures that differentiate between fat mass and lean mass, such as dual energy x-ray absorptiometry or magnetic resonance imaging to clarify whether time spent sedentary simply represents a proxy for obesity or whether sitting is indeed a risk factor for cancer independent of obesity.
Strong positive associations with sedentary behavior were evident for colon cancer and endometrial cancer, tumors that are considered obesity related ( 66 ). In contrast, relations of sedentary behavior to breast cancer and renal cell cancer were null, even though obesity is positively associated with those malignancies ( 66 ). This suggests that sedentary behavior and obesity mediate risk for certain cancers (eg, colorectal cancer and endometrial cancer) through shared mechanisms, whereas other cancers (eg, breast cancer and renal cell cancer) show distinct obesity-specific pathways.
Adjustment for physical activity did not affect the positive association between sedentary behavior and cancer. This indicates that the increased risk of cancer seen in individuals with prolonged time spent sedentary is not explained by the mere absence of physical activity in those persons. Support is provided by observations of significant positive relations of TV viewing time to metabolic risk and mortality, even in physically active adults ( 89 , 90 ). That sedentariness has a detrimental impact on cancer even among physically active persons implies that limiting the time spent sedentary may play an important role in preventing cancer, even against the background of achieving the physical activity recommendations.
We noted that the positive association between sedentary behavior and colon cancer was more pronounced in high-quality than low-quality studies. Low-quality studies are more prone to selection bias, misclassification, and confounding, which may have obliterated the true relation of sedentary behavior to colon cancer in those studies.
Few organizations have made recommendations on sedentary behavior for health. The American Cancer Society promotes limiting the time spent watching TV and other screen-based entertainment to help maintain a healthy body weight and decrease the risk of cancer ( 13 ). The American College of Sports Medicine advocates reducing sedentariness for all adults and interspersing intervals of standing and short bouts of physical activity between periods of time spent sedentary, regardless of an individual’s physical activity level ( 91 ). In contrast, the global recommendations on physical activity for health published by the World Health Organization ( 92 ) and the 2008 Physical Activity Guidelines for Americans presented by the US Department of Health and Human Services ( 93 ) lack recommendations for sedentary behavior. The Canadian Society for Exercise Physiology in collaboration with stakeholder organizations ( 94 ) launched guidelines on sedentary behavior for children and adolescents but not for adults and emphasized the need for additional work to be accomplished in this area.
Our systematic review and meta-analysis has a number of important strengths. We summarized risk estimates from epidemiologic studies that comprised substantial numbers of cancer case patients and were adjusted for numerous potential confounding variables, yielding precise and valid risk estimates for sedentary behavior. We used uniform criteria for identifying relevant studies and abstracting pertinent information. Additional advantages include our detailed assessment of a broad range of sedentary behavior domains and our evaluation of cancers of individual sites.
One limitation of our meta-analysis is the wide variation in the definitions of high and low levels of sedentary behavior in the underlying studies, with some studies providing risk estimates for daily TV viewing vs never TV viewing and others comparing more than 6 hours to less than 3 hours per day of time spent sedentary. However, we addressed such heterogeneity in a dose–response meta-regression analysis in which we combined risk estimates associated with comparable levels of sedentary behavior. A further potential shortcoming is the use of self-reports or interviews as opposed to objective measures such as accelerometry to assess sedentary behavior, which may have misclassified true levels of sedentary behavior. However, self-reported sedentary behavior delivers information on the specific domain in which sedentary behavior occurs, a feature not provided by accelerometry.
The validity of self-reported sedentary behavior varies widely across sedentary behavior domains when compared with objective measures, with correlation coefficients ranging between 0.69 and 0.83 for TV viewing and computer use combined, 0.13 and 0.74 for occupational sitting time, and 0.02 and 0.75 for total sitting time ( 95 ). Self-reported TV viewing and screen time tends to be underestimated ( 96 , 97 ), suggesting that the true adverse effect of TV viewing time on cancer risk may be stronger than that estimated in our study. Some occupational sitting studies may have introduced exposure misclassification to our meta-analysis because they were based on job titles or used a combination of sedentary behavior and physical activity to define sitting time categories. Because investigations of cancer etiology require accurate data on the amount of sedentariness, as well as information on the specific domain and context in which sedentary behavior takes place, future studies would benefit from using a combination of objective and self-reported assessments of sedentary behavior.
In summary, findings from this meta-analysis of sedentary behavior and cancer provide epidemiologic evidence for a deleterious effect of prolonged sitting time on risk for certain types of cancer. Although recommendations and intervention approaches regarding the appropriate amount of physical activity for cancer prevention have accumulated in recent years ( 92 , 93 ), individual-level and public health efforts to reduce the time spent sedentary have been given less weight and should be more strongly emphasized ( 13 , 91 ).
D. Schmid and M. F. Leitzmann had full access to all of the data in the study and take responsibility for the integrity of the data and the accuracy of the data analysis. They were jointly responsible for study concept and design, acquisition of data, analysis and interpretation of data, critical revision of the manuscript for important intellectual content, and administrative, technical, or material support. D. Schmid was also responsible for drafting of manuscript and statistical analysis. M. F. Leitzmann was also responsible for study supervision.
The authors declare no conflicts of interest.
References

