


Abstract
A number of databases on the plant metabolome describe the chemistry and biosynthesis of plant chemicals. However, no such database is specifically focused on foods and more precisely on polyphenols, one of the major classes of phytochemicals. As antoxidants, polyphenols influence human health and may play a role in the prevention of a number of chronic diseases such as cardiovascular diseases, some cancers or type 2 diabetes. To determine polyphenol intake in populations and study their association with health, it is essential to have detailed information on their content in foods. However this information is not easily collected due to the variety of their chemical structures and the variability of their content in a given food. Phenol-Explorer is the first comprehensive web-based database on polyphenol content in foods. It contains more than 37 000 original data points collected from 638 scientific articles published in peer-reviewed journals. The quality of these data has been evaluated before they were aggregated to produce final representative mean content values for 502 polyphenols in 452 foods. The web interface allows making various queries on the aggregated data to identify foods containing a given polyphenol or polyphenols present in a given food. For each mean content value, it is possible to trace all original content values and their literature sources. Phenol-Explorer is a major step forward in the development of databases on food constituents and the food metabolome. It should help researchers to better understand the role of phytochemicals in the technical and nutritional quality of food, and food manufacturers to develop tailor-made healthy foods. Database URL: http://www.phenol-explorer.eu
Introduction
Polyphenols are secondary plant metabolites of highly diverse chemical structures (1,2). More than 500 polyphenols have been described in common foods and beverages. During the last decade the interest for polyphenols has increased considerably, especially among food scientists, nutritionists, the agricultural/food industry and the consumers. This is mainly due to the discovery of their antioxidant effects and their role in the prevention of several chronic diseases, such as cardiovascular diseases, certain cancers or type 2 diabetes (3,4). Dietary polyphenols differ widely in their physico-chemical properties, bioavailability, biological properties and health effects (5,6). It is therefore essential to have detailed and comprehensive information on the nature and quantities of polyphenols found in the main foods consumed with our diet. This information is needed for researchers in food science and nutrition, food manufacturers, regulatory authorities, dieticians or consumers to currently have representative content values for polyphenol contents in foods, to compare polyphenol content between foods, to calculate polyphenol intake in populations and study its association with health and disease, or to evaluate the relative contribution of a given food product to the intake of a particular polyphenol as compared to other food sources.
So far, this information was not easily accessible for various reasons. First, the diversity of their structures and of the analytical methods used for their quantification results in the dispersal of the data in over 1000 literature sources. Secondly, due to the lack of standardization of the analytical methods, content values for a given polyphenol in a given food are often not easily compared (7–10). Finally, polyphenol content in a given food may vary greatly according to variety, agricultural conditions, storage and processing conditions (11).
The main databases on polyphenol content in foods have been developed at the USDA (United States Department of Agriculture) (12–14). They are available as PDF files or as downloadable Microsoft Access® files. These files include data for 50 polyphenols, mainly flavonoid aglycones. Flavonoids form one of the main four classes of polyphenols, the other ones being phenolic acids, lignans and stilbenes. Flavonoids are largely present in foods as glycosides. They are often quantified as aglycones to reduce the diversity of the compounds to be analyzed and make the analyses easier. However glycosides are known to vary in their chemical and biological properties and some potentially useful data is lost in the process. EuroFIR-BASIS is another database currently developed on bioactives in plant-based foods which includes some polyphenols (15). It contains data on content in foods and on biological effects.
We developed a new comprehensive database on polyphenol content in foods, Phenol-Explorer, which contains data for all known polyphenols in foods. Composition data were collected from peer-reviewed scientific publications, evaluated and used to calculate representative mean content values for 502 polyphenols in 452 foods. The database is available as an open electronic source through a user-friendly web interface which allows making simple or more complex queries such as:
– Which are the polyphenols present in a given food?
– Which are the dietary sources of a given polyphenol?
– How much of a specific compound is found in a given food?
This database is the first attempt to systematically collect information on an essential part of the plant metabolome (polyphenols) with a specific attention to food. As compared to other databases on the chemistry of plant chemicals, their occurrence in plants and biosynthesis (16–20), Phenol-Explorer adds detailed information on the specific occurrence and content in foods of one of the major classes of phytochemicals.
Database development
The development of the Phenol-Explorer database included five main steps: literature search, data compilation, data evaluation, data aggregation and final data exportation to the MySQL database (Figure 1).
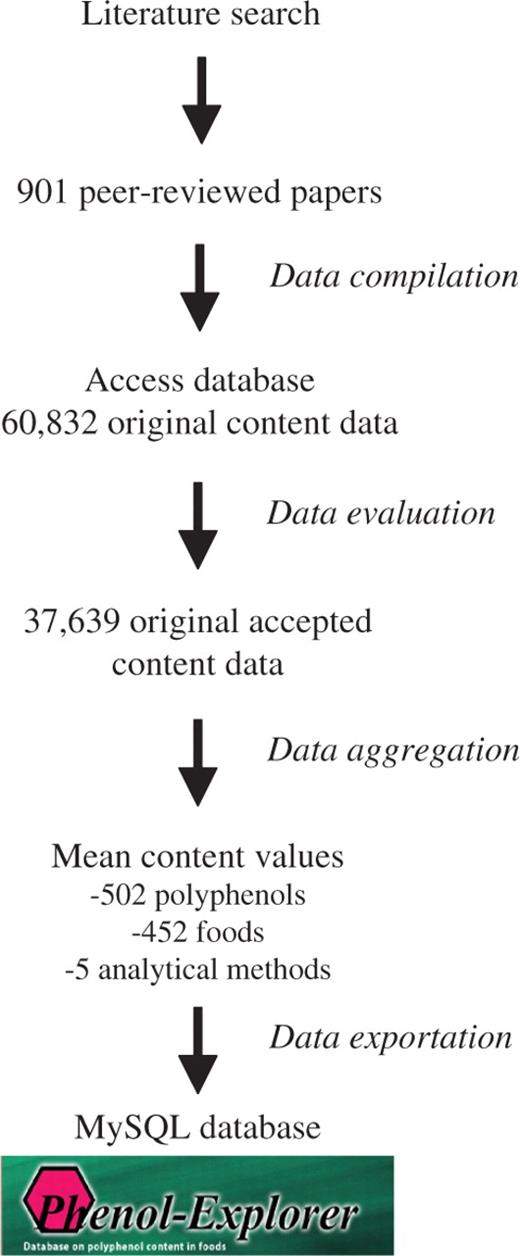
Schema of the development of the Phenol-Explorer database.
Phenol-Explorer was first developed as a Microsoft Access® database containing data on polyphenol content in foods collected from scientific publications in peer-reviewed journals. Systematic queries were performed in the FSTA database (Food Science and Technology AbstractsTM) from 1969 until present. These queries were built from a template using the most representative food names in the food group of interest, associated to the names of polyphenols and polyphenol classes and to keywords related to quantitative information. For example, to search references on carrot polyphenols, the following query was used: [(carrot or carrots) and (vitisin or resveratrol or stilbene* or polyphenol* or phenol* or flavon* or flavan* or cinnamic* or benzoic* or anthocyan* or quercetin or luteolin or myricetin or apigenin or isorhamnetin or catechin* or epicatechin* or epigallocatechin* or nar* or hes* or lignan* or tannin* or ellagitannin* or ellagic or kaempferol or proanthocyan* or procyan* or caffeic or ferulic or sinapic or chlorogenic) and (composition* or compound or compounds or content or contents or determin* or quanti* or profil* or identif*)]. The bibliographical references were imported in an Endnote® 7.0 (Thomson Reuters) library. The references likely to provide quantitative information on polyphenols in the studied food groups were selected on the basis of their title and abstract. The corresponding full papers were collected. The comprehensiveness of the literature search was further confirmed by examination of the citations in the collected articles, as well as in review papers and books, and in the USDA database. A total of 1300 scientific papers were thus collected. Food composition data were finally extracted from 901 of these publications.
Information on foods, polyphenols, analytical methods and composition was manually inserted in the Microsoft Access® database. The database is organized in five main tables (Figure 2):
Foods. It contains food names with different descriptors related to food type (e.g. blood orange or blond orange), plant part, or processing (e.g. whole or peeled apple). Scientific names and botanical families of the plant species, as well as food groups, food sub-groups and LanguaL codes are also registered. A food ontology was specifically built for Phenol-Explorer, based on different sources (2,21,22). The food list includes all foods for which enough polyphenol content data of acceptable quality was available, according to the defined inclusion/exclusion criteria (see infra). Some foods like many cooked foods were not included due to too limited data available in the literature to provide representative mean content values for the polyphenols they contain.
Compounds. All polyphenols for which content values in foods have been reported are included. A compound ontology, principally derived from reference books and on-line chemical databases (23–25) was specifically built for the present database, divided in classes, sub-classes and families (e.g. (+)-catechin belongs to the class ‘flavonoids’, the sub-class ‘flavanols’ and the family ‘catechins’). The table also contains synonyms, empirical formula and molecular weight, aglycone names, and identification numbers in major chemical databases (CAS, ChEBI and PubChem).
Publications. It contains full details on the literature references.
Methods. It contains the analytical methods. Methods considered acceptable were classified in five different categories:
Chromatography. High performance liquid chromatography (HPLC), the most commonly used technique, followed by gas chromatography (GC) and capillary electrophoresis (CE), have been used to estimate individual polyphenols as present in the foods. It is possible to quantify polyphenol glycosides, phenolic acid esters together with aglycones and free phenolic acids using this approach.
Chromatography after hydrolysis. Acid or alkaline hydrolysis is used to cleave glycosidic and/or ester bonds of glycosylated or esterified polyphenols. The resulting aglycones are then quantified by chromatography.
Normal phase HPLC. This method has been used in a few laboratories to estimate proanthocyanidin oligomers and polymers according to their degree of polymerization (dimers to decamers and higher), which cannot be easily separated by reverse phase HPLC (26). Proanthocyanidin dimers and trimers but not higher oligomers are also individually analyzed by reverse phase HPLC; in this case the corresponding content values were reported under the ‘Chromatography’ method category.
Folin assay. It is a spectrophotometric assay commonly used to determine the total polyphenol content. Values are somewhat overestimated due to interferences with other compounds such as vitamin C, eventually also present in the foods, which also reduce the Folin reagent.
pH differential method. It is a spectrophotometric method commonly used to determine the total anthocyanin content (8,27).
Composition. This table is linked to the other four ones. It contains the original data as described in the journal articles, such as the original food name and its full description (species, cultivar, brand, food part, sample treatment, processing, storage), the number of independent samples analyzed to produce the reported content value, the extraction method, the standard compound used for quantification, the compound used for the expression of the content value (the content of a polyphenol glycoside can be expressed in aglycone equivalent), the original content value, the original content unit, and the moisture content if available. All content values were converted to standard units in the column ‘calculated content value’ (mg/100 g fresh weight for solid foods and oils, and mg/100 ml for beverages, sauces and seasonings) and eventually recalculated (for example contents expressed in aglycone equivalent are calculated to obtain the content of the polyphenol glycoside). The column ‘Quality’, with a scrolling menu including the options ‘Yes’ or ‘No’, indicates whether a data was finally considered acceptable to be included in the database, according to the quality described below.
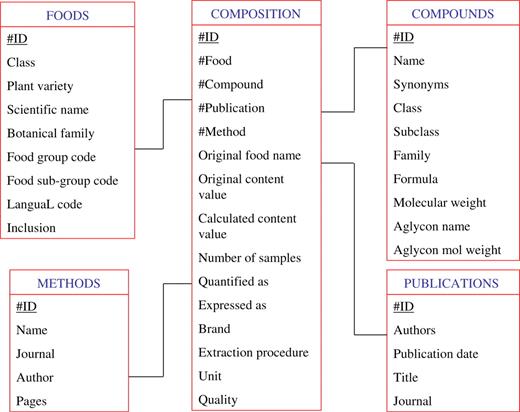
The different tables and their relationships in the Phenol-Explorer database.
A total of 60 832 composition data were compiled from the 901 retrieved papers and inserted in the Microsoft Access® database. They were critically evaluated applying a set of inclusion/exclusion criteria. One or more of the following conditions justified the exclusion of a composition data: A total of 37 634 composition data extracted from 638 scientific publications fulfilled the specified minimal requirements. They were aggregated to produce weighed mean content values according to the number of independent samples used to produce each original content value. Separate aggregations were made according to the five types of analytical methods.
Samples: Lack of information on the nature of the samples analyzed; analyzed samples corresponding to non-edible parts of the plant (e.g. tea leaves); for non-commercial products, samples obtained experimentally using procedures clearly different from regular manufacture or domestic practices (e.g. experimental wine).
Analytical methods: Inaccurate identification of the polyphenol; inappropriate method of polyphenol extraction or lack on information on the method used or on the polyphenol standard used for quantification; inappropriate method of analysis, due to e.g. a too heterogeneous molar absorption or chemical reactivity between phenolic compounds (UV spectrophotometry or Prussian blue method for total polyphenols, vanillin–HCl, DMACA–HCl or butanol–HCl assays for proanthocyanidins) (28). Some other methods are potentially useful but they have so far been used by a too limited number of authors, e.g. thiolysis for proanthocyanidin estimation (29), or total polyphenols estimated after removal of interfering compounds with solid phase extraction (30).
Expression of results: Food content expressed per dry weight units with no information on moisture content provided; content values reported in graph; mean content values without a description of the number of samples analyzed; content values corresponding to sums of the contents of different individual polyphenols.
Implementation and architecture
Finally, data from the Microsoft Access® database were exported to a MySQL database which is used by the web interface. The Phenol-Explorer system is built in the Ruby on Rails (RoR) framework (http://www.rubyonrails.org). RoR employs the Model-View-Controller design pattern, and allowed us to build an efficient and reliable web application. The publicly accessible Phenol Explorer web server runs on a Debian Linux system using an Apache 2 web server.
A secure portal to the website was created to allow the direct addition of new data after login to the system by authorized compilers. Composition data fulfilling the minimal quality requirements and used to produce the mean content values are immediately accessible to the general public on the website after update. All other data can only be accessed by the authorized compilers.
Querying the database
Simple search
Simple searches can be made from any page of the website, entering a food or compound name. A list of foods/compounds matching the query is shown. For example, if ‘wine’ is typed, 10 beverages are retrieved including red, white and rosé wines as well as wines produced from berries other than grape. If the polyphenol ‘quercetin’ is typed, 29 polyphenols containing quercetin in their name are displayed (quercetin, quercetin 3-O-rutinoside, quercetin 3-O-arabinoside, etc.). For each food, an option ‘Show polyphenol content’ provides a table with the content of all individual polyphenols known in this food. For each polyphenol, the option ‘Show content in foods’ provides a table with the contents of this polyphenol in all foods where it has been described (Figure 3).
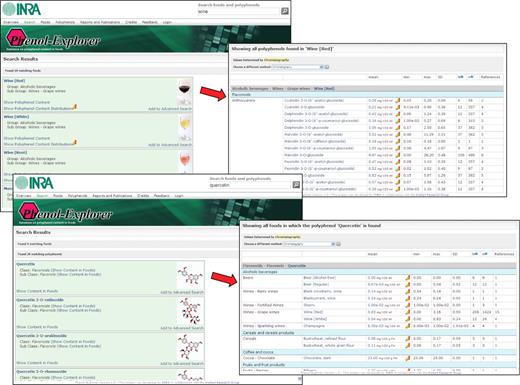
Phenol-Explorer: screenshot of simple searches for a food and the polyphenols it contains, or for a polyphenol and the foods containing it.
In both the tables of polyphenols contained in a given food, or the foods containing a given polyphenol, the following information is displayed: the weighed mean content value, the standard deviation, the minimum and maximum original content values, the number of original data points used to calculate the mean content value (n), the total number of original individual samples analyzed (N; always equal or higher than n, since some original values can be mean values obtained from several individual samples) and the number of scientific papers from which the data were extracted.
By clicking on each mean content value, all original content values and the corresponding literature sources from which they were extracted are retrieved. A graph can also be displayed, showing the number of data points per content interval to easily spot the highest or lowest original content values as reported in the original publications (Figure 4). The original food name as described in the publication is given and the eventual commercial origin of the samples analyzed indicated.
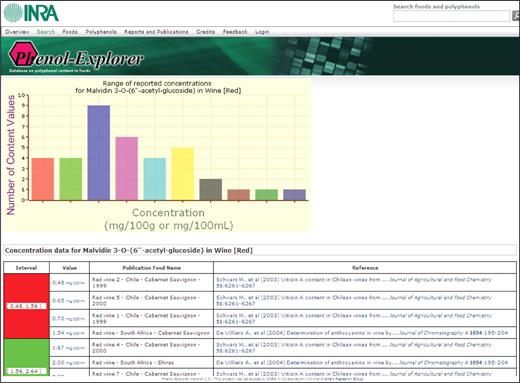
Phenol-Explorer: screenshot of the distribution of the different original content values and their corresponding literature references, used to calculate a mean content value of a given polyphenol in a given food.
The name of each food can be clicked to get information on botanical family, scientific name and its composition in other nutrients through a link to the Danish Food Composition Databank (31). Similarly, when clicking on the name of the polyphenol, molecular weight, synonyms, aglycones and links to main chemical databases (PubChem, ChEBI and CAS) are displayed.
Advanced search
More complex queries can be submitted through the ‘Advanced search’ screen. Several polyphenols and/or several foods can be simultaneously selected to produce various tables for the comparison of polyphenol contents in various food sources. Polyphenol contents obtained by the five different methods can also be compared.
Different options are proposed for the expression of the query results (Figure 5):
Contents of either individual polyphenols or calculated total polyphenols in a given polyphenol class or subclass are given.
Results can be ordered by decreasing order of content to easily identify the main polyphenols in a given source or the foods showing the highest contents of a given polyphenol.
Content values can be expressed as aglycone equivalent to remove the contribution of the sugars to polyphenol weight. These values obtained by chromatography without hydrolysis can be compared to the direct analysis of the aglycones, as measured after chemical hydrolysis of the glycosides or esters.
Content values can be expressed in weight (mg/100 g fresh weight or mg/100 ml) or moles (mol/100 g fresh weight or mol/100 ml).
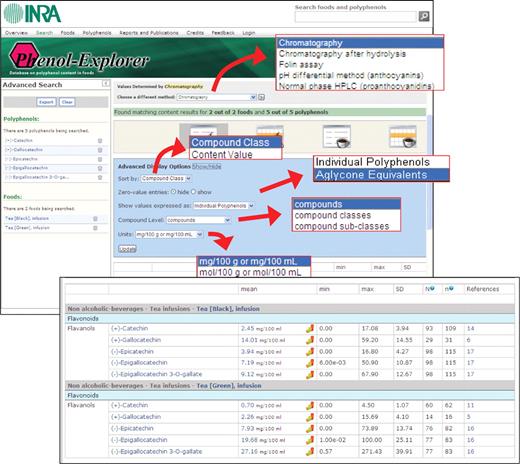
Phenol-Explorer: screenshot of an advanced search showing the different display options.
All results of queries can be exported as Excel files.
Compiler access
The website also allows the addition of new data in the database, after logging on the website. Figure 6 shows a screenshot of the webpage from which new data can be added. Once all information has been entered, it is possible to decide whether the new data, depending on its quality, is included or excluded to contribute to the weighed mean content value. Authorized compilers also have access to all data in the database, including to those excluded from the aggregation.
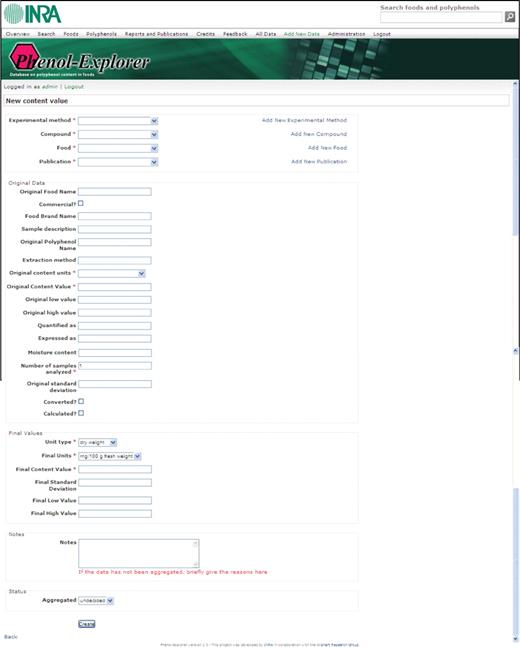
Phenol-Explorer: screenshot of the webpage from which new data can be added by an authorized compiler.
Concluding remarks and future enhancements
Phenol-Explorer is the first comprehensive database on polyphenol content in foods. It includes weighed mean content values for 502 polyphenols in 452 foods and beverages, produced from more than 37 000 original composition data. All data are available using an open access user-friendly web interface. Different queries can be made in the website, with various display options, allowing comparing polyphenol content in all foods commonly consumed by humans. All original data were evaluated before inclusion and can be traced back to the original literature sources. This new database is the first database on food composition allowing tracing all original data used to calculate weighed mean content values representative of a given food. This is particularly important for bioactive phytochemicals due to the large variability of their content in a given food. An interface has also been developed to regularly update the database.
It is also hoped that Phenol-Explorer will serve as a model to extend it to other classes of food bioactives. Such a database will also be extended to include information on the effect of cooking or processing on the content of polyphenols (and other phytochemicals), as well as information on the phytochemical metabolites formed in the body. It should thus be possible to predict in the future the nature and the concentration of metabolites reaching target tissues in the body after the consumption of any kind of diet. Conversely, such a system should also allow to identify, from a profile of phytochemical metabolites in urine or plasma as obtained in metabolomics studies (32,33), the main foods consumed before the biological samples were collected. Phenol-Explorer is a major step forward for all those interested in phytochemical science. It should become for food scientists, food manufacturers, dieticians or health-care professionals, a unique tool to better understand the impact of phytochemicals on health and to develop healthier foods.
Supplementary data
Supplementary data are available at Phenol-Explorer: www.phenol-explorer.eu
Funding
French Ministry of Research (grant NUTRIALIS, 2002-04) and by Unilever, Danone and Nestlé (2005-09). Funding to pay the Open Access publication charges for this article was provided by the Institut National de la Recherche Agronomique.
Conflict of interest. None declared.
Acknowledgements
The authors are grateful to the European Network of Excellence EuroFIR and to Jayne Ireland (CIQUAL-AFSSA) for training the compilers and for helpful discussion and suggestions.
