

Abstract
Background/Aim: Obesity currently affects the whole world, with greater incidence in high-income countries, with vast economic and social costs. Broccoli harvest generates many by-products equally rich in bioactive compounds with potential anti-obesity effects. This study aimed to evaluate the anti-obesity effects of broccoli by-products flour (BF) in obese mice. Materials and Methods: A commercial high-fat diet formulation (representing a Western diet) was used to induce obesity in mice. BF (0.67% or 1.34% weight/weight) was incorporated as a chemoprevention compound into a control and a hypercholesterolemic diet, at two different concentrations, and fed for 14 weeks to C57BL/6J mice. For a therapeutic approach, two groups were fed with the hypercholesterolemic diet for 10 weeks, and then fed with BF-supplemented diets in the last 4 weeks of the study. Results: BF supplementation helped to maintain a lower body weight, reduced adipose tissue accumulation, and enhanced the basal activity of superoxide dismutase and glutathione S-transferase. Although BF supplementation tended to reduce the relative liver weight increased by the Western diet, the differences were not significant. Conclusion: BF appears to have a beneficial effect in preventing weight gain and fat accumulation induced by hypercholesterolemic diets.
- Broccoli flour
- by-products
- C57BL/6J mice
- diet-induced obesity
The incidence of obesity has increased at an alarming rate, constituting a global public health concern with vast economic and social costs (1). This disease has been classified as an epidemic by the World Health Organization since 1997 (2). Obesity is a risk factor for a range of chronic diseases, such as diabetes mellitus, cardiovascular diseases, non-alcoholic fatty liver disease, chronic kidney disease, cancer, psychological problems, among others (3-6). Obesity usually arises as a consequence of an excess of energy intake relative to the expense of energy via metabolic and physical activity (7, 8). This imbalance in energy homeostasis is often due to the adoption of hypercaloric diets like the so-called Western diet, which is high in saturated fats and sugars and low in other nutrients, and is usually combined with a near absence of physical activity (7, 8). However, a complex combination of genetic, behavioral, and environmental factors correlating economic and social status and lifestyles, can also contribute to obesity (9, 10). One of these complex combinations of factors is the constructed environment in high-income countries that promotes overeating, especially of ultra-processed foods, a hallmark of the Western diet (11).
Broccoli belongs to the genus Brassica, of the family Brassicaceae, which consists of about 350 genera and nearly 3500 species (12). The cultivation of broccoli is very popular around the world; however, its harvesting produces a lot of residues and by-products such as leaves, stalks, damaged or low-marketable florets with poor or no economic value (13, 14). The broccoli inflorescence, as well as its by-products (leaves and stalks), are a rich source of vitamins A and C, essential mineral nutrients, dietary fiber, phenolic compounds and glucosinolates, with glucoraphanin, the precursor of sulforaphane, being the most abundant (13-18). Thus, the reuse of these by-products with potential health benefits is an important strategy in the fight against environmental and economic problems that the generation of these by-products causes (14). Over the years, this vegetable has received great attention from consumers concerned with health since its consumption is beneficial for the prevention of chronic disorders, such as diabetes mellitus, cancer and cardiovascular pathologies (19). In recent years, in vitro and in vivo studies have also shown that sulforaphane and glucoraphanin, present in broccoli, have the potential to fight obesity (20-23).
Animal models of diet-induced obesity are frequently used to study this disease, and the Western diet is a robust model of human obesity (24). Thus, the present study aimed to evaluate the anti-obesity effects of broccoli flour (BF), in mice fed with a Western diet, rich in sugar and cholesterol. BF was prepared from a mixture of leaves and stalks, since they are the main by-products of the broccoli plant, and therefore the target of valorization.
Materials and Methods
Preparation of BF. Broccoli (Brassica oleracea L. var. Italica cv. Naxus) plants were obtained from the producer Quinta do Celão, Unipessoal Lda, from a crop field located in Quinta do Celão, Adémia de Baixo, Coimbra, Portugal. Broccoli plants were harvested in July 2019. The leaves, inflorescences and stalks were cut and frozen at −80°C. Intact plant material was then freeze-dried and ground into flour in a food processor. The phenolic content and the antioxidant capacity were evaluated in broccoli plant parts (Supplementary Methods). To prepare the BF, only the leaves and stalks were used, in a mixture composed of 55% weight/weight (w/w) leaves and 45% (w/w) stalks.
Animals and diets. The animal experiments were approved by the Animal Welfare Review Body of University of Trás-os-Montes and Alto Douro and by the national competent authority Direção-Geral de Alimentação e Veterinária, Lisbon, Portugal; (license no. 8776).
Male C57BL/6J mice (n=49), 6 weeks old, were purchased from Charles River Laboratories, Saint Germain Nuelles, France. Mice were housed in open polycarbonate cages with corn cob bedding and environmental enrichment (cardboard rolls and paper), with ad libitum access to rodent standard diet and tap water. The animals were kept at university’s animal facility under controlled temperature (21±2°C), relative humidity (50±10%) and 12-h light/12-h dark cycle. Since custom diets generally have lower hardness than standard chow, wooden blocks were placed in the cages for proper tooth wear and proper expression of the mice’s behavior. After 2 weeks of acclimation, mice were fasted for 12 h before the start of exposure to the new diets and randomly assigned to one of seven groups (each with seven mice).
The BF was incorporated into different diets which were formulated to contain 0.67% (w/w) BF or 1.34% (w/w) BF. The dose of BF used in testing was established assuming that an adult person of 60 kg consumes around 150 g fresh broccoli per serving, which corresponds to around 19.05 g dry weight according to our laboratory. The consumption of 19.05 g BF per person corresponds to a dose of 317.5 mg/kg. Applying a dose conversion formula between humans (60 kg) and mice (20 g) (25), the equivalent dose will be 3905.25 mg/kg in a mouse, corresponding to around 78 mg BF/mouse. Assuming that an adult person consumes on average 3 servings of broccoli per week, the intake of 78 mg BF three times a week is equivalent to the intake of 234 mg BF/week/mouse, corresponding to an average daily intake of 33.43 mg BF/mouse. For a mouse with a 5 g average daily food intake, this corresponds to 0.67% (w/w) of the daily feed.
For 14 weeks, mice were fed with one of the experimental diets as shown in Figure 1, namely: i) Western diet, control group (CTR; Western 1635 Control; 17.9% fat- and 50.2% carbohydrate-derived calories; SAFE®, Augy, France); ii Western diet plus 0.20% cholesterol (WD; 18.1% fat- and 50.1% carbohydrate-derived calories; SAFE®); iii) control diet containing 1.34% w/w broccoli flour (CTR-1.34BF); iv) Western diet plus 0.20% cholesterol with 0.67% w/w BF (WD+0.67BF); v) Western diet plus 0.20% cholesterol with 1.34% w/w BF (WD+1.34BF). For a therapeutic approach, two additional groups were fed with Western diet plus 0.20% cholesterol for 10 weeks and then fed with the corresponding diet supplemented with BF at 0.67% or 1.34% (w/w). All the diets containing BF were prepared by SAFE diets®.

Experimental design. Mice were fed a Western control diet (CTR) or a Western diet with 0.2% cholesterol (WD) for 14 weeks. Experimental groups (n=7/group) were either supplemented with broccoli flour (BF; 0.67% or 1.34%) for the 14 weeks or for the last 4 weeks.
Food intake. The weekly food intake was calculated by subtracting the amount of food remaining in the cage from the amount of food served to mice. The average daily food intake for each group was calculated by dividing weekly food intake by 7.
Body weight and relative weight gain. Body weight was measured on a monthly basis. The relative weight gain for each mouse in each treatment group was calculated as a percentage by subtracting the weight at the beginning of the experiment (initial weight) from the weight at the end of week 14 (final weight) and then dividing by that same final weight.
Body temperature measurements by infrared imaging. Thermographic images of the back of each mouse were acquired at week 14 using a thermographic camera FLIR E8 Wifi (FLIR Systems UK, Kings Hill, UK). To avoid light interference, mice were placed in a box in a dark room. The plane of the infrared camera’s lens was positioned parallel to the plane of the back of the animal at a distance of 50 cm. To analyze the body surface temperature, thermographic images, with a 76,800 (320×240) pixel infrared resolution, were analyzed with the software FLIR Tools version 5.13.18031.2002 using data collected at a measurement point in the middle of the back.
Muscle function test. The grip strength, a non-invasive muscle function test, was performed at week 14 to test maximal isometric forelimb grip strength. Mice were positioned to form a pronated forelimb grip to one horizontal wire attached to a dynamometer calibrated to 100 g-force. Mice were then pulled horizontally away from the wire until the release of the grip, which coincides with the peak force. Force was recorded for seven attempts with LabVIEW software version 2017 (National Instruments, Austin, TX, USA).
Intraperitoneal glucose tolerance test (IPGTT). The IPGTT was performed at week 14. After overnight fasting, mice were injected intraperitoneally with a 50% glucose solution (2 g/kg). Blood was collected from a small tail puncture immediately before and 30, 60, and 120 min after the injection. At each timepoint, blood glucose was measured with an OGCare glucometer (BSI Diagnostics, Arezzo, Italy). For each treatment group, the glucose concentration was expressed as a function of time, and the area under the concentration–time curve (AUC) was then calculated.
Microhematocrit and plasma analysis. At the end of week 14, mice were fasted for 24 h and then sacrificed with an intraperitoneal overdose of ketamine (75 m/kg) and xylazine (45 mg/kg) followed by intracardiac puncture, through which the blood was collected. For the analysis of the microhematocrit, blood was collected into heparinized microhematocrit tubes. After centrifugation at 13,548×g for 5 min at room temperature, the column of red blood cells was read with the aid of a ruler. To obtain plasma, lithium-heparin tubes with blood were centrifuged at 1,400×g for 15 min at 4°C. The plasma was then collected and stored at −20°C for subsequent analysis of biochemical parameters: total cholesterol (TC), triglycerides (TG), high-density lipoprotein-cholesterol (HDL-c), and glucose, to be determined by spectrophotometric methods using an autoanalyzer (Prestige 24i: PZ Cormay, Warsaw, Poland). Low-density lipoprotein-cholesterol (LDL-c) was calculated using the Friedewald formula [LDL=TC-HDL-(TG/5)].
Histopathology. A complete necropsy was performed on all animals, and heart, lungs, spleen, kidney and liver were weighed and collected for microscopic evaluation. Stomach, intestines, bladder, testicles, and epididymal and retroperitoneal white adipose tissues were also collected. Sampled organs and tissues were fixed in 10% neutral buffered formalin, dehydrated through a graded series of alcohols and embedded in paraffin. Tissue sections at 2-μm-thick were stained with hematoxylin and eosin for observation under a light microscope for histological analysis. All the microscopic changes were registered, namely in the liver, in which the distribution (focal or diffuse) of fatty changes (micro- and macrovacuolar) and the presence of inflammatory infiltrate was recorded.
White adipose tissue morphology. Following the methodology proposed by Corino et al. (26), morphometric analysis of the epididymal adipose tissue was performed in histological sections (2 μm) from each paraffin block, using an optical microscope (IX 51; Olympus, Tokyo, Japan), equipped with a CCD camera (Color View III, Olympus, Hamburg, Germany). The area of 100 adipocytes was determined in five fields per section, using Olympus CellˆA software for image analysis (Version 2.6; Build 1210). The average size of the adipocytes was calculated and three different area classes were determined (<500, 500-1,000, ≥1,000 μm2), in which the cell size distribution was expressed as a percentage. The number of adipocytes was also determined in five fields/section at ×200 magnification. The average number per group was calculated. The number of adipocytes was also determined in a fixed area (569,638 μm2), in five fields per section (magnification of ×100) and the mean number was calculated per sampled animal. The adipocyte volume was determined using the formula π/6×[3σ2×d+d5], where d was the mean diameter of 100 measured cells in the field, and σ the standard deviation of the diameter (27).
Liver oxidative stress. Liver samples were homogenized in cold buffer solution (0.32 mM of sucrose, 20 mM of HEPES, 1 mM of MgCl2, and 0.5 mM of phenylmethylsulfonylfluoride, pH 7.4). After homogenization, samples were centrifuged (15000×g for 20 min at 4°C) and supernatants were collected. Analyses were performed in duplicate using a PowerWave XS2 microplate scanning spectrophotometer (Bio-Tek Instruments, Santa Clara, CA, USA) or Varian Cary Eclipse (Varian; Palo Alto, CA, USA) spectrofluorometer, equipped with a microplate reader. Superoxide dismutase (SOD) activity was assessed according to the method described by Durak et al. (28) at 560 nm. The activity of catalase was estimated at 240 nm (28). Glutathione peroxidase (GPx) activity was measured by the oxidation of NADPH at 340 nm as in Nakamura et al. (29). Glutathione S-transferase (GST) activity was assessed at 340 nm through the reaction of the thiol group of glutathione with 1-chloro-2,4-dinitrobenzene. A molar extinction coefficient of 9.60 mM−1 cm−1 was used. The levels of reduce glutathione and oxidized glutathione were determined by derivatization with ortho-phthalaldehyde, at 320 nm wavelength and 420 nm (30). The ratio between reduce and oxidized glutathione was determined as the oxidative-stress index.
Reactive oxygen species generation was determined by using a 2,7-dichlorofluorescein diacetate probe, with excitation at 485 nm and emission at 530 nm as previously described (31). An indicator of lipid peroxidation (LPO), malondialdehyde, was determined by the thiobarbituric acid-based method (32) at 530 nm.
Statistical analysis. Statistical analysis was carried out using GraphPad Prism 7 software (GraphPad Software, Inc., San Diego, CA, USA). To determine if data followed a Gaussian distribution, data was analyzed for normality by using Shapiro-Wilk normality test. One-way analysis of variance was performed followed by Dunnett’s multiple comparison test. Tukey’s multiple comparison test was used for phenolic composition and antioxidant capacity of broccoli plant parts. For histological lesions, chi-square test was used. Differences were considered significant when p<0.05.
Results
Body measurements. The initial and final body weight and the relative weight gain of each group are shown in Table I. At 14 weeks after starting the diets, the WD group had a higher final body weight (p<0.01) compared to the CTR group, however, regarding the relative weight gain, this difference was not significant between groups. Similarly, BF supplementation reduced the final body weight (p<0.05) of WD+0.67BF and WD+1.34BF groups compared to the WD group, nevertheless, these differences were not significant between groups regarding weight gain. BF supplementation also non-significantly reduced the final body weight and weight gain of the 4-week WD+0.67BF group compared to the WD; the 4-week WD+1.34BF group was also not affected by BF supplementation, showing similar final body weight and weight gain to the WD group. The CTR+1.34BF group had the lowest weight gain, which is in accordance with the lowest food intake registered during the study, significantly differing (p<0.05) from both CTR and WD groups (Table I). Similarly, the 4-week WD+1.34B group, which had the highest weight gain, had the greatest food intake (p<0.01) compared to the CTR and WD groups. The remaining groups had similar food ingestion.
Body weight, food intake, relative organs weight, body temperature and muscle strength from mice fed with a Western control diet (CTR) or a Western diet with 0.2% cholesterol (WD) for 14 weeks. Experimental groups (n=7/group) were either supplemented with broccoli flour (BF; 0.67% or 1.34%) for 14 weeks or only in the last 4 weeks (4w). Data are expressed as the mean±standard error of the mean, n=7.
The groups fed with WD had significantly higher relative liver weights, (p<0.05) compared to the CTR group. Nevertheless, WD with BF supplementation at 1.34% for 14 weeks led to a significant decrease in liver mass compared to the WD group (Table I). Unexpectedly, supplementation of the CTR diet with 1.34% BF led an increase in the liver weight compared to the CTR group.
Regarding relative adipose tissue weight (Table I), the WD group had the highest epididymal and retroperitoneal fat weights, which significantly differed (p<0.05) from the CTR. The groups fed the WD supplemented with BF had a significant decrease (p<0.05) in the accumulation of epididymal and retroperitoneal fat compared to WD, except for the group receiving 4-week supplementation with 1.34% BF. Regarding the relative weights of the heart, lungs, spleen and kidneys, the different diets did not induce significant differences between groups (Supplementary Table I).
At the end of the study, the WD group had a lower body temperature (p<0.01) than the CTR group, which was the highest (Table I). However, the CTR-1.34BF group recorded the lowest body temperature value, being statistically lower (p<0.0001) compared to the CTR. No differences in body temperature regarding the remaining groups were registered.
Concerning the strength measurements (Table I), no differences in muscle function performance were observed between the experimental groups.
Liver and white adipose tissue analysis. All animals of the CTR group showed a normal liver architecture. Table II shows the liver fatty changes and their distribution in the remaining groups. The WD and CTR-1.34BF groups showed fatty changes in six of the animals, only one animal in these groups had a normal liver, being statistically different (p<0.05) from the CTR group (Table II). The remaining groups did not differ significantly from the CTR group. No statistically significant differences were observed among groups regarding liver fatty changes and distribution of the lesions. Multifocal hepatitis was occasionally seen without any differences among experimental groups. Examples of microscopic images of liver sections are shown in Supplementary Figure 1. No pathological changes were observed in the other organs analyzed namely, heart, lungs, spleen, kidney, stomach, intestines, bladder, testicles, and white adipose tissues.
Liver fatty changes (micro- and macrovacuolar) and distribution of the lesions (%) in mice fed with a Western control diet (CTR) or a Western diet with 0.2% cholesterol (WD) for 14 weeks. Experimental groups (n=7/group) were either supplemented with broccoli flour (BF; 0.67% or 1.34%) for 14 weeks or only in the last 4 weeks (4w).
The analysis of white fat tissue showed that the estimated number of adipocytes did not vary significantly among groups (Figure 2A). Regarding the area of the adipocytes, despite this being greater in the WD group, the differences were not significant compared to the other groups (Figure 2B). However, the WD group had a significantly (p<0.01) higher volume of adipocytes compared to the other groups (Figure 2C). In the WD group, adipocytes with areas greater than 1,000 μm2 represented the highest proportion, while in the other groups, adipocytes with areas between 500-1,000 μm2 (Figure 2D) were the most frequent. Representative microscopic images of adipocytes are shown in Figure 3.

Morphometric analysis of adipocytes. Mice were fed a Western control diet (CTR) or a Western diet with 0.2% cholesterol (WD) for 14 weeks. Experimental groups (n=7/group) were either supplemented with broccoli flour (BF; 0.67% or 1.34%) for 14 weeks or for the last 4 weeks (4w). A: Number of adipocytes; B: area per adipocyte; C: volume per adipocyte; and D: relative frequency of adipocyte size (calculated based on adipocyte area). Data are expressed as the mean±standard error of the mean, n=7. Significantly different by one-way analysis of variance followed by Dunnett’s multiple comparison test at: ***p<0.001 from CTR; ##p<0.01, ###p<0.001 from WD.

Representative images (hematoxylin and eosin-stained) of adipocytes from mice fed a Western control diet (CTR) (A), a Western diet plus 0.2% cholesterol (WD) (B) or WD supplemented with 0.67% broccoli flour (C), for 14 weeks. Bar corresponds to 100 μm.
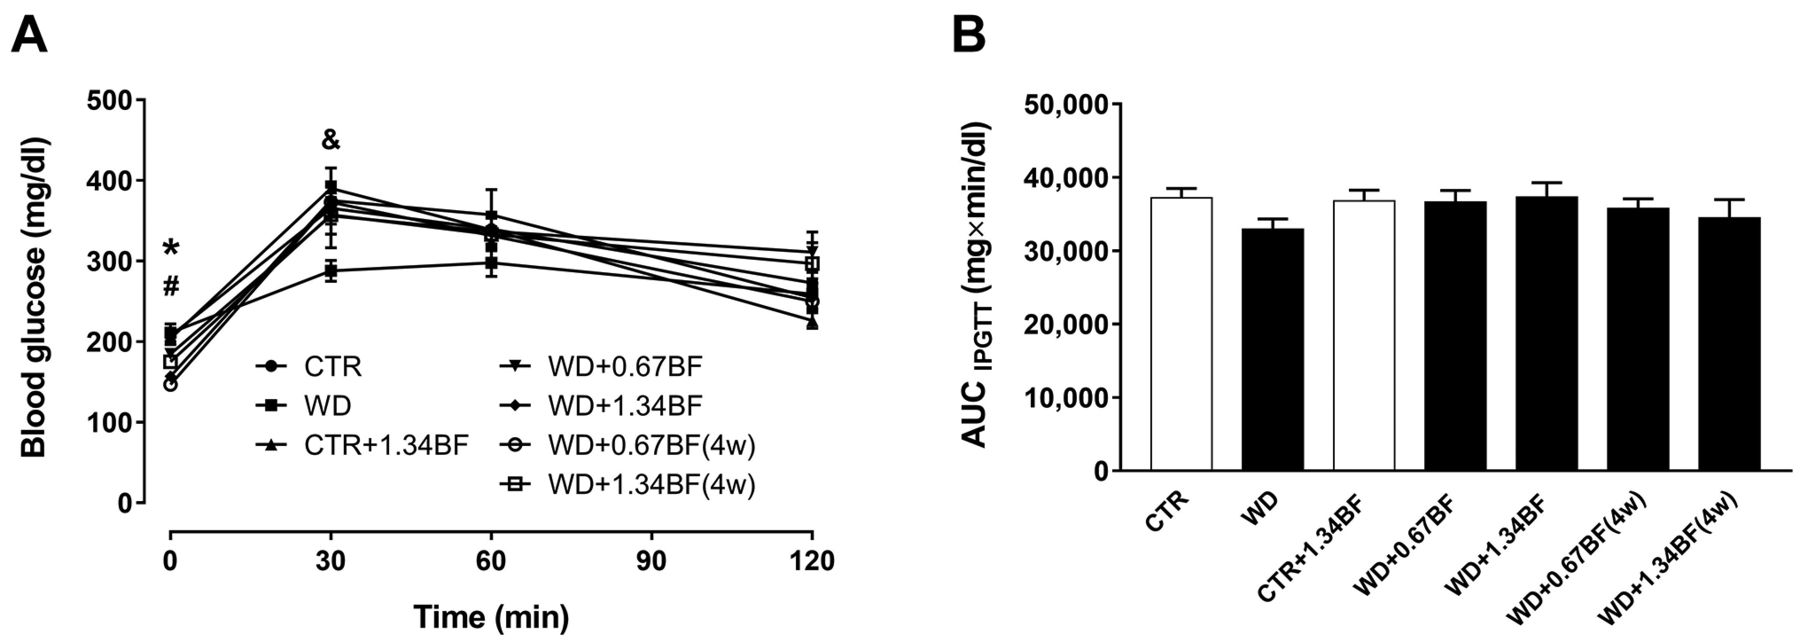
Intraperitoneal glucose tolerance test. IPGTT was assessed in the last week of the study. Before injection of glucose solution, fasting glucose levels in the WD+1.34BF, and both 4-week supplemented groups were significantly lower (p<0.05) than the levels of the CTR and WD groups (Figure 4A). After injection, there were no significant differences among groups, except for at 30 min where the CTR-1.34BF had significantly higher (p<0.05) blood glucose levels compared to the WD group (Figure 4A). Accordingly, the area under the curve analysis (Figure 4B) revealed no significant differences between the experimental groups.

Intraperitoneal glucose tolerance test. Mice were fed a Western control diet (CTR) or a Western diet with 0.2% cholesterol (WD) for 14 weeks. Experimental groups (n=7/group) were either supplemented with broccoli flour (BF; 0.67% or 1.34%) for the 14 weeks or only in the last 4 weeks (4w). A: Blood glucose was measured immediately before and 30, 60, and 120 min after the injection of 50% glucose solution (2 g/kg, i.p.). B: The glucose concentration was expressed as a function of time, and the area under the concentration–time curve (AUC) was calculated. Data are expressed as the mean±standard error of the mean, n=7. Significantly different at p<0.05 at the same time point by one-way analysis of variance followed by Dunnett’s multiple comparison test: *CTR different from WD+1.34BF, WD+0.67BF(4w) and WD+1.34BF(4w); #WD different from WD+1.34BF, WD+0.67BF(4w) and WD+1.34BF(4w); &WD different from CTR+1.34BF.
Plasma glucose, lipid profile and microhematocrit. At the end of the study, the WD group had the highest glucose level, followed by WD+0.67BF and 4-week WD+1.34B groups (Table III), statistically higher (p<0.05) compared to the CTR group. Supplementation with BF tended to lower plasma glucose levels in the other groups fed with the Western diet compared to the WD group, however, the difference was not significant. Concerning the plasma levels of TC, TG, HDL-c, estimated levels of LDL-c, and microhematocrit values (Table III), no statistically significant differences were found between experimental groups.
Plasma glucose, lipid profile and microhematocrit for mice fed with a Western control diet (CTR) or a Western diet with 0.2% cholesterol (WD) for 14 weeks. Experimental groups (n=7/group) were either supplemented with broccoli flour (BF; 0.67% or 1.34%) for 14 weeks or only in the last 4 weeks (4w).
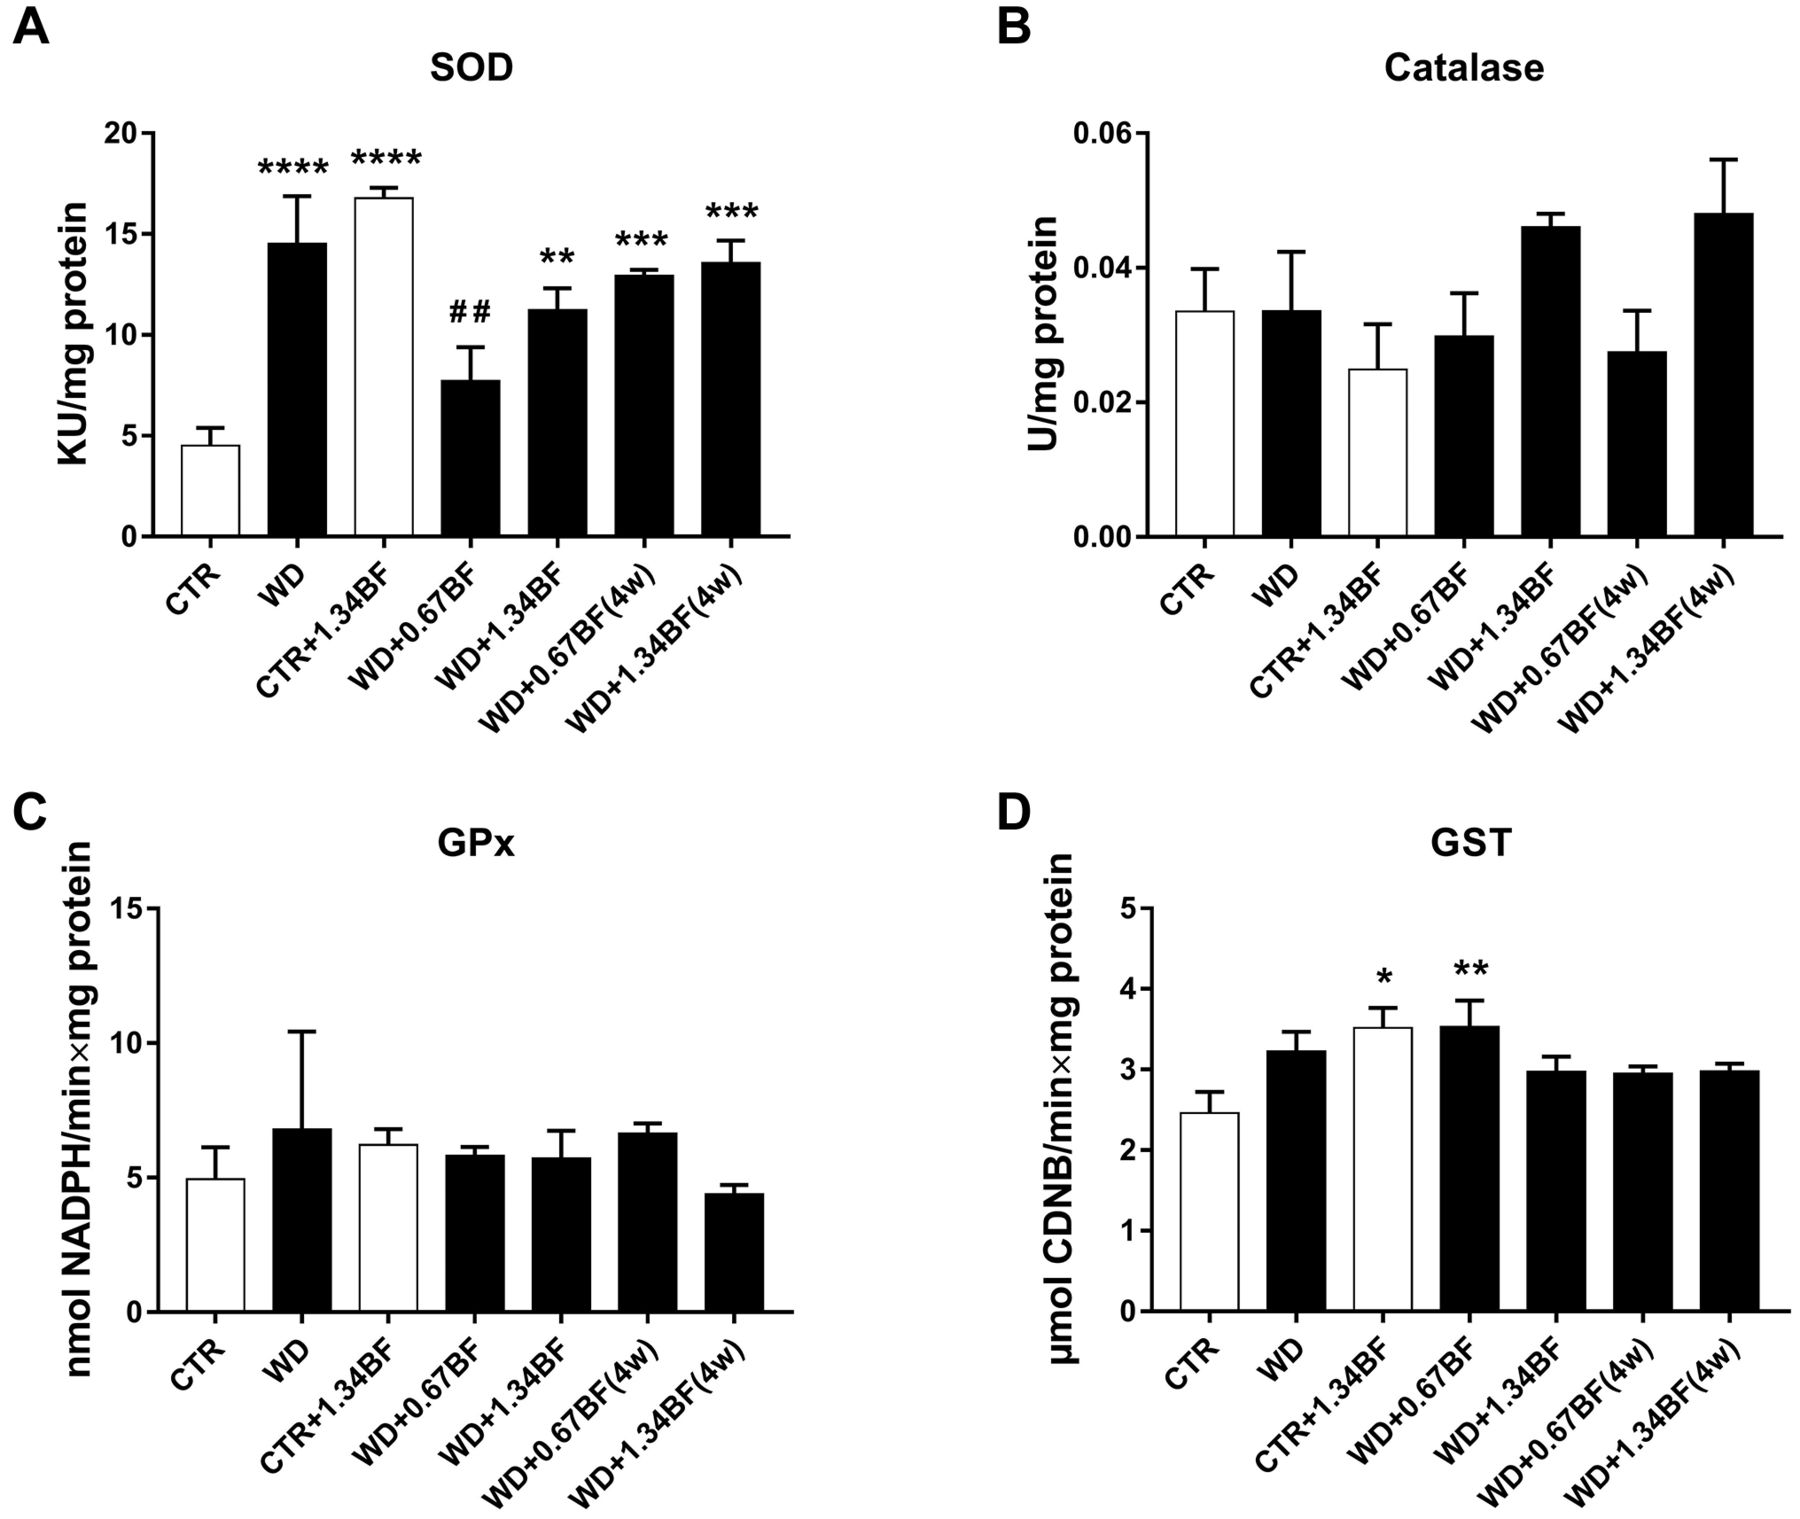
Oxidative stress parameters. Regarding hepatic antioxidant response parameters, activity of SOD (Figure 5A) in the WD (p<0.0001), WD+1.34BF (p<0.01), 4-week WD+0.67BF (p<0.001) and 4-week WD+1.34BF (p<0.001) groups was increased compared to the CTR, whilst that for the WD+0.67BF group was significantly reduced (p<0.01) compared to the WD group. Surprisingly, BF supplementation in CTR+1.34BF group significantly increased (p<0.0001) the activity of SOD compared to the CTR group. Additionally, GST activity (Figure 5D) was increased (p<0.01) in the CTR+1.34BF group compared to the CTR group. An increase in GST activity was also observed in the WD+0.67BF group (p<0.01) compared to the CTR group, with no differences for the other groups. Regarding the activity of catalase (Figure 5B) and GPx (Figure 5C), there were no differences between groups. Also, no differences were found for the oxidative-stress index, and reactive oxygen species and LPO levels in the liver (Supplementary Figure 2).

Hepatic antioxidant response. Mice were fed a Western control diet (CTR) or a Western diet with 0.2% cholesterol (WD) for 14 weeks. Experimental groups (n=7/group) were either supplemented with broccoli flour (BF; 0.67% or 1.34%) for the 14 weeks or the last 4 weeks (4w). The activity of superoxide dismutase (SOD) (A), catalase (B), glutathione peroxidase (GPx) (C), and glutathione S-transferase (GST) (D) in the liver were evaluated. Data are expressed as the mean±standard error of the mean, n=7. Significantly different by one-way analysis of variance followed by Dunnett’s multiple comparison test at: *p<0.05, **p<0.01, ***p<0.001, ****p<0.0001 from CTR; ##p<0.01 from WD.
Discussion
Broccoli is one of the most popular vegetables in the world, with high nutritional value. In addition to its florets, the leaves and stalks are also rich in bioactive compounds, although they are usually treated as by-products and underutilized. In 2020, more than 2.1 million tons of broccoli and cauliflower were produced in the European Union alone (33). Considering that leaves and stalks account for around two-thirds of the plant (13), a large production also represents a great waste of material. However, its use to produce functional foods with health benefits would be a way to deal with the environmental and economic issues that result from such waste. The broccoli plant is rich in glucosinolates that are hydrolyzed to health-promoting isothiocyanates, particularly sulforaphane (34), which in recent years has been shown to be a promising molecule against obesity (21). Obesity is a multifactorial disease, with other associated comorbidities, whose incidence has been increasing in recent years. The use of pharmacological therapies with natural compounds is of great interest due to their potential low side-effects. Taking this into account, the present study intended to evaluate the anti-obesity effects of broccoli by-products, namely from leaves and stalks, in mice fed a hypercholesterolemic diet for 14 weeks. Our findings suggest that BF supplementation, especially as a preventive approach, can contribute to the maintenance of low body weight and a decrease in adipose tissue.
In general, mice supplemented with BF had a lower body weight without altering their food intake. In agreement, BF supplementation reduced epididymal and retroperitoneal fat accumulation in mice fed the Western diet. Moreover, groups supplemented with BF tended to have a lower relative liver weight compared to the basic WD group, however, the differences were not statistically significant. The CTR+1.34BF group unexpectedly had a higher liver weight compared to the CTR group. Our results agree with another study which reported that mice fed for 14 weeks with a high-fat diet (HFD) supplemented with 2.2% broccoli sprout extract, rich in glucoraphanin, also showed a significant decrease in body weight, fat mass and liver weight compared to the obese group (22). Another study showed that broccoli extract (florets and stalks), administered per os at a dose of 200 or 400 mg/kg/day for 1 month, reduced body weight gain and adipose tissue index in rats fed a HFD (35). In mice, the increased body, liver and adipose tissue weights induced by HFD were reduced by oral treatment with 18.77 g/kg body weight broccoli powder or 150 μmol/kg body weight glucoraphanin (equivalent to 2.64 g/kg body weight broccoli seed extract powder) for 8 weeks; however, the reduction in adipose tissue was only significant with glucoraphanin treatment (36). Moreover, the oral administration of broccoli microgreens juice, at a dose of 20 g/kg/day, reduced body weight, white fat mass and liver fat in HFD-fed mice (37). Conversely, the ingestion of broccoli florets (10%) or stalks (10%) for 17 weeks, by mice fed with HFD did not affect final body weight, fat accumulation or liver weight (38). In another study, for mice fed a Western diet with 10% broccoli powder (equivalent to 0.4 mmol glucoraphanin/kg diet) for 31 weeks, the final body weight was not affected by broccoli supplementation (39). In rats fed a HFD diet, oral supplementation with broccoli extract, at a dose of 14 mg/kg/day reduced body weight gain, food efficiency, adiposity, and fatty liver (34). In our study, the number of adipocytes was not affected in any group. On the contrary, a study reported a significant decrease in the number of adipocytes in the HFD-fed group, which was reversed with the supplementation of broccoli microgreens juice (37). In the present study, the increase in adipocyte volume observed in the WD group was reversed by BF supplementation. Similarly, an increase in the volume and size of adipocytes was also reported in HFD-fed rodents, a trend that was reversed by the administration of sulforaphane, broccoli microgreens juice or broccoli extracts (20, 34, 37).
Diet-induced obese mice can develop liver fatty changes, a condition also referred to as hepatic steatosis, that can be alleviated by broccoli, glucoraphanin or broccoli microgreens juice supplementation (22, 34, 36, 37, 39). However, another study using broccoli florets or stalks in diet-induced obese mice reported no changes in hepatic steatosis (38). In our study, the WD group showed mostly diffuse liver fatty changes, which was significantly different from the CTR group. Despite the CTR+1.34BF group also significantly differing histologically from the CTR group, the liver fatty changes observed in this group were typically of focal distribution. Liver fatty changes and multifocal hepatitis were observed in all groups except the CTR group, but without statistical differences. These micro- and macrovacuolar changes are usually reversible (40). Multifocal hepatitis reflects minimal inflammation and is common in long-term studies and older animals, and may not be related to the different diets used in the present study.
A low body temperature is associated with obesity (41-43). Supplementation with natural compounds, such as ginseng, was shown to induce an increase in body temperature in mice fed a HFD (44). Another study showed that body temperature also increased in mice fed a HFD and supplemented with glucoraphanin-rich broccoli sprout extract (22). In our study, the WD group had a significantly lower body temperature than the CTR group. Although higher body temperatures were recorded in mice supplemented with BF than the WD group, those changes were not statistically significant. Unexpectedly, the lowest body temperature was recorded for the CTR+1.34BF group.
Obesity is linked to impaired muscle function and reduced strength in humans (45, 46). Muscle force can also be impaired in rodents fed with obesogenic diets (47-50). The grip strength is a reliable test able to discriminate muscle performance between chow-fed and HFD-fed mice (49); however, the muscle strength was not impaired in our mouse model, nor did BF supplementation induce significant changes in muscle strength in the animals.
Broccoli or glucoraphanin-rich extracts and broccoli microgreens juice were shown to reduce glucose levels and ameliorate glucose tolerance in diet-induced obese rodents (22, 34-37), although Zandani et al., using broccoli florets or stalks in diet-induced obese mice, reported no changes in glucose intolerance (38). In our study, the IPGTT was performed in the last week of the study, showing no development of glucose intolerance in our animal model. However, groups fed the Western diet had higher plasma glucose levels at the end of the study and BF supplementation failed to reduce those levels significantly.
Broccoli extract was shown to attenuate the lipid profile changes in TC, TG, HDL-c and LDL-c serum levels induced by HFD in mice (35). In another study, HFD-fed mice had no changes in plasma levels of TG and free fatty acids, only an increase in plasma TC, and supplementation with glucoraphanin-rich broccoli extract did not affect this lipid profile (22). In mice, HFD increased the serum levels of TC, TG, HDL-c and LDL-c, but treatment with broccoli significantly reduced the levels of TC, TG and LDL-c, while glucoraphanin only significantly reduced the TC level (36). A more recent study showed that serum levels of TC and LDL-c were increased in mice fed a HFD, with no significant changes in TG and HDL-c levels (37). However, supplementation with broccoli microgreens juice significantly reduced serum TG and LDL-C levels (37). According to our results, no experimental group had dyslipidemia, including the WD group. This was not expected since a Western diet induces alterations in the blood lipid profile (23, 51). Nevertheless, since the formulations of the diets used in the animal models of diet-induced obesity are not standardized and differ from each other, the differences between studies may be influenced by this factor.
Concerning the microhematocrit, neither a Western diet nor BF supplementation induced significant changes between groups, with all values within the physiological range (52). This result is in agreement with a study with mice showing no differences in hematocrit values after 12 weeks on a HFD diet. However, in the same study, mice hematocrit significantly decreased after 24 weeks of HFD (53). Currently, there is no consensus regarding the relationship between obesity and anemia, with studies in obese subjects correlating a decrease in hematocrit with an increase in body mass index, and other studies demonstrating the opposite or no relationship (54, 55).
Among Brassica oleracea species, broccoli was shown to have the highest content in total phenols and flavonoids (12), which is linked to the high antioxidant potential of this crop. In our broccoli plants, the leaves presented the highest content of total phenols (11.76±1.82 mg gallic acid/g DW), ortho-diphenols (46.16±6.18 mg gallic acid/g DW) and flavonoids (9.11±4.05 mg catechin/g DW), and showed higher antioxidant capacity (0.0183±0.0027 mmol Trolox/g DW and 0.0573±0.0102 mmol Trolox/g DW for 2,2-azinobis (3-ethylbenzothiazoline-6-sulfonic acid) diammonium salt assay and 2,2-diphenyl-1-picrylhydrazyl assay, respectively) compared to the inflorescences and stalks, these differences being significant (p<0.05) (Supplementary Figure 3). These results are in accordance with a previous study showing that leaves from different cultivars of broccoli had the highest total phenolic contents and the highest antioxidant activities followed by inflorescences and then stalks (56). In our study, the Western diet led to an increase in the activity of liver SOD but BF supplementation did not lead to further alteration. Interestingly, BF per se also led to an increase in SOD and GST activity, suggesting that BF enhances the basal antioxidant response. We also observed an induction of liver GST in a previous experiment with healthy mice supplemented with BF (18). This may be explained by the fact that broccoli plants are rich in glucoraphanin, the precursor of sulforaphane (13, 57), which in turn is an inducer of liver GST (58). In another study, HFD also led to a compensatory increase in gene expression of SOD, catalase and GPx in the liver of mice, however, glucoraphanin supplementation did not further increase the expression of these genes nor did it induce changes per se (22). Also, the HFD led to an increase in hepatic levels of malondialdehyde, a marker of LPO, which was attenuated by glucoraphanin (22). According to another study, mice fed a HFD showed an increase in LPO and a decrease in SOD and catalase activities in the liver, and the supplementation with broccoli or glucoraphanin was able to counteract these changes (36). Broccoli microgreens juice also attenuated the HFD-induced increase in LPO in mouse liver, however, there were no changes in SOD activity by either HFD or broccoli microgreens juice (37). In our study, the hepatic oxidative stress markers in the experimental groups did not change compared to the control group.
In conclusion, the use of broccoli by-products as a supplement may be a candidate to fight diet-induced obesity, reducing body weight and fat tissue accumulation. The production of functional foods with this type of flour may be a promising approach. Nevertheless, BF supplementation per se can also lower body temperature, increase liver weight and induce hepatic steatosis, while counteracting these effects by increasing the hepatic antioxidant response. Thus, it is important to further investigate an adequate dose for human consumption without the risk of toxic effects due to long-term exposure. Rodent models of diet-induced obesity reproduce dietary imbalances in humans, the most common cause of obesity. However, these models have some limitations, such as the lack of standardization of feeding protocols and diets, often leading to inconsistent results among similar studies (59). Moreover, care must be taken with the interpretation of results obtained from preclinical animal models, as doses and administration protocols are often not comparable between experimental animals and humans, it is difficult to mimic the complexity of human diseases, and the effective doses are different due to differences between species (60). Another limitation is the variability of concentrations of beneficial compounds present in plant material, as they may vary according to different climatic conditions and between growing seasons and different cultivars (61).
Acknowledgements
This work was funded by the Portuguese Foundation for Science and Technology (FCT) and co-financed by the European Regional Development Fund (FEDER) through COMPETE 2020 - Operational Competitiveness and Internationalization Programme (POCI), grant PTDC/ASP-HOR/29152/2017, POCI-01-0145-FEDER-029152 (VALORIZEBYPRODUCTS). This work was also supported by National Funds by FCT - Portuguese Foundation for Science and Technology, under the project UIDB/04033/2020.
Footnotes
Authors’ Contributions
Martins T, Venâncio C, Colaço B, Oliveira PA and Antunes LM conceived and designed the experiments. Martins T, Leite R, Matos AF, Soares J, Pires MJ, Pinto ML, Neuparth MJ, Sequeira AR, Félix L, Monteiro SM, Gouvinhas I, Barros AI and Oliveira PA performed the experiments. Pinto ML, Neuparth MJ, Monteiro SM and Barros AI contributed with reagents/materials/analysis tools. Martins T, Pinto ML, Monteiro SM and Gouvinhas I analyzed the data. Martins T wrote the article. Pires MJ, Pinto ML, Félix L, Monteiro SM, Venâncio C, Gouvinhas I, Oliveira PA and Antunes LM revised the article. Rosa E was responsible for funding acquisition. All Authors have read and approved the final article.
Supplementary Material
Supplementary methods available at:<https://drive.google.com/file/d/1FgIKZG5SF2emZ_z536hs48U9XUfDtviy/view?usp=sharing>
Supplementary Table I available at:<https://drive.google.com/file/d/18P_L0944XZWxjbBaBsUnV8eaaNeoOWE7/view?usp=sharing>
Supplementary Figure 1 available at:<https://drive.google.com/file/d/1c6wosJxp4FUxiqKiLjodiWGsOLMBGNxM/view?usp=sharing>
Supplementary Figure 2 available at:<https://drive.google.com/file/d/1t2oqYR-gUYJeJqYfddaQENJT569-6wQz/view?usp=sharing>
Supplementary Figure 3 available at:<https://drive.google.com/file/d/1YoAP_H_gjWBqkXFu0TCIIKPPbCaG9Gz3/view?usp=sharing>
Conflicts of Interest
The Authors declare that they have no competing interests.
- Received May 17, 2022.
- Revision received June 23, 2022.
- Accepted July 13, 2022.
- Copyright © 2022, International Institute of Anticancer Research (Dr. George J. Delinasios), All rights reserved
This article is an open access article distributed under the terms and conditions of the Creative Commons Attribution (CC BY-NC-ND) 4.0 international license (https://creativecommons.org/licenses/by-nc-nd/4.0).