

Abstract
Background/Aim: Lack of interchangeability between prostate-specific antigen (PSA) assays could have a clinical impact. We compared PSA assays from different manufacturers and calibrations. Patients and Methods: A total of 233 men who underwent prostate biopsy (PSA: 2-10 ng/ml; Beckman Coulter Access® Hybritech® as reference) were enrolled. Total (tPSA) and free PSA (fPSA) were also measured using the Roche cobas® and the Abbott Architect® methods. Results: Roche tPSA values were ≈1% higher than Beckman, while Abbott values were ≈5% lower. Roche had the highest diagnostic sensitivity (92%) compared to Beckman Coulter (87%) and Abbott (85%). Roche fPSA was ≈3% lower and Abbott ≈17% higher than that of Beckman. For the percentage of fPSA, Roche had the highest sensitivity (98%). Conclusion: Roche cobas® and Beckman Coulter Access® Hybritech® tPSA were almost interchangeable. While the agreement was acceptable for tPSA, this did not happen with fPSA and greater efforts for harmonization are required.
- Method comparison
- prostate cancer
- total PSA
- free PSA
- hybritech calibration
- WHO calibration
Serum prostate-specific antigen (PSA) has been widely used for the detection and monitoring of prostate cancer (PCa) (1, 2), since the end of 1980s (3). After the identification of PSA in 1979 (4), several immunoassays for its quantification in serum have been developed (5). Currently available commercial assays for the measurement of total PSA (tPSA) and free PSA (fPSA) are based on the immunochemical quantification of the circulating free and complexed to α1-antichymotrypsin forms of PSA (6-8). The free-to-total serum PSA ratio, usually given as a percentage (%fPSA), has been proposed to differentiate benign from malignant prostate disease, improving specificity while maintaining sensitivity, especially in the diagnostic gray zone of tPSA: 4-10 ng/ml (9).
The lack of assay interchangeability could have a significant clinical impact with respect to the clinical interpretation of PSA and biopsy recommendations (10). The main reasons for assay variability were the non-equimolar detection of tPSA and the non-uniform assay calibration (11). In 1999, after the 2nd Stanford Conference on the International Standardization of PSA assays, the World Health Organization (WHO), in order to reduce the inter-assay variability across manufacturers, developed a standard for the calibration of tPSA assays (WHO 96/670 standard), based on an equimolar ratio of 90:10 of complexed to fPSA and a separate standard for fPSA (WHO 96/668 standard) (12).
However, the multicenter studies that have been carried out to establish a clinical cut-off of 4 ng/ml for tPSA as a discriminant value to recommend prostate biopsy were not based on WHO calibrated assays. Instead, they were based on analytical methods – Tandem-R and Tandem-E – with the Hybritech calibration (13). Gradually, assay manufacturers have replaced their own calibrators with calibrators related to the WHO reference materials (6, 8). In general, the use of the WHO calibration has been reported to yield tPSA and fPSA values about 20-25% lower than those obtained with the Hybritech calibration (14, 15). This bias may lead to significant clinical misinterpretation and may have a clinical impact on the detection of PCa. Although this bias between different assays has been significantly reduced, several studies point out that the results are still not interchangeable for tPSA or fPSA between manufacturers (8, 16-18).
The main objective of the study was to compare three commonly used tPSA and fPSA assays from different manufacturers, and with different calibrations (Hybritech and WHO based), and to evaluate the potential clinical impact of the differences in PCa detection.
Patients and Methods
Study design and participants. In this observational study, 233 patients scheduled for prostate biopsy for suspected PCa at the Urology Department of the Central Lisbon University Hospital Center were enrolled between December 2017 and October 2019. The study, which complies with the Declaration of Helsinki, was approved by the Institution’s Research Ethics Committee, and all participants provided written informed consent. All enrolled patients had a tPSA concentration between 2 and 10 ng/ml (Beckman Coulter Access® Hybritech®, which we considered as the reference PSA, i.e., the designated comparison method), and were submitted to a prostate biopsy with at least 12 cores. We chose this tPSA range not only to include the clinical cut-off of 4 ng/ml, but also to encompass the tPSA range that poses most diagnostic challenges when screening and diagnosis of PCa is being made (19). The exclusion criteria were a previous history of PCa and factors that could affect the PSA concentration, namely, previous transurethral resection of the prostate, therapy with drugs that may affect PSA concentration (5-α-reductase inhibitors and androgens), urinary infection contemporary to blood collection for PSA determination, and acute bacterial prostatitis in the three months prior to the biopsy. Heavily hemolyzed samples were excluded from the analysis. tPSA and fPSA concentrations were measured in all samples using assays from three different manufacturers, with different calibrations: Beckman Coulter Access® Hybritech® (Hybritech calibrated), Abbott Architect® (WHO calibrated), and Roche cobas® (WHO calibrated).
In this study, we followed the Clinical and Laboratory Standards Institute (CLSI) guidelines for procedure comparison and bias estimation using patient samples (20).
Blood collection and analyses. For all samples, Abbott Architect® tPSA (ref. no. 7K70), and fPSA (ref. no. 7K71) were performed within 3 h after blood collection; %fPSA was subsequently calculated according to the formula: (fPSA/tPSA)×100. For each sample, two 500 μL aliquots were made within 4-8 h after blood collection and stored at –80°C. These aliquots were used for PSA assays using the Beckman Coulter Access® Hybritech® (tPSA, ref. no. 37200; fPSA ref. no. 37210) and the Roche cobas® (tPSA, ref. no. 04641655; fPSA ref. no. 03289788) methods. They were thawed only once, and the measurements were performed within 4 h of thawing. Care was taken with storage times and temperatures, because it is well known that these are important factors in PSA stability, mostly concerning fPSA stability (21, 22).
The Abbott Architect® PSA determinations were made on the Architect i2000sr immunoassay system (Abbott Laboratories, Abbott Park, IL, USA), Roche cobas® PSA on the Roche cobas e411 analyzer (Roche Diagnostics, Basel, Switzerland), and Beckman Coulter Access® Hybritech® PSA determinations on the Beckman Coulter Access 2 immunoassay analyzer (Beckman Coulter, Brea, CA, USA). Testing was performed according to the manufacturers’ instructions.
Two levels of commercial quality control solutions were assayed, previously to the study samples, on each of the immunoassay analyzers (BioRad® Liquichek™ Immunoassay Plus on the Abbott Architect i2000sr system; Roche PreciControl™ Tumor Marker on the Roche cobas e411 analyzer; Beckman Coulter Access® 2 Hybritech® PSA Quality Control on the Beckman Coulter Access 2 analyzer). All values of the quality control tests were within the range of one standard deviation below or above the mean.
Statistical analysis. The Beckman Coulter Access® Hybritech® tPSA and fPSA assays, as well as the corresponding calculated %fPSA, were selected as the reference methods for statistical analysis purposes, since they used the same calibration (Hybritech) that was applied in the studies that established a clinical cutoff of 4 ng/ml for tPSA, which corresponds to the original assay developed for tPSA, and to the first US Food and Drug Administration (FDA) approved assay for use in PCa detection (3, 13).
For comparison of the different methods, we used linear regression analysis and calculated the Pearson correlation coefficient (r) (23). We also followed the approach proposed by Bland and Altman to analyze the agreement between the measurements using the three assays (24). We calculated the mean difference between the measurements from two manufacturers (Abbott versus Beckman Coulter and Roche versus Beckman Coulter) to estimate bias (d), reported as the mean±standard error of the mean (SEM). The precision was defined by the limits of agreement, or the 95% confidence intervals of the bias, reported as d±1.96 s, where s is the standard deviation of the differences. We present the corresponding Bland-Altman plots.
The predictive accuracy of the biomarkers (PSA and %fPSA) was quantified as the area under the receiver operating characteristic curve (AUC) for each of the three methods. Statistical significance was defined as a two-sided p-Value <0.05. Continuous variables were reported as mean and standard deviation (SD), if normally distributed, or as median and interquartile range (IQR) if non-normally distributed.
Statistical analysis was performed using IBM® SPSS® Statistics 26.0 (IBM Corp., Armonk, NY, USA, 2019). Positive and negative predictive values, as well as the Bland-Altman and linear regression plots, were calculated using MedCalc® Software version 14.8.1 (MedCalc Software Ltd., Ostend, Belgium).
Results
A total of 233 men fulfilled the inclusion criteria, of which 99.6% (n=232) were Caucasian. Overall, patients had a median age of 67.00 (IQR=61.00-72.50) years. Among the enrolled patients, 49.4% (n=115) did not have cancer on biopsy, and 50.6% (n=118) were diagnosed with PCa. The median age of participants without cancer was 65.00 (IQR=60.00-71.00) years, and cases with PCa had a median age of 69.00 (IQR=62.75-73.00) years. Table I presents the distribution of tPSA, fPSA and %PSA values obtained by the three manufacturers.
Distribution of tPSA, fPSA and %fPSA values for each method/manufacturer and method comparison data.
There was a good correlation between the Beckman Coulter tPSA and the other two tPSA methods, as shown by the Pearson’s correlation coefficient (r=0.96 between Beckman and Abbott; r=0.98 between Beckman and Roche) (Table I). Linear regression analysis showed that the Roche tPSA assay resulted in similar levels (only ≈1% higher, since the intercept is close to zero) to the Beckman Coulter tPSA, while the Abbott assay results were 5% lower (Figure 1). The Bland-Altman analysis confirmed that the differences were smaller between Beckman Coulter and Roche (Figure 2, Table I). In addition, the predictive accuracy of tPSA, evaluated by the AUC, was similar among the three manufacturers (Figure 3, Table II), since there were no significant differences between the AUC for Roche and Beckman Coulter tPSA (p=0.268) and between the AUC for Abbott and Beckman Coulter (p=0.267) and Abbott and Roche tPSA (p=0.451).
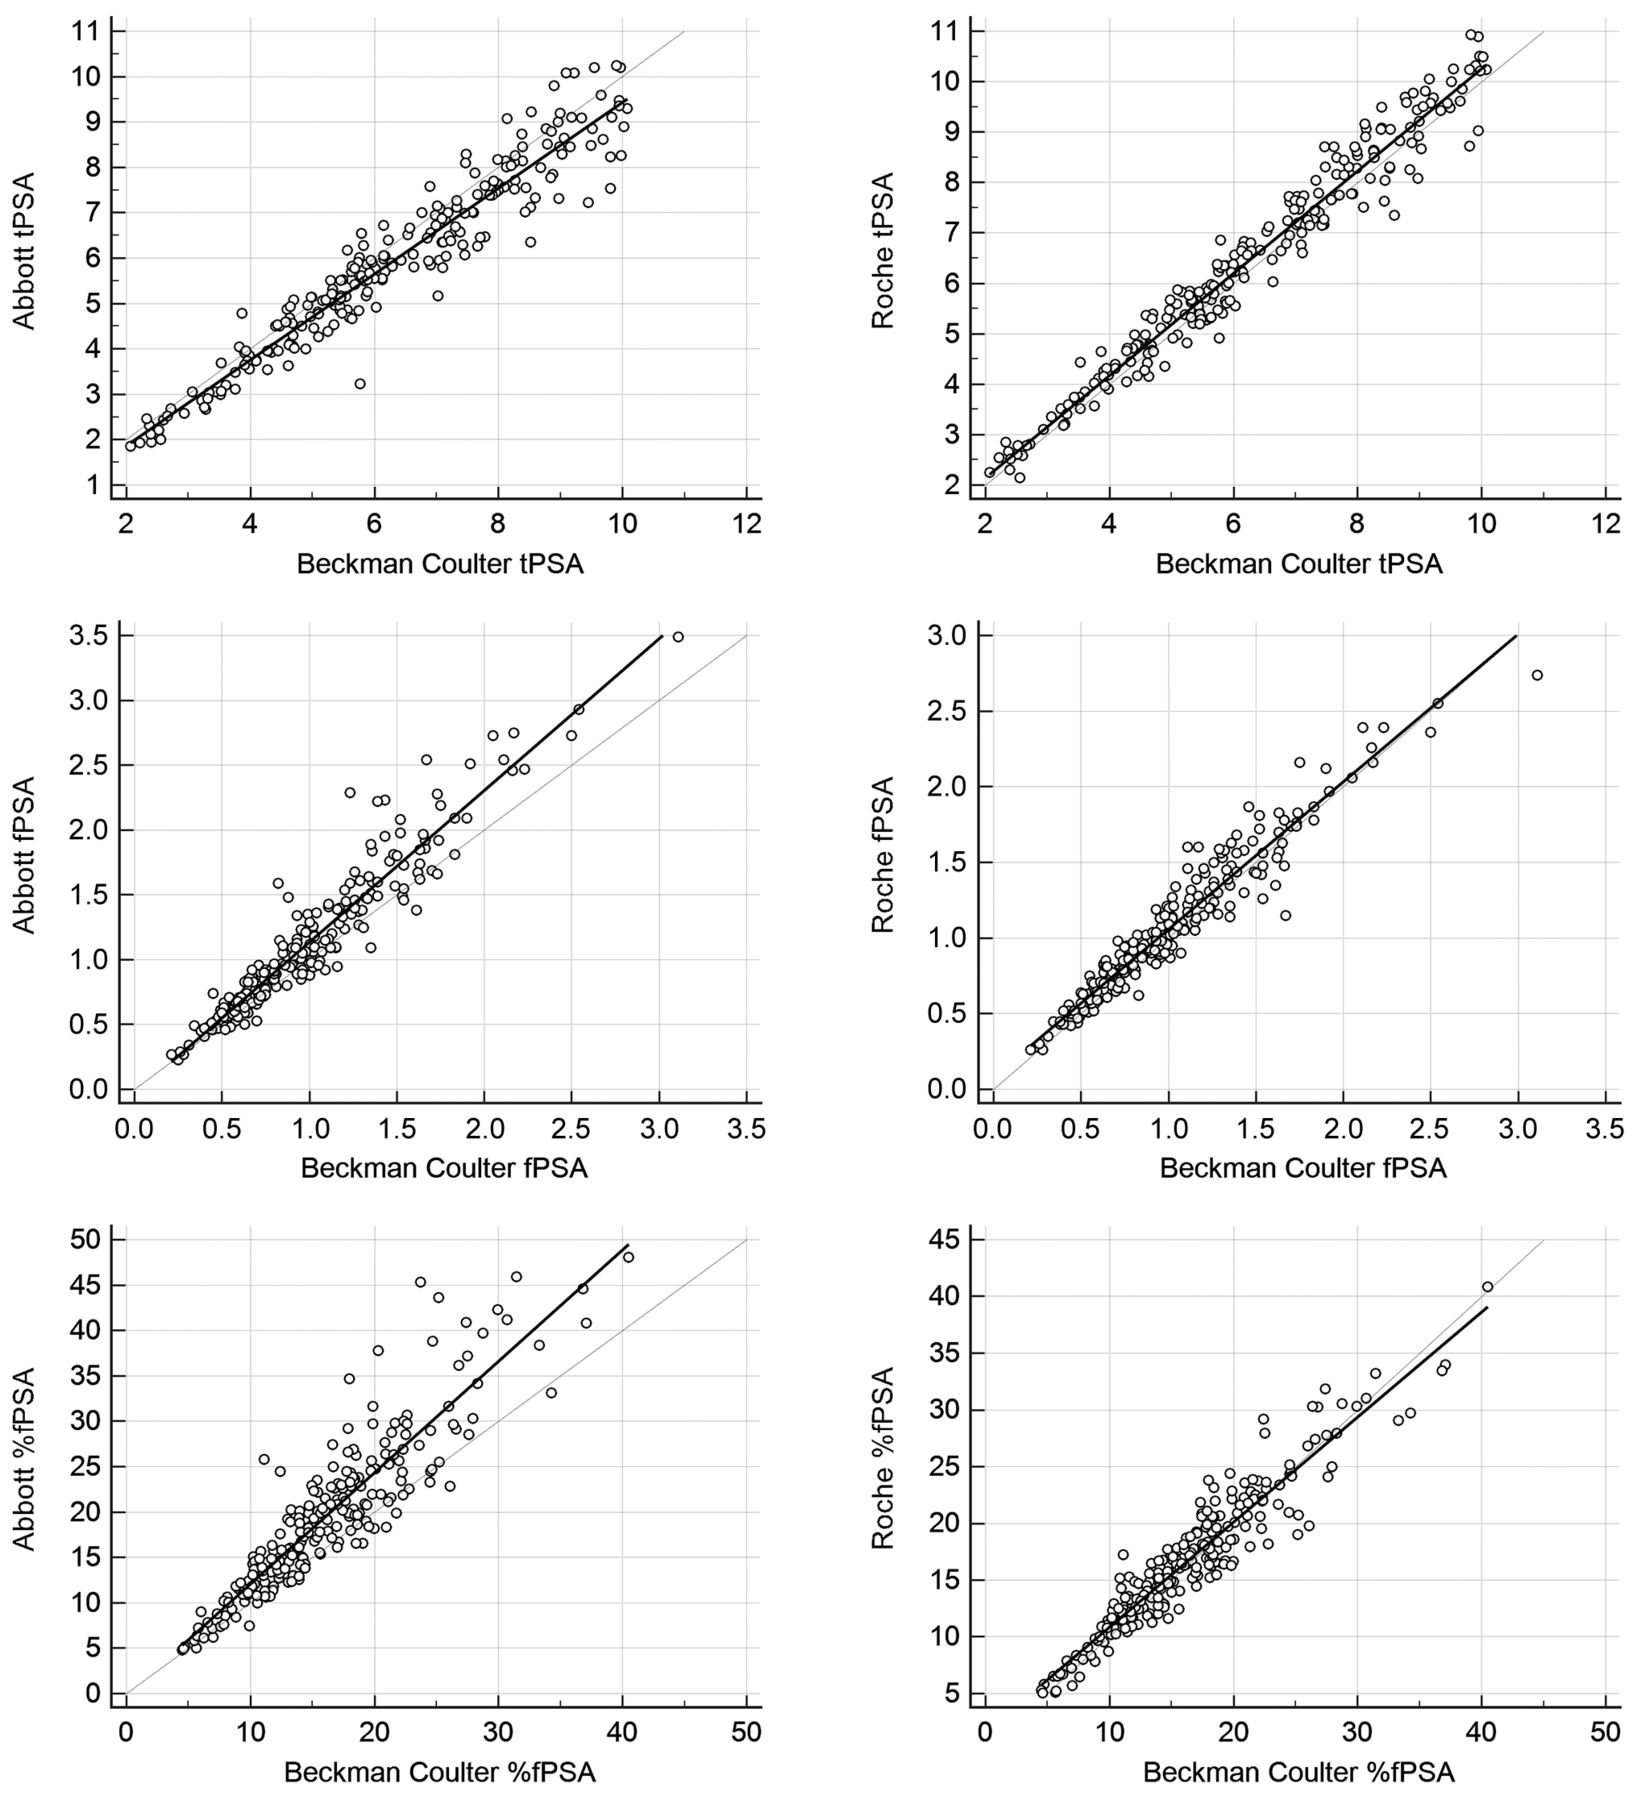
Linear regression analyses for Abbott and Roche tPSA, fPSA and %fPSA values against the Beckman Coulter Access® Hybritech® method.

Bland-Altman’s bias and precision plots for tPSA, fPSA and %fPSA by the three methods.
Diagnostic performance evaluation of tPSA and %fPSA by the three methods, considering the commonly used cutoffs.
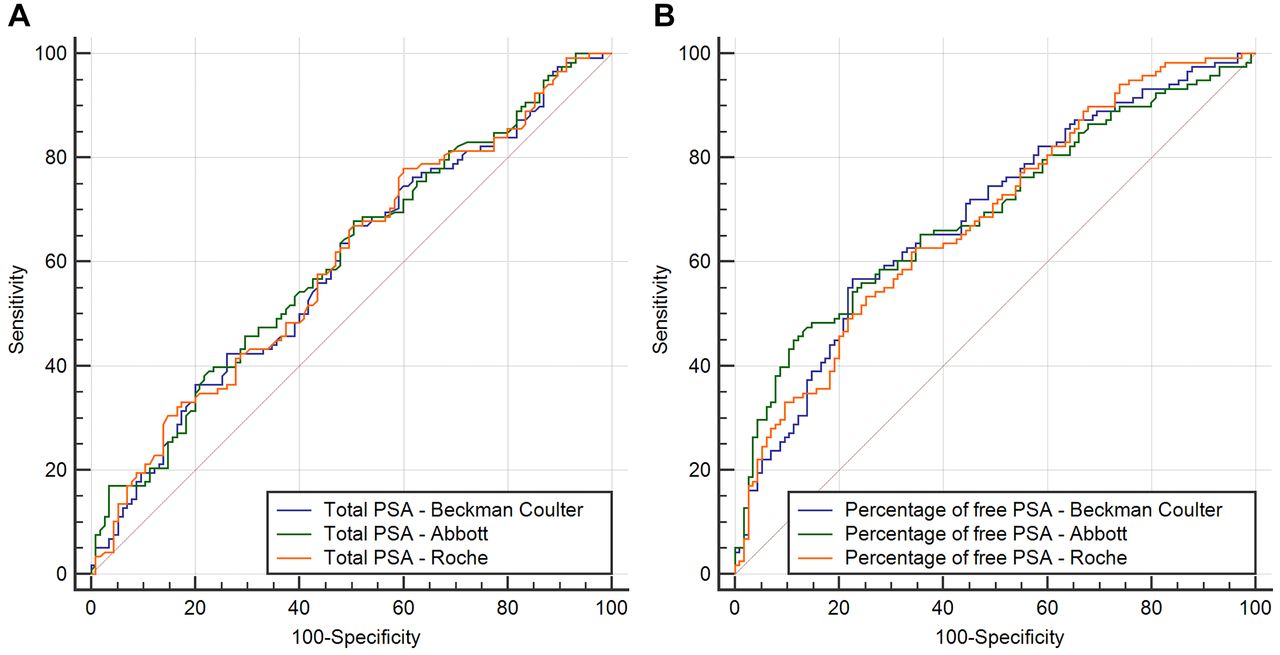
Receiver operating characteristic curves for: (A) Total prostate-specific antigen (PSA); (B) the percentage of free PSA, with the three methods.
Considering fPSA, the median was quite similar for the three methods – 0.93 ng/ml (Beckman Coulter), 0.98 ng/ml (Abbott) and 0.94 ng/ml (Roche) – being almost the same for Beckman and Roche. The Pearson’s correlation coefficient was 0.95 between Beckman and Abbott and 0.96 between Beckman and Roche, respectively (Table I). The Roche fPSA assay results were approximately 3% lower than the Beckman Coulter assay, while the Abbott fPSA results were approximately 17% higher than the Beckman Coulter fPSA values. The Bland-Altman analysis (Figure 2) revealed a higher bias between Beckman Coulter and Abbott (-0.14±0.01) than between Beckman Coulter and Roche (0.06±0.01).
The median levels of %fPSA were 15.44% (Beckman Coulter), 18.93% (Abbott), and 16.27% (Roche) (Table I). Although the Pearson’s correlation coefficient was high (r=0.95) between Beckman Coulter and both Abbott and Roche, the regression analysis showed more pronounced differences between the manufacturers. With Abbott, %fPSA being approximately 23% higher than with Beckman Coulter (plus the 1.63 intercept value), while the Roche %fPSA results were 7% lower than the Beckman Coulter %fPSA results. The larger differences between Abbott and Beckman Coulter were corroborated by the Bland-Altman analysis results (Figure 2) for precision (95% CI=–11.20-4.19) and bias (–3.50±0.26).
The %fPSA calculated with the tPSA and fPSA given by the three manufacturers had similar predictive accuracies, since the AUCs were similar for the three methods (Figure 3; Table II). There were no significant differences between the AUCs (Beckman versus Abbott: p=0.814; Beckman versus Roche: p=0.697; Abbott versus Roche: p=0.548).
Discussion
Our results show that there is a good alignment between the three evaluated tPSA assays, not only metrologically but also in terms of their clinical performance. However, this good agreement between tPSA methods is better between the Beckman Coulter Access® Hybritech® and the Roche cobas® methods than between the Beckman Coulter Access® Hybritech® and the Abbott Architect® methods. The tPSA Roche values were only approximately 1% higher than those of Beckman Coulter, while the Abbott values were approximately 5% lower. Based on the slope of the linear regression analysis, Stephan et al. also found the Roche tPSA results to be 1% higher than the Beckman Coulter Hybritech® values. These authors also verified that the Abbott tPSA values were lower than those of Beckman Coulter, although with a greater difference (≈13% lower). However, they used the older Abbott AxSYM® PSA assay (25), while we used the more recent Abbott Architect® PSA assay. Most noticeably, the small differences that we found between the WHO-calibrated PSA assays and the Hybritech-calibrated assay are quite far from the 20-25% lower values that have been reported when comparing Beckman Coulter Hybritech® assays with Beckman Coulter WHO calibrated assays (14). Hence, we can hypothesize that the manufacturers that have calibrated their assays against the WHO 96/670 standard may have introduced factors in their calibration curves in order to promote better alignment with the Hybritech PSA. This may have been done because the first FDA-approved PSA assay was Hybritech-calibrated and because the Hybritech calibration was the one used in the large multicenter prospective study, where more than 6,600 men were evaluated to establish a worldwide accepted cutoff of 4 ng/ml (13, 14).
The trend towards an improvement in the harmonization between different PSA assays can also be seen through external quality assessment (EQA) schemes. For instance, the mean coefficients of variation in the United Kingdom National External Quality Assessment Service (UK NEQAS) scheme for PSA, observed across all methods, decreased from more than 20% in 1995 to approximately 9.5% in 2005, which also happened with other EQA providers (26-28).
The good interchangeability that we have found metrologically between the three tPSA assays reflects on similar diagnostic performances, although with some differences between them. There were no significant differences between the AUC values, in the PSA range between 2 to 10 ng/ml, and the PPVs were almost the same (≈52%) for the three methods when considering the commonly used cutoff of 4 ng/ml. However, when looking at diagnostic sensitivities, as well as to the NPV and the number of missed PCa, the Roche method had a slightly better clinical performance (sensitivity=92.4%; NPV=65.38%; missed PCa=8%) than the Abbott method (sensitivity=84.7%, NPV=56.10%, missed PCa=15%), or even the Beckman Coulter method (sensitivity=87.3%; NPV=55.88%; missed PCa=13%). This shows that despite the effort of standardization brought by the WHO standards, there are still some differences between the tPSA assays. In fact, assay calibration may only be partially responsible for the differences between the assays. The interassay variability can be explained by several factors, including matrix differences between serum samples and the WHO buffer-based reference materials, which are used to assign values to the assay calibrators. Anti-PSA antibodies can have different affinities and reactivities in buffer- or in serum-based samples (29). Moreover, the use of anti-PSA antibodies with different epitope specificities and affinities for several forms of fPSA and complexed PSA has also been recognized as a cause for the lack of agreement between assays. PSA contains six major epitope regions, and it is important to know the epitopes of the antibodies used in the assays. In addition, anti-PSA antibodies can bind to human kallikrein 2 (hK2), which shares approximately 80% similarity with PSA at the amino acid level (30).
Concerning fPSA, we found larger differences between the methods, both in the linear regression and in the Bland-Altman analysis, which is consistent with the results of previously published studies (8, 18, 31). Similar to the results of the tPSA assays, the differences were more pronounced between Beckman Coulter and Abbott than between Beckman Coulter and Roche. In this respect, it is interesting to note that the Roche cobas® fPSA is standardized against the WHO 96/668 reference preparation, while the Abbott Architect® fPSA is based on the WHO 96/670 standard (8). This fact could, at least in part, explain the greater discrepancies in Abbott fPSA. The slope of Roche fPSA was only 0.97, and the slope of Abbott fPSA was 1.17, meaning that the Roche fPSA was approximately 3% lower than the Beckman Coulter fPSA, while the Abbott fPSA was approximately 17% higher than the Beckman Coulter fPSA. Interestingly, the slope that we found between the Roche and Beckman Coulter fPSA is exactly the same as that reported by Stephan et al. (25).
When looking at the %fPSA obtained by the three methods, the differences are even bigger than those observed with fPSA, which is also in concordance to what other authors have already reported (18, 25). These larger differences were shown not only by the slope and intercepts calculated through linear regression, but also by the wide limits of agreement (values of 95% CI for precision) in Bland-Altman’s analysis. Once more, the differences were more pronounced for Abbott than for Roche, when compared to Beckman Coulter.
Not surprisingly, these differences had an impact on the clinical performance of %fPSA, when comparing the three methods. Although the values of the AUC were quite similar (between 0.684 and 0.694), Abbott had the lowest sensitivity (86%) and Roche had the highest sensitivity (98%), closer to Beckman Coulter’s sensitivity (95%), considering the commonly used cutoff of 25%. PPVs were similar (53%-55%) among the three methods, but the differences in the NPVs were larger (Abbott: 67%; Beckman Coulter: 71%; Roche: 89%). The lower NPV of the Abbott %fPSA means that a larger number of cases would be misclassified as negative for PCa. The better diagnostic performance of Roche %fPSA translated into a lower percentage of missed PCa (≈2%) than that observed with Abbott (≈14% of missed PCa). The amount of missed PCa with Beckman Coulter (≈5%) was much more similar to the value observed with Roche.
We believe that one of the main strengths of this study, is that it shows that the use of WHO-calibrated PSAs does not necessarily imply lowering the usual cut-off for recommending a prostate biopsy. Other authors had previously suggested that the usual cutoff of 4 ng/ml should be reduced to 3.1 ng/ml when PSA is measured with WHO-calibrated assays (14). Our study shows that this does not hold true for all WHO-calibrated PSA assays, namely the Roche cobas® and the Abbott Architect® assays. However, and according to studies comparing WHO- and Hybritech-calibrated PSA assays from Beckman Coulter, the observed difference of 20-25% between them could justify reducing the cut-off when using WHO-calibrated PSA from Beckman Coulter (14, 15). In fact, a limitation of this study is that the Beckman Coulter WHO-calibrated PSA assays were not evaluated.
In summary, despite the different calibrations (WHO versus Hybritech), within the 2-10 ng/ml PSA range, there is an acceptable agreement between the three manufacturers in terms of the tPSA assays, especially between Beckman Coulter and Roche, making these two tPSA methods almost interchangeable. For fPSA assays, the differences between methods are more significant, meaning that further harmonization efforts are required. The results of %fPSA showed high differences between methods, with an impact on their clinical performance. Roche cobas® tPSA and fPSA assays were more aligned with the Beckman Coulter Access® Hybritech® assays than the Abbott Architect® assays. When considering the commonly used cutoffs of 4 ng/ml and 25%, respectively, the Roche cobas® tPSA and %fPSA results had the best diagnostic performance of the three evaluated methods, with higher sensitivities, higher NPVs, and lower numbers of missed PCa.
Footnotes
This article is freely accessible online.
Authors’ Contributions
The Authors confirm their contribution to the paper as follows: study conception and design: Manuel M. Garrido; data collection: Manuel M. Garrido; analysis and interpretation of results: Manuel M. Garrido and Ruy M. Ribeiro; draft manuscript preparation: Manuel M. Garrido and José C. Marta; critical review of the manuscript: Stefan Holdenrieder, Ruy M. Ribeiro, João T. Guimarães and Luís C. Pinheiro. All Authors approved the final version of the manuscript.
Conflicts of Interest
The Authors declare no conflicts of interest related to this study.
- Received July 29, 2021.
- Revision received August 29, 2021.
- Accepted September 22, 2021.
- Copyright © 2021 International Institute of Anticancer Research (Dr. George J. Delinasios), All rights reserved