

Abstract
Background/Aim: The quantitative evaluation of fat tissue, mainly for the determination of liver steatosis, is possible by using dual-energy computed tomography. Different photon energy acquisitions allow for estimation of attenuation coefficients. The effect of variation in radiation doses and reconstruction kernels on fat fraction estimation was investigated. Materials and Methods: A six-probe-phantom with fat concentrations of 0%, 20%, 40%, 60%, 80%, and 100% were scanned in Sn140/100 kV with radiation doses ranging between 20 and 200 mAs before and after calibration. Images were reconstructed using iterative kernels (I26,Q30,I70). Results: Fat fractions measured in dual-energy computed tomography (DECT) were consistent with the 20%-stepwise varying actual concentrations. Variation in radiation dose resulted in 3.1% variation of fat fraction. Softer reconstruction kernel (I26) underestimated the fat fraction (–9.1%), while quantitative (Q30) and sharper kernel (I70) overestimated fat fraction (10,8% and 13,1, respectively). Conclusion: The fat fraction in DECT approaches the actual fat concentration when calibrated to the reconstruction kerneö. Variation of radiation dose caused an acceptable 3% variation.
- Dual-energy computed tomography
- fat fraction
- radiation dose
- reconstruction kernel
- photon energy
Dual-energy computed tomography (DECT) has been applied increasingly in clinical routines over recent years (1, 2). Its application in clinical routine is mainly focused on material differentiation (e.g. bones, vessels, calcified plaqwies, bone marrow) and material optimization (e.g. metal artefact reduction) (3). Based on the technical concept, materials are simultaneously or consecutively scanned under two energy spectra (4). Material-specific information can be extracted in DECT based on the variance of the attenuation coefficient matrices within the different energy spectra. Unlike DECT, Hounsfield units (HU) measured in single energy computed tomography (SECT) show significant overlap for different tissue types and thus, tissue differentiation is poor.
Two primary physical phenomena result in material attenuation measured in DECT: the photoelectric effect and Compton scattering. The reconstruction kernels, also referred to as the filter, algorithm or computationally intensive algorithms are used to modify the frequency content of the image data prior to back projection during image reconstruction in computed tomography (CT). Reconstruction kernels are one of the most critical parameters affecting image quality; adjust the spatial resolution and affect the image quality by sharpening or softening the image (5). Different kernels exist for evaluating different anatomical structures, i.e., soft tissue and bones. Application of different kernels may affect the attenuation measurements in SECT, especially for tissues with extremely low or high attenuation values taking, for example, water as the reference with 0 HU (6-9). A smooth kernel generates images with relatively low noise, but relatively low spatial resolution. A sharp kernel generates images with higher spatial resolution, but increased image noise. So as the spatial frequency of a reconstruction kernel increases, i.e., as the kernel sharpens, edge-ringing artifacts appear and image noise increases, which broadens the distribution of the attenuation values derived from the CT-image (5, 6). Thus, softer kernels have been generally recommended for accurate attenuation measurements and their subsequent comparisons, such as for the assessment of pulmonary emphysema (10). Additionally, the attenuation of coronary atherosclerotic plaques and femur is higher in softer reconstruction kernels and lower in sharper ones (11, 12).
Among the different DECT applications described in the literature, the quantitative evaluation of fat tissue, mainly for the determination of liver steatosis, has become a particular research focus (13-19). By using various previous methods, the objective quantitative assessment of the fat fraction (FF) in the liver has been examined. These assessments have been performed by DECT measurements of fat phantoms (13-15), animals (16), or clinical samples (17, 18). The fat content of adrenal lesions has also been evaluated (19). However, the relationship between FF analysis and the application of different radiation doses and algorithms for image reconstruction has not been examined.
In this phantom study, we investigated the possible effects of different radiation dose levels and reconstruction kernels in DECT-based FF analysis for radiological fat tissue quantification. Our results may contribute to further research enabling automated identification of organs and detection of diseased tissue.
Materials and Methods
Phantom preparation. A phantom was prepared at the hospital pharmacy consisting of six fat-containing plastic probes of 30 g with concentrations varying from 0% to 100% with 20% increments (Figure 1, concentration of fat probes: 0%, 20%, 40%, 60%, 80% and 100%). Each probe was composed of an emulsion that included the corresponding fat portion consisting of castor oil (originating from Ricinous cummunis) and pure water (substitutes for pure soft tissue/liver tissue and for pure fat tissue, respectively). Polysorbate 80 and sorbitan monostereate 60 were added to the incremental probes as emulsifiers to ensure that the emulsions were stable and homogenous and therefore preventing any material separation or floating of the oil, which would impede reliable FF measurements in DECT. Concentration of castor oil increased in 6 g steps and emulsifiers in 0.12 g steps. Incremental probes were completed with pure water to 30 probes.

Six fat-containing probes with fat concentrations varying from 0% to 100% with increments of 20% were prepared.
Phantom scanning. DECT of the phantom probes was performed by using a dual-source CT SOMATOM Definition Flash scanner (Siemens Healthineers, Forchheim, Germany). The probes were centered in the gantry using laser navigation. The following scanning parameters were applied with fixed scan parameters and varied tube current: Sn140/100 kV, ref. mAs 20/40/60/80/100/120/140/160/180/200, rotation time 0.5 s, pitch 1.0 and collimation 128×0.6 mm. Tube voltage adaption and tube current modulation were deactivated.
Post-processing – application of different reconstruction algorithms and FF measurements. The raw data obtained by all scans of the various tube current combinations were used for reconstructions using three iterative reconstruction kernels in a standardized 512 matrix: I26 (soft), I70 (very sharp) and the last generation dual energy dedicated iterative Q30 kernel (medium sharpness), Advanced Modeled Iterative Reconstruction – ADMIRE by Siemens Healthineers. The coding “I” of the kernels refers to SAGIRE (sonogram affirmed iterative reconstruction) processing. The coding “Q” refers to a specifically quantitative DECT kernel of the specific vendor. Images were evaluated by Syngo.via® software for multimodality readings (Syngo.via Dual Energy, Siemens Healthcare GmbH 2009-2018, Version 05.01.000.0030, Forchheim, Germany).
A reader with four years of experience in cross-sectional imaging performed the attenuation and FF measurements using the commercially available software Syngo.via® (Siemens Healthineers) and the “Liver VNC” application profile. The reader was free to adjust windowing for the most optimal differentiation of the margins of the probes. The attenuation (HU) and the image noise represented by the standard deviation (SD) of the HU (HU-SD) in both low (100 kV) and high (Sn140 kV) energy spectra, as well as the FF detected by DECT were measured twice for each probe to minimize possible measurement errors. One measurement was performed with the Dual Energy region of interest (ROI) Free Hand tool on the coronal plane and the other measurement was performed with the Dual Energy ROI Circle tool in the axial plane and positioned approximately in the middle of the emulsion. The ROI size was always adjusted to be as large as possible while excluding container walls (Figure 2). The values obtained from the two measurement levels were averaged for each phantom probe to obtain one single value of HU and HU-SD at 100 kV, HU and HU-SD at 140 kV, and FF. CTDIVol for the incremental dose scans was 1.5, 3.1, 4.6, 6.2, 7.7, 9.3, 10.8, 12.4, 13,9 and 15.5 mGycm.The measurements were repeated for all possible combinations of the different reconstruction kernels and radiation doses.
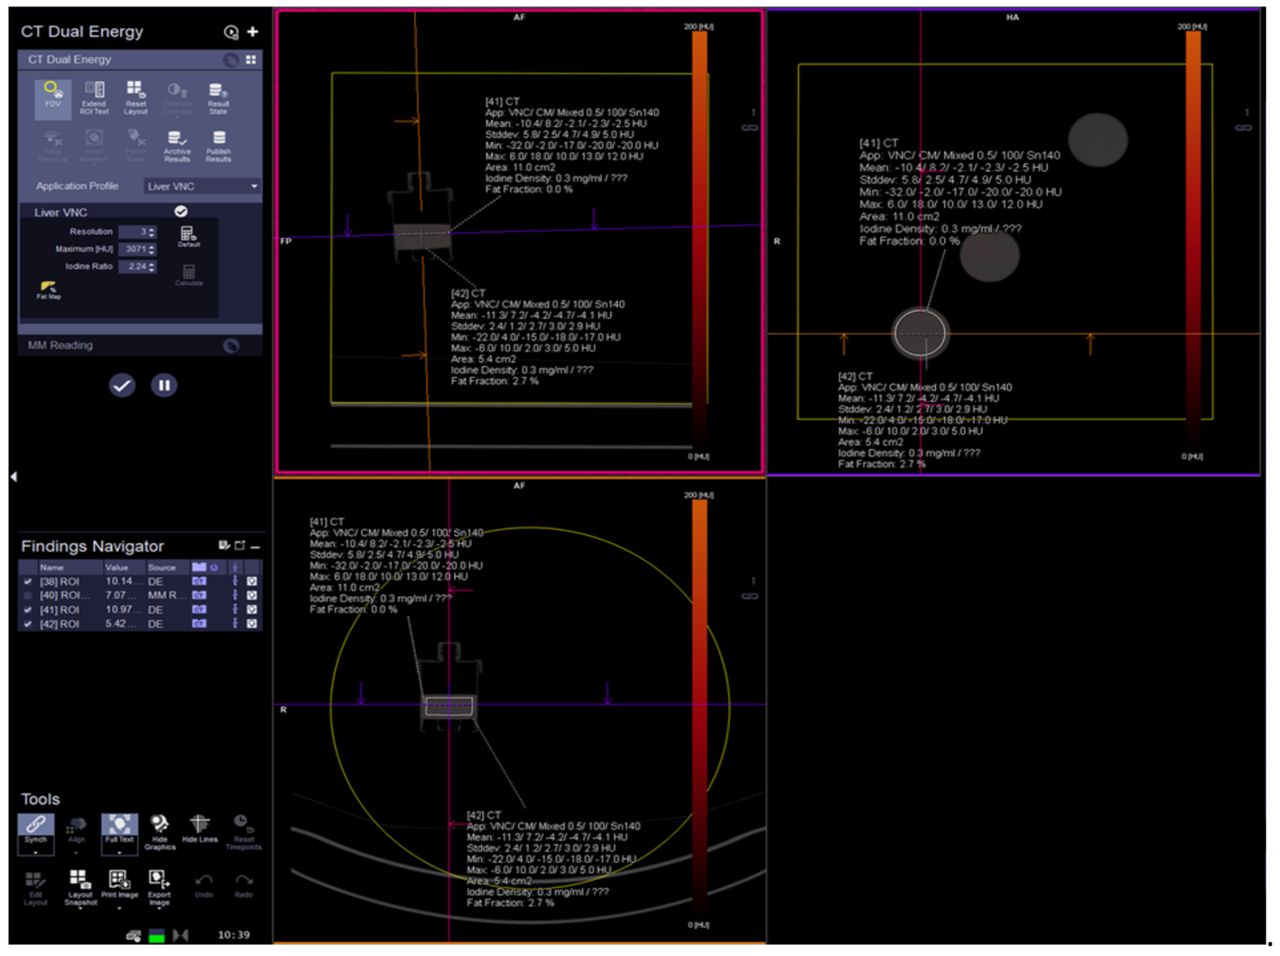
Hounsfield units (HU), image noise (HU-stadard deviation) and fat fraction measurements of the 0% probe: measurement in syngo.via demonstration placement of regions of interest and available results.
Calibration of FF measurements. The application profile had to be calibrated before the FF measurements were performed because the attenuation of the 0% and 100% probes that represent no fat and pure fatty tissues, respectively, were not the same as the corresponding values for the liver and the fat tissue in humans. Calibration used the Siemens “CT Dual Energy Configuration” panel and according to manufacturer’s instructions as follows: the FF of the 0% and 100% probes (as substitute for pure soft tissue/liver parenchyma and pure fat tissue, respectively) were measured using the default Siemens values [Configuration panel-Advanced visualization-Algorithm parameters: Fat calibration 0 (%): 0; and fat calibration 100 (%): 100] in all three reconstruction kernels and radiation doses. The FF values obtained by the measurements performed using the default Siemens values for the 0% and 100% probes were subsequently averaged over the different radiation doses within each reconstruction kernel and were inserted into the Algorithm parameters to replace the 0 and 100 default values, respectively. After software calibration, FF measurements of all six probes were performed.
Statistical analysis. Excel (Microsoft Excel, Version 16.16.27) was used for descriptive statistics and creating figures. FF values for each reconstruction kernel were averaged over the different radiation doses (tube currents). DECT-based FF values were subtracted from the known fat concentration of each probe for estimating the measurement error.
The small sample size within distinct tube current groups prohibited a reliable statistical analysis for extracting the p-value related to the effect of radiation dose on FF measurements. Therefore, a descriptive statistical approach was implemented using the calculation of the SD of FF within each reconstruction kernel.
Results
Measurement of the 0% and 100% probes using the software defaults before calibration. The probe with 0% fat showed approximately the same FF in the Q30 and I70 kernels with values of 44.9% and 45.4% when using the default software settings, whereas FF was lower in the I26 kernel with a value of 40.5%. The same phenomenon was observed for the 100% probe with FF of 70.8% and 71.5% in Q30 and I70, respectively, whereas the FF was lower with a value of 67.9% in I26 (Table I).
Attenuation (HU), image noise (SD) and FF measurements of the 0% and 100% phantom probes using the default settings of the software before calibration.
The HU measurements of both 0% and 100% probes were very similar between Q30 and I70 but notably greater for the I26 kernel (Table I). Image noise (HU-SD) was greater for the harder I70 kernel when compared with that of Q30 and I26 (Table I).
Software calibration and FF measurements of all probes. Because two (Q30 and I70) of the three evaluated reconstruction kernels showed approximately the same FF values for the 0% and 100% probes when using the default software values, the software application was calibrated only for Q30 and I70 (calibration 1) and for I26 (calibration 2) as follows (according to FF values presented in Table I):
Calibration 1: Fat calibration 0 [%]: 45 and fat calibration 100 [%]: 70
Calibration 2: Fat calibration 0 [%]: 40 and fat calibration 100 [%]: 68.
After calibration 1, the HU measurements of all probes were very close between Q30 and I70 but notably greater for the I26 kernel (Table II), which is similar to the results observed prior to calibration and using the default software values. Image noise (HU-SD) was also notably greater for the harder I70 kernel when compared with that of Q30 and I26 (Table II). The HU measurements were not repeated after calibration 2 because the software settings related to FF measurements does not affect HU measurements.
Calibration according to HU in Q30 and I70 kernels (calibration 1). Attenuation and image noise (HU-SD) in the lower (100 kV) and higher (140 kV) energy spectra, FF (%) measurements in DECT, FF-SD, mean difference and mean absolute difference between FF in DECT and actual fat concentration within each reconstruction kernel. Values are averaged over the different radiation doses within each reconstruction kernel.
FF measurements after calibration 1 (according to HU in Q30 and I70 kernels). As shown in Figure 3, the FF measurements in DECT (averaged over the different radiation dose levels) successfully reflected the 20% stepwise increases in fat concentration of the phantom probes without visually detecting overlap of the FF values between the different probes within each reconstruction kernel.
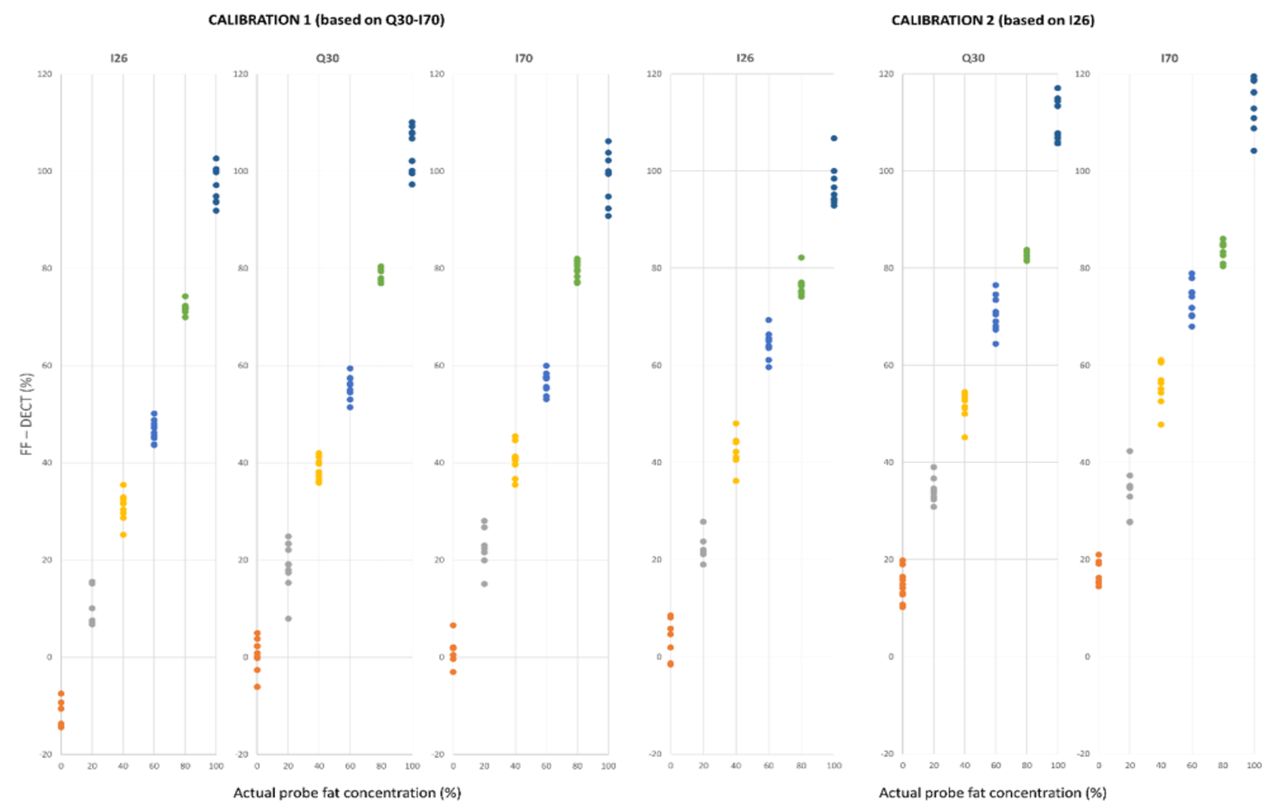
Clustered scatter plots showing the fat fraction (FF) measured in dual energy CT (DECT) [FF – DECT (%)] vs. the actual fat concentration of the phantom probes (%) using the three reconstruction kernels. Each spot represents the FF value measured at different radiation doses (mAs).
Kernel I26 gave underestimates of the fat concentration of the probes with a mean difference between FF and actual fat concentrations of –9.2% (averaged over all probes and radiation doses), which is a higher mean difference when compared with both Q30 and I70 with values of –0.6% and –0.1%, respectively (Table II and Table III). This is visually reflected in the scatter plot (Figure 3). The mean absolute difference between FF and actual fat concentration was 9.3% in I26, whereas for Q30 and I70 the values were 3.3% and 2.8%, respectively (Table III).
Calibration according to HU in Q30 and I70 kernels (calibration 1) SD of FF caused by the different radiation doses, mean difference and mean absolute difference of FF determined by DECT and actual fat concentration of the probes within each reconstruction kernel and in total averaged over all reconstruction kernels. Values are averaged over all six phantom probes (values for each probe presented in Table II).
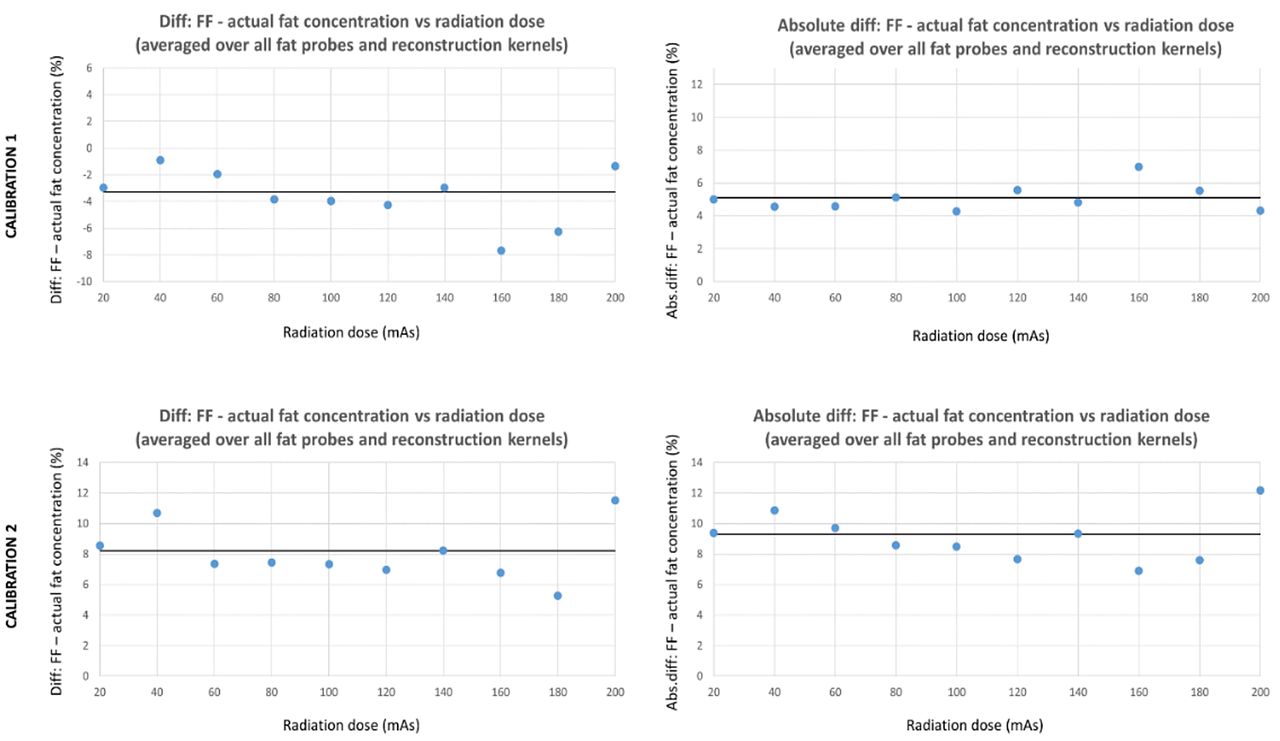
The variation (SD) of the FF caused by the different radiation doses applied in each reconstruction kernel is presented in Table II for each probe. The mean SD of the FF caused by the different radiation doses averaged over all probes was 3.2% within Q30, 2.7% within I26 and 3.3% within I70. Thus, total FF-SD caused by the different radiation doses averaged over all kernels and probes was 3.1% (Table II and Table III). The most prominent variances were observed for the 20% and 100% probes, which showed the greatest FF-SD (4.9% for the 20% probe in Q30, and 5.2% for the 100% probe in I70). The mean difference and the mean absolute difference between FF and actual fat concentration for the different radiation dose levels are presented in Figure 4.

Bland-Altman plots depicting the variation of the difference and the absolute difference between fat fraction and actual fat concentrations (averaged over all fat probes and reconstruction kernels) vs. the different radiation dose levels applied. The black thick horizontal lines represent the mean values (averaged over all radiation dose levels).
FF measurements after calibration 2 (according to HU in the I26 kernel). As shown in Figure 3, the FF measurements in DECT after calibration 2 (averaged over the different radiation dose levels) also reflected the stepwise increases in fat concentration of the phantom probes; however, kernels Q30 and I70 overestimated the actual fat concentration of the probes with mean differences between FF and actual fat concentration being 10.8% and 13.1%, respectively (averaged over all probes and radiation doses), whereas the I26 kernel closely approached the actual fat concentration with a mean difference of 0.9% (Table IV, Table V and Figure 3). The mean absolute difference between FF and actual fat concentration was 3.9% in I26, which is noticeably lower when compared with 10.8% and 13.1% for Q30 and I70, respectively (Table V).
Calibration according to Hounsfield units in the I26 kernel (calibration 2) FF (%) measurements in DECT, FF-SD, mean difference and mean absolute difference between FF in DECT and the actual fat concentration of each phantom probe within each reconstruction kernel. Values are averaged over the different radiation doses within each reconstruction kernel.
Calibration according to Hounsfield units in I26 kernel (calibration 2). SD of FF caused by the different radiation doses, mean difference, and mean absolute difference of FF determined by DECT and actual fat concentration of the probe within each reconstruction kernel and in total averaged over all reconstruction kernels. Values are averaged over all six phantom probes (values for each probe presented in Table II).
The variation (SD) of the FF caused by the different radiation doses applied in each reconstruction kernel is presented in Table V for each probe. The mean SD of the FF caused by the different radiation doses was very similar to the values found after calibration 1: averaged over all probes FF-SD was 2.8% within Q30, 3.3% within I26 and 3.8% within I70. Thus, the total FF-SD caused by the different radiation doses averaged over all kernels and probes was 3.3% (Table IV, Table V and Figure 3). The most prominent variances, as also observed after calibration 1, were observed for the 20% and 100% probes, which showed the highest FF-SD (5.2% for the 20% probe in I70, and 5.2% for the 100% probe in I70).
Discussion
This is the first attempt to evaluate the possible effects of different radiation dose levels and reconstruction kernels on FF measurements obtained by DECT to radiologically estimate the fat concentration for tissue differentiation. This phantom study showed that FF measurements in DECT reflect the actual fat concentrations with a maximal variance of approximately 5% caused by the different radiation doses. The softer kernel (I26) underestimated the actual fat concentration of the probes when compared with kernels Q30 and I70.
The softer I26 reconstruction kernel caused slightly greater attenuation measurements of all phantom probes when using the software default settings with a mean difference of approximately 3 to 4 HU when compared with Q30 and I70. Increasing the sharpness of a reconstruction kernel is known to also increase the image noise, which is caused by random variations of the pixels’ attenuation and is represented by the SD of the HU in the image. Image noise is particularly greater in sharper kernels, which was also observed in this study with the I70 kernel representing notably greater HU-SD values in both energy spectra when compared with that of Q30 and I26. Thus, greater HU values are expected by decreasing spatial resolution, i.e. in softer kernels, as shown for the I26 kernel in both energy spectra. This phenomenon has been observed previously in attenuation measurements of pulmonary parenchyma, coronary atherosclerotic plaques and cortical and trabecular osseous tissue among different kernels (10-12). Additionally, the I26 reconstruction kernel comprises a special kernel for qualitative vascular assessment in practice, especially coronary arteries; thus, in small probes slight edge effects may arise, which affect the attenuation measurements.
The fat concentration was underestimated in the I26 reconstruction kernel when the software was calibrated according to the lesser attenuated values measured in the Q30 and I70 kernels (calibration 1), and correspondingly was overestimated in the Q30 and I70 kernels when the software was calibrated according to the greater HU values measured in the I26 kernel (calibration 2). These differences in values measured are explained by the following compounding factors: 1. FF measurements in DECT are based on tissues attenuation coefficient matrices between the two applied energy spectra; 2. different kernels show different attenuation values for the same structures; 3. the application profile can only be calibrated once according to one FF value combination obtained by the default values of the software for 0% and 100% fat concentrations. Therefore, it is also plausible that the absolute mean underestimate of the fat concentration for the I26 kernel in calibration 1 (approximately 9%) was similar to the mean overestimate of the fat concentration for Q30 and I70 (approximately 11%-14%) in calibration 2.
The application of different, linearly varying radiation dose levels (from 20 to 200 mAs with 20 mAs steps) yielded a mean FF variation of approximately 3% (maximum FF-SD: 5.2% for the 100% probe in the I70 reconstruction kernel). This variation in this particular case is not crucial for the effective differentiation of these specific probes that differ in concentration by 20%. However, variation caused by different radiation dose levels has been described previously as clinically significant in lung densitometry (6). Similarly, a mean variation of 3% and a maximum variation of 5% in the FF values caused by the different radiation dose levels as found in the current study may also be considered crucial in the clinical setting because the range of fat concentrations that have to be radiologically differentiated may be narrow. Using fat concentration increases of 10% (or even narrower steps) for the phantom probes should provide more information about this issue, and FF overlaps between consecutive fat probes would probably hamper reliable differentiation of distinct fat concentrations. In this study, accurate production of fat phantom samples over a narrower concentration range was not possible because of technical reasons, which limits this study; however, this is a focus of possible future research. Alternative approaches using single energy CT acquisitions reliably quantified liver fat content, but only in combination with calibration phantoms for each scan (20). In postmortem analysis dual energy fat estimation proved to be advantegous over single energy scans (21).
The current phantom study has several other limitations. First, the effect of radiation dose and the reconstruction kernel on FF values was only evaluated in phantom probes and not in human tissues or organs. Furthermore, the software application used, though calibrated to the fat phantoms used, mainly corresponds to liver tissue fat measurements. Thus, global estimation of liver FF is methodologically possible using this dedicated software (syngo.via), estimation in other tissues needs calibration. Second, the fat probes were not scanned in a surrounding water tank, which probably impedes spectral beam hardening. Therefore, the observed attenuation variations may have also been due to this reason. Third, only one reader performed the attenuation and FF measurements, and the fat concentrations of each probe during DECT data collection were known, which may have increased measurement bias. However, two ROI measurements were performed at two levels and planes for each probe. Moreover, attenuation and FF values were averaged to minimize possible measurement errors. Additionally, constant pre-designated attenuation measurements following a specific study protocol and particularly in CT (whose spatial resolution is higher than other modalities, for example, magnetic resonance imaging) are considered simple and relatively reliable (22, 23). Fourth, the phantom probes were scanned with only one photon energy combination (Sn140/100 kV). Finally, the phantom probes used were exclusively produced for the purposes of the current study. Therefore, possible effects from the ambient temperature and time interval between probe production and scanning (a maximum of 10 min) cannot be excluded and remain unknown in this study. In addition, the calculation of SD of FF within each reconstruction kernel was used for statistical analysis, considering that the SD qualitatively reflects the variation incurred with the different tube currents applied.
Conclusion
Fat fraction measurements in DECT reflect the actual fat concentration of fat phantom probes that increase in 20% increments from 0% to 100%. Different radiation doses caused a mean variation of ~3% for the radiologically measured fat fractions. Calibrating the software should be carried out before measurements and always according to the reconstruction kernel used for subsequent measurements because softer kernels underestimate the fat concentration whereas sharper kernels overestimate the fat concentration.
Acknowledgements
The Authors thank the Edanz Group (https://en-author-services.edanzgroup.com/ac) for editing a draft of this manuscript.
Footnotes
This article is freely accessible online.
Authors’ Contributions
Study design and methodology (VC, RK, JF, MT, TN), design and construction of phantom (VC, CB, JF, TN), image acquisition (VC, TN), Image analysis (VC, RK, TN), Data analysis (VC, RK, TN), Writing the manuscript/statistics (VC, CB, RK, JF, MT, TN). All Authors have read and agreed to the published version of the manuscript.
Conflicts of Interest
V.C. has received a scientific grant from Guerbet, CH. The Authors declare no conflicts of interest. The funders had no role in the design of the study; in the collection, analyses, or interpretation of data; in the writing of the manuscript, or in the decision to publish the results.
- Received June 28, 2021.
- Revision received July 16, 2021.
- Accepted July 19, 2021.
- Copyright © 2021 International Institute of Anticancer Research (Dr. George J. Delinasios), All rights reserved