


Abstract
Background/Aim: This study aimed to compare the prostate volume (PV) and prostate-specific antigen density (PSAD) obtained using the ellipsoid volume formula or segmentation methods on magnetic resonance imaging (MRI) and further predict prostate cancer (PCa). Patients and Methods: Retrospectively, the enrolled patients underwent prostate MRI and had PSA levels between 4 and 10 ng/ml. The PV was measured with both the ellipsoid volume formula (PVe) and the segmentation method (PVs). The transitional zone volume (TZV) was measured with the segmentation method. The PSADe, PSADs, and PSAD_TZV were calculated. Bland-Altman plots were used to compare the agreements. ROC curve analysis was used to compare the diagnostic accuracies to predict PCa. The results were also compared between the PCa and the no-PCa groups, and among tumors with different locations and different Gleason scores (GS). Results: Seventy-six of the 117 enrolled patients were classified into the PCa group. There were high agreements between PVs and PVe as well as between PSADs and PSADe, while several outliers were mainly due to post-transurethral resection of the prostate changes and irregular hyperplastic nodules. The diagnostic accuracy of PSADe (AUC: 0.732) was slightly higher than that of PSADs (AUC: 0.729) and PSAD_TZV (AUC: 0.715). The PSADe and PSADs were not different among different tumor locations but were higher in GS ≥7 lesions (both p=0.006). Conclusion: The segmentation method can be an alternative method to measure PV and calculate PSAD before prostate biopsy, particularly in post-transurethral resection of the prostate patients or those with irregular hyperplastic nodules.
Prostate cancer (PCa) is the second most common cancer in men worldwide, with approximately 1,414,259 cases (7.3% of all newly diagnosed cancers) in 2020. Its incidence is especially higher in countries with a higher human development index (HDI) than in countries with a lower HDI (37.5 per 100,000 males vs. 11.3 per 100,000 males). The incidence rate has continuously increased in some countries or regions, such as China, Eastern Europe, and sub-Saharan Africa (1).
In Taiwan, the incidence rate of PCa is exploding. Between 2009 and 2019, the incidence rate increased from 34.49 to 60.70 per 100,000 males. Meanwhile, the mortality rate of PCa also increased from 8.04 to 13.14 per 100,000 males (2). The main reason for the increasing incidence rate is the use of screening tools, including a combination of prostate-specific antigen (PSA) screens using a cutoff threshold of 4 ng/ml and digital rectal examination (DRE). However, there are some limitations to PSA and DRE. The positive predictive values of PSA and DRE for detecting PCa were not high enough in a large meta-analysis study, at approximately 25.1% and 17.8%, respectively (3). Compared to the Western population, the Asian population, including the Taiwanese population, has a higher prevalence of PCa in the transitional zone (4, 5), which is less detectable by DRE.
Elevated PSA is also found in several conditions, such as benign prostatic hyperplasia and prostatitis. In particular, PSA levels between 4 and 10 ng/ml are considered a borderline range with variable PCa detection rates, approximately 22.0-43.5% in the Western population and 9.3-26% in the Asian population (6-10). In this PSA range, some authors have suggested prostatic specific antigen density (PSAD) to be a better predictor for diagnosing PCa, with a higher diagnostic accuracy than PSA alone (11, 12). PSAD was calculated by dividing the prostate volume by PSA.
Conventionally, transrectal ultrasound (TRUS) was performed, and then systemic TRUS biopsy was performed to detect PCa. PSAD was then calculated by measuring prostate volume with TRUS. Recently, multiparametric MRI (mpMRI) has been increasingly used as an alternative screening modality to detect PCa before biopsy. There is a trend toward performing mpMRI followed by MR-fusion or targeted biopsy instead of systemic TRUS biopsy to reduce the complications resulting from systemic TRUS biopsy (13). By using mpMRI, we can calculate the prostate volume and obtain PSAD, which is expected to predict PCa, while avoiding unnecessary biopsy.
On mpMRI, the prostate volume can be measured with the ellipsoid volume formula in the same way as on TRUS. We can measure the prostate volume with the segmentation method by summing areas of the prostate gland on axial images. To the best of our knowledge, there is no literature comparing the differences in PSAD and the diagnostic accuracies of PSAD calculated with prostate volume determined with these two methods. Thus, we compared PSAD obtained from these two different methods of measuring prostate volume in patients with PSA levels between 4 and 10 ng/ml to evaluate the diagnostic accuracy of PSAD in the Taiwanese population.
Patients and Methods
This retrospective study was approved by the institutional review board, and informed consent was obtained from each patient. The patients enrolled in this study received a prostate MRI in our institute either to detect prostate cancer or for tumor staging of prostate cancer proven by transrectal ultrasound-guided biopsy (TRUS biopsy) or transurethral resection of the prostate (TURP). The PSA level of each patient was obtained within one month before or after the MRI study.
All MRI studies were performed between January 2020 and December 2021 with a 3T scanner (Intera Achieva 3.0T, Philips Medical System, Best, the Netherlands). T2 fast spin echo images in the axial, sagittal, and coronal views were acquired with the same parameters in each patient: axial: TR/TE, 3981/100; echo-train length, 17; matrix, 0/300/289/0; FOV, 18 cm; slice thickness and spacing, 3.0 and 3.0 mm, respectively, flip angle, 90; sagittal: TR/TE, 4105/100; echo-train length, 17; matrix, 368/0/0/365. FOV, 22 cm; slice thickness and spacing, 3.0 and 4.0 mm, respectively, flip angle 90; and coronal: TR/TE, 2300/100; echo-train length, 17; matrix, 0/300/289/0. FOV, 18 cm; slice thickness and spacing, 3.0 and 3.3 mm, respectively, flip angle 90.
The inclusion criteria were as follows: (a) total PSA between 4 and 10 ng/ml, (b) histopathologic results from targeted MR/ultrasound fusion biopsy or TRUS biopsy within 6 months before and after prostate MRI or histopathologic results from prostatectomy after prostate MRI, and (c) histopathologic results that illustrated the Gleason score (GS). The exclusion criteria were as follows: (a) acute prostatitis and/or acute urinary tract infection, and (b) any treatment for prostate cancer before prostate MRI, such as hormone therapy, chemotherapy, radiotherapy, and prostatectomy.
Prostate volume measurement and transitional zone volume measurement. We used both the ellipsoid volume formula and the segmentation method to calculate prostate volume. For the prostate volume calculated from the ellipsoid volume formula (PVe), the anteroposterior (AP) diameter and longitudinal diameter were measured on sagittal T2-weighted images, while the transverse diameter was obtained from transverse T2-weighted images. The prostate volume was then calculated with the ellipsoid volume formula: π/6×AP diameter×transverse diameter×longitudinal diameter.
For the prostate volume calculated from the segmentation method (PVs), we compared the axial, sagittal, and coronal views and determined the true contour of the prostate gland. Then, we manually drew the contour of the prostate gland slice-by-slice on axial T2-weighted images and calculated the volume with the “ROI volume” tool in Osirix (Osirix MD v 6.6.1 64-bit, Geneva, Switzerland; FDA clearance K101342) (14). The transitional zone volume (TZV) was measured with the same method (15). The PSADe, PSADs, and PSAD_TZV were then calculated by dividing the PSA level by the PVe, PVs and TZV, respectively.
The enrolled patients were classified into two study groups according to histopathologic results from TRUS biopsy, TURP, and prostatectomy: 1) proven PCa, and 2) no PCa (no-PCa). According to the GS results, the patients with PCa were subclassified into low/very-low risk (GS=6), intermediate risk (GS=7), and high/very-high risk (GS>7) groups.
According to tumor location from the histopathologic results of TRUS biopsy, we also stratified the results into three groups: parasagittal, peripheral, and both (parasagittal+peripheral) regions of the prostate gland. The PSADe and PSADs were then compared between the PCa and no-PCa groups and among different tumor locations.
Statistics. Normally-distributed continuous variables are expressed as the mean±standard deviation, nonnormally distributed continuous variables are expressed as the median±interquartile range, and categorical variables are expressed as numbers (percentages). We used the Bland-Altman plot to analyze the differences between the segmentation (free-hand) and ellipsoid volume formula methods. The mean differences in prostate volume and PSAD were also compared between patients who received TURP and those without a history of TURP.
We used Student’s t-test and the Mann-Whitney U-test to compare the variables of prostate volume, transitional zone volume, and PSAD between the PCa and no-PCa groups. We used receiver operating characteristic (ROC) curves and the Youden index method to identify the most predictive variable among PSA level and the parameters of PSAD and its cut-off value for predicting PCa.
We used the Kruskal-Wallis test to compare PSADs and PSADe in patients with PCa of different risk levels (low/very low, intermediate, and high/very high) and different tumor locations based on biopsy. We used Kendall’s τ rank correlation coefficient to determine the association between PCa risk group and PSAD (PSADs and PSADe). All statistical analyses were performed with SPSS 23.0 software (SPSS Inc.). A p-value ≤0.05 was considered significant.
Results
In total, 117 males (average 65.2±7.9 years old) were enrolled in this study, with a median PSA of 6.68±2.56 (range=4.08-9.87 ng/ml) and a median free PSA (fPSA) of 0.96±0.57 ng/ml. Seventy-six patients (65%) had prostate cancer proven by histopathologic results. The median PSA level and median fPSA level were similar between the PCa group and the no-PCa group (p=0.074 and 0.217). The median PVs, mean PVe, and median TZV were greater in the no-PCa group than those in the PCa group, while the median prostate-specific antigen density (PSADs and PSADe) and PSAD_TZV were higher in the PCa group (all p<0.001) (Table I).
Comparing the prostate cancer (PCa) group and the no-PCa group.
Bland-Altman analysis. The Bland-Altman plot revealed that the mean difference between PVs and PVe was 0.26±2.69 ml, and the two variables had high agreement (Figure 1). The mean difference between PSADs and PSADe was − 0.0026±0.026 ng/ml2, indicating high agreement (Figure 1). There were still several outliers in the plots, which were mainly due to TURP. Sixteen patients received TURP prior to prostate MRI in this study series. The mean difference in prostate volume (PVs and PVe) after TURP was slightly larger than that in patients without TURP (mean difference: 0.49±4.65 ml vs. 0.22±2.26 ml, p=0.885). The mean differences in PSADs and PSADe were also slightly greater after TURP, although without statistical significance (mean difference: −0.011±0.066 ng/ml2 vs. -0.001±0.0114, p=0.994).

Bland-Alman plot of prostate volume (A) and prostate-specific antigen density (B).
ROC analysis. Comparing PSA level, PSADs and PSADe, the ROC curve analysis revealed that PSADe had the largest area under the curve (AUC) of 0.732, followed by PSADs (AUC=0.729), PSAD_TZV (AUC=0.715) and PSA level (AUC=0.600) (Figure 2). Using a PSADe cutoff level of 0.1567 ng/ml2 to diagnose PCa resulted in a sensitivity of 64.5% and specificity of 75.6%.
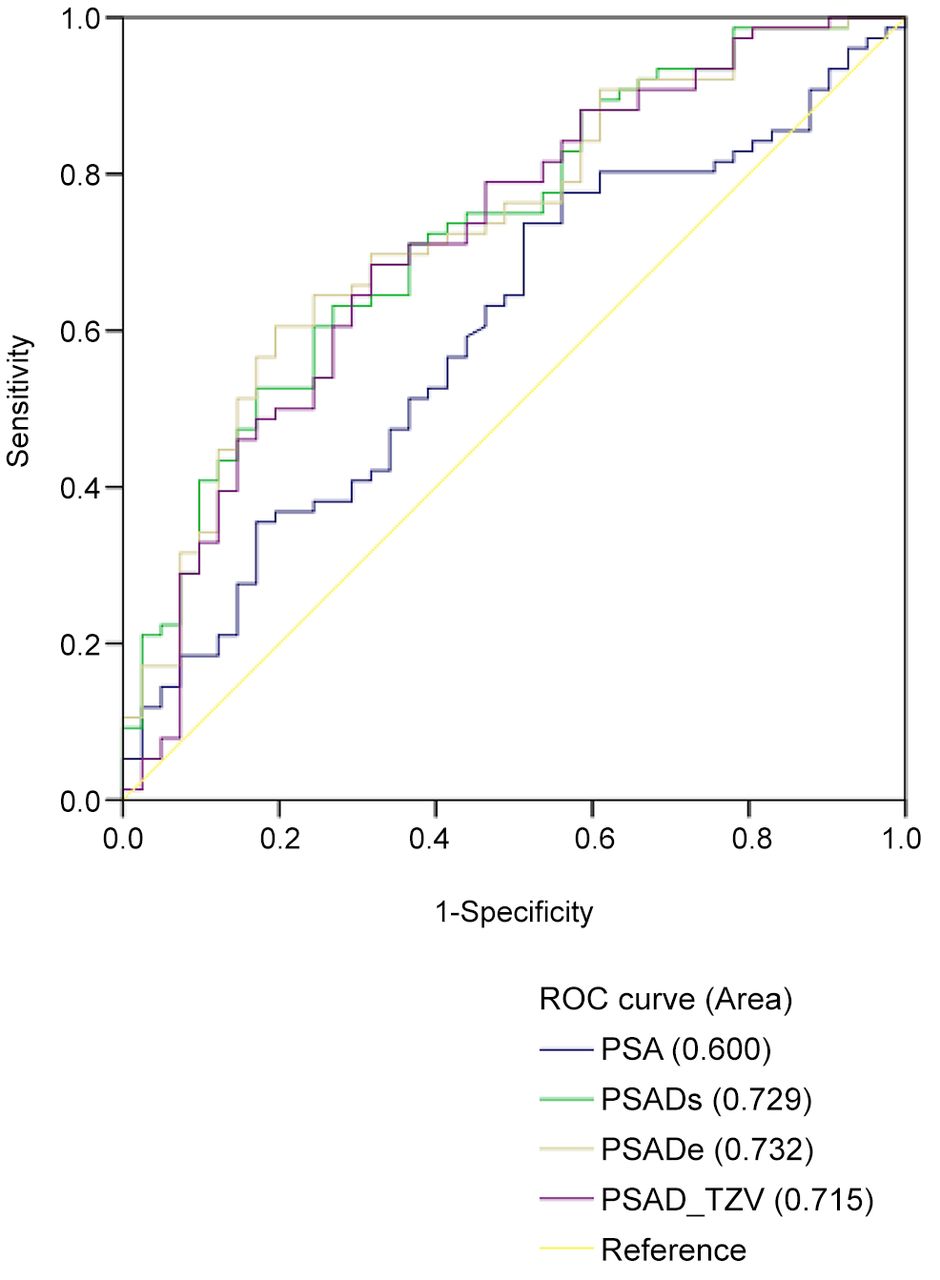
ROC curve analysis.
PSAD in different risk levels of prostate cancer. Among the 76 patients in the PCa group, 25 patients (32.9%) were classified as low/very-low risk (GS=6), 44 (57.9%) were classified as intermediate risk (GS=7), and seven (9.2%) were classified as high/very-high risk (GS >7). Comparison of these three different risk groups revealed significant differences in PSADs and PSADe (p=0.023 and 0.033, respectively) (Figure 3A). Additionally, significantly higher PSA levels, PSADs, and PSADe were observed in the intermediate to high/very-high risk group than in the low/very low risk group (p=0.039, p=0.006, and p=0.006, respectively). A significant correlation was found between PSADs and the risk group of PCa (τ=0.276, p=0.002) as well as between PSADe and the risk group of PCa (τ=0.261, p=0.003).

Box-plot of prostate-specific antigen density obtained from the segmentation method (PSADs) and PSAD obtained from the ellipsoid volume formula (PSADe). (A) PSADs and PSADe of different risk groups [low/very-low risk (GS=6), intermediate risk (GS=7), and high/very-high risk (GS >7)] (p=0.023 and p=0.033). (B) PSADs and PSADe values in different tumor locations (p=0.472 and p=0.357).
The differences in PSAD levels between the no-PCa group and low/very-low risk group of PCa were insignificant (mean PSADs: 0.127±0.058 ng/ml2 vs. 0.183±0.092 ng/ml2, p=0.123; mean PSADe: 0.128±0.061 ng/ml2 vs. 0.176±0.080 ng/ml2, p=0.132).
PSAD in different tumor locations. According to the histopathologic results from the biopsy, 20 patients had tumors in the parasagittal region, 15 had tumors in the peripheral region, and 40 had tumors in both the parasagittal and peripheral regions. One patient only received robotic-assisted prostatectomy with tumors in both lobes on whole-mount specimen. Among 75 cases with biopsy results, up to 80% consisted of parasagittal tumors as central gland tumors.
When comparing the pathologic results of different tumor locations in the prostate gland, there was no significant difference observed between PSADs and PSADe among the tumor locations in the parasagittal region, peripheral region, and both regions (p=0.472 and p=0.357, respectively) (Figure 3B).
Discussion
In this retrospective study, we used two different methods to calculate the prostate volume and further calculate the PSAD. There was a high agreement between these two methods on analysis of prostate volume and PSAD. However, several outliers were found. Three of these four outliers on prostate volume measurement were due to post-TURP changes. The large soft tissue defect in the transitional zone of the prostate gland after TURP makes the contour of the prostate gland different from a true ellipsoid. The same problem was seen for another outlier — a hyperplastic prostate with irregular contours because of an unusual out-protruding hyperplastic nodule (Figure 4). In the above conditions, the segmentation method is the better tool for calculating the true prostate volume and obtaining PSAD.

T2-weighted axial image (A), coronal image (B), and sagittal image (C) of the prostate gland with a large hyperplastic nodule (N) at the prostate base, which is approaching the left seminal vesicle (S) and urinary bladder (U). The prostate volume was calculated by the “ROI volume” tool in Osirix (D). In this case, the prostate volume calculated by the segmentation method was 47.2 ml, and the prostate volume calculated by the ellipsoid volume formula was 33.6 ml.
Another disadvantage of the ellipsoid volume formula is the difficulty in identifying the true “prostate apex” and measuring the longitudinal length based on the longitudinal axis of the prostate gland on the sagittal images. The prostate apex is the posterior-inferior border of the peripheral zone, and the longitudinal axis is the line between the tip of the prostate base and the tip of the prostate apex. Occasionally, the tips of the prostate base and prostate apex are not on the same slice on the sagittal images. This results in errors in measurements obtained by different people. If the plane of the axial images is not perpendicular to the longitudinal axis of the prostate gland, the transverse length of the prostate gland obtained from the axial images is not the true transverse length, which is known as the “Salami effect” (16).
We can exclude such problems with the wrong axis by using the segmentation method. The true prostate contour and the real prostate apex can be identified by comparing the axial, sagittal, and coronal views before drawing the contour on the axial views. The main disadvantages of the segmentation method are that it is time-consuming and operator-dependent.
In addition to the high agreement between the PSADs and PSADe in this study, our results from the ROC analysis revealed no significant difference between PSADs and PSADe in predicting PCa. For a prostate with an ordinary contour, using the ellipsoid volume formula is still an accurate and uncomplicated way to calculate the prostate volume and further estimate PASD. For patients with a history of TURP or irregularly shaped prostate, the segmentation method is an alternative way to calculate prostate volume.
In this study, patients in the PCa group had a smaller transitional zone volume but a higher zonally adjusted PSAD (PSAD_TZV) than the no-PCa group. Our results were consistent with the study by Zheng et al. (17). However, in the ROC analysis for variables predicting PCa, PSAD_TZV was not superior to PSAD in our series, while PSAD _TZV was considered a better predictive factor in other studies (15, 17) that used the ellipsoid volume formula for prostate volume measurements instead of the segmentation method. As with the same considerations above, hyperplastic nodules may distort the contour of the transitional zone, making the shape of the transitional zone far from a true ellipsoid. Thus, the PSAD_TZV obtained from the segmentation method may be much closer to reality.
The histopathologic results in our series revealed a high prevalence of central gland tumors, approximately 80%, which is even higher than that in Japanese and Western populations (4, 5). PSAD was not different between PCa in central glands and that in peripheral zones and thus can predict tumors in both locations. Since central gland or transitional zone tumors are less detectable by digital rectal examination, the prebiopsy PSAD available from prostate MRI and combined PIRADS results plays a more important role in predicting the possibility of PCa and further reduces an unnecessary biopsy (18), particularly in Asian populations.
Traditionally, we used multiparametric MRI (mpMRI) to detect PCa. In recent studies, some authors suggested biparametric MRI (bpMRI) using T2WI and diffusion weighted images combined with PSAD results to detect clinically significant PCa (19-20). A Simplified Prostate Imaging Reporting and Data System (S-PI-RADS) with four categories was proposed to describe the lesions in bpMRI (20). bpMRI required less scanning time and reduced gadolinium contrast media injection comparing with mpMRI (19).
In this study, we confirmed that PSAD was higher in the high-risk group with correlations among the three different risk groups, although we could not differentiate the no-PCa group from the low-risk PCa group by using a cutoff level of 0.1567 ng/ml2. Both active surveillance and prostatectomy are acceptable management choices. Therefore, although this is a pitfall in identifying low-risk PCa, active surveillance can still compensate for the situation.
There are several limitations to this study. First, this is a single-center study in one medical center in mid-Taiwan. The number of patients is small. Second, all of the images were interpreted by one experienced radiologist with 30 years of experience in uroradiology. Interobserver agreement was not evaluated. Third, although all patients had MRI scans and PIRADS results, we did not compare PSAD among tumors with different PIRADS scores. We also did not evaluate the histopathologic results from the whole-mount specimen after radical prostatectomy. Further investigation in these areas is needed.
In conclusion, the segmentation method can be an alternative method to measure prostate volume and results in PSAD values with high agreement with those obtained with the ellipsoid volume formula; additionally, this method is useful in patients who previously received TURP or have irregular prostate contours because of hyperplastic nodules.
Footnotes
Authors’ Contributions
YTL conceived and designed the analysis, performed the analysis, and wrote the manuscript; SWH conceived and designed the analysis, collected the data, and performed the analysis; KYC collected the data and reviewed and edited the manuscript; JWC and JCL reviewed and edited the manuscript.
Conflicts of Interest
The Authors have no conflicts of interest to declare in relation to this study.
- Received January 15, 2023.
- Revision received January 28, 2023.
- Accepted January 30, 2023.
- Copyright © 2023, International Institute of Anticancer Research (Dr. George J. Delinasios), All rights reserved
This article is an open access article distributed under the terms and conditions of the Creative Commons Attribution (CC BY-NC-ND) 4.0 international license (https://creativecommons.org/licenses/by-nc-nd/4.0).
References
In this issue


Jump to section
Related Articles
Cited By...
- No citing articles found.