


Abstract
Aim: To compare 4D flow magnetic resonance imaging (MRI) and 2D phase contrast (PC) MRI when evaluating bicuspid (BAV) and tricuspid (TAV) aortic valves. Materials and Methods: A total of 83 subjects (35 BAV, 48 TAV) were explored with 4D flow and 2D PC MRI. Systolic peak velocity, peak flow and regurgitation fraction were analysed at two pre-defined aortic levels (aortic root, mid-tubular). Furthermore, the two methods of 4D flow analysis (Heart and Artery) were compared. Results: Correlation between the 2D PC MRI and 4D flow MRI derived parameters ranged from moderate (R=0.58) to high (R=0.90). 4D flow MRI yielded significantly higher peak velocities in the tubular aorta in both groups. Regarding the aortic root, peak velocities were significantly higher in the TAV group with 4D flow MRI, but in the BAV group 4D flow MRI yielded non-significantly lower values. Findings on peak flow differences between the two modalities followed the same pattern as the differences in peak velocities. 4D flow MRI derived regurgitation fraction values were lower in both locations in both groups. Interobserver agreement for different 4D flow MRI acquired parameters varied from poor (ICC=0.07) to excellent (ICC=1.0) in the aortic root, and it was excellent in the tubular aorta (ICC=0.8-1.0). Conclusion: 4D flow MRI seems to be accurate in comparison to 2D PC MRI in normal aortic valves and in BAV with mild to moderate stenosis. However, the varying interobserver reproducibility and impaired accuracy at higher flow velocities should be taken into account in clinical practice when using the 4D flow method.
A bicuspid aortic valve (BAV) is the most common congenital cardiac malformation, occurring in 0.5-2% of the general population, with men being three times more likely to be affected than women (1). BAV is associated with a broad spectrum of cardiovascular complications, including aortic valve dysfunction (stenosis or regurgitation or combined) and aortic dilatation (2), which become manifested at an earlier age than in patients with normal tricuspid aortic valve (TAV) (3). Furthermore, aortic dilatation is a precursor to severe acute aortic events, such as rupture of an aortic aneurysm and aortic dissection (4, 5). Hence, accurate diagnosis at an early stage and optimal timing of surgical intervention are essential to prevent adverse events and reduce mortality in affected individuals.
Currently, transthoracic echocardiography (TTE) and two-directional phase-contrast magnetic resonance imaging (2D PC MRI) are the imaging techniques of choice in the diagnosis and monitoring of valvular diseases. However, these methods use only single-directional velocity-encoding and require experience from the operator to position correctly the acquisition planes. One alternative approach to blood flow quantification, i.e., time-resolved three-dimensional phase contrast magnetic resonance imaging (4D flow MRI), uses three-directional velocity-encoding along the cardiac cycle and thus achieves a more comprehensive evaluation and detailed visualization of hemodynamic flow. Moreover, 4D flow MRI enables the study of advanced hemodynamic metrics, including wall shear stress (WSS), aortic flow formations (helicity and vorticity), flow angle, turbulent and viscous energy loss, which make it possible to detect complex flow patterns. A particular advantage of 4D flow MRI is the possibility to retrospectively position the analysis planes at any location within the full volumetric coverage of the acquisition area (6, 7).
While there is a growing number of reports comparing 4D flow MRI against different clinically used modalities in healthy volunteers, there is still little published information regarding patients with accelerated and complex flow. A preliminary report indicated that 4D flow MRI underestimated peak velocities in cases of severe aortic stenosis compared to TTE and 2D PC MRI (8). However, in patients with a pulmonary valve with lower velocities, the 4D flow method was claimed to be more accurate when compared to 2D PC MRI (9).
Therefore, the principal aim of this study was to compare the performances of 4D flow MRI against the standard 2D PC MRI when quantifying blood flow in the aortic root and ascending aorta of BAV and TAV patients. Additionally, our aim was to compare the feasibility of the two different analysis methods provided by the software applied. The 4D Heart module allows quantification of flow at the level of the aortic valve while the 4D Artery module allows quantification at level of aortic root and further in the aorta. We also aimed to determine the inter-observer reproducibility of the 4D flow MRI derived measures.
The hypothesis was that 4D flow MRI provides more accurate values compared to the 2D PC MRI translating to higher peak velocities. Similarly, the 4D Heart module at valvular level was expected to show higher velocities than 4D artery at aortic root.
Materials and Methods
Study population. This study was approved by the Ethical Committee of the Nothern Savo hospital district, and a written informed consent was obtained from all participants. The study followed the Declaration of Helsinki, and all procedures were performed in accordance with relevant guidelines and regulations.
The study included 83 patients who were deemed candidates to undergo an aortic MRI scan. Thirty-five BAV patients were recruited from the Central Finland hospital district registry of adult congenital heart diseases. The aortic MRI of these study patients was offered to be performed in Kuopio University Hospital in order to include the possibility to conduct 4D flow MRI. In addition, a group of 48 patients with TAV having aortic MRI with a 4D flow MRI protocol conducted in Kuopio University Hospital, was evaluated. Patients with an aortic valve prosthesis or aortic root replacement, poor image quality or missing imaging data for 2D or 4D flow analysis, or contraindications for MRI were excluded. Evidence of aortic regurgitation, aortic stenosis, and dilatation of the ascending aorta (diameter ≥42 mm) was noted in both groups. The severity of aortic stenosis was graded according to clinical guidelines (10).
Magnetic resonance imaging (MRI). All scans were performed with a 1.5T Siemens MAGNETOM Aera (Siemens GmbH), without contrast media. To ensure comparability between 2D PC and 4D flow MRI measurements, all data acquisition was performed during the same examination session resulting in an overall scan time of approximately 45 minutes. The MRI scan protocol has been described in more detail in a previous study by Kauhanen et al. (11).
4D Flow MRI. The 4D flow MRI sequence was acquired in a 3D volume covering the entire thoracic aorta (Figure 1A). Prospective electrocardiographic (ECG) gating was used to synchronize the 4D flow MRI with the heartbeat. Scanning was performed in free-breathing and the artefacts caused by respiratory motion were minimized by averaging. 4D flow MRI sequences were obtained with the following parameters: echo time 2.8 ms, repetition time 5.25 ms, number of segments 2, spatial resolution 2.3×2.3×3.0 mm3, flip angle 7°, 18-25 cardiac phases, 15 slices. The velocity encoding (VENC) was set to the lowest non-aliasing velocity in the scout images.

Demonstrative images of A) 4D flow magnetic resonance imaging (MRI) (CAAS 4D flow Artery), B) 4D flow MRI (CAAS 4D flow Heart), C) anatomical view of ascending aorta where aortic diameters were measured and D) 2D phase contrast MRI view at the level of the aortic valve.
2D PC MRI. The free-breathing 2D PC sequence was performed with one-directional velocity encoding through the plane. ECG gating was used for tracking the RR-interval. The 2D imaging plane was positioned perpendicular to the long axis of the thoracic aorta at the level above the aortic valve and the tubular aorta based on the location and orientation information obtained from the anatomical scout images.
Scan parameters for 2D PC MRI were as follows: repetition time 5 ms, echo time 2.7 ms, pixel spacing 1.6×1.6 mm, slice thickness 5 mm, and the number of cine frames 50. Initially, VENC was set to 150 cm/s and progressively increased until the image had no artefacts.
Assessment of 2D and 4D flow MRI parameters. The 4D flow MRI datasets were transferred to a software (CAAS MR 4D flow, Pie Medical Imaging, Maastricht, the Netherlands) to handle image reconstruction and flow quantification. A further analysis was carried out using two different modules based on the location of interest: CAAS MR 4D Artery at the level of 1) the aortic root at sinotubular junction and 2) the mid-tubular aorta (Figure 1A). CAAS 4D MR Artery module does not provide accurate flow measurements at the level of the aortic valve. CAAS MR 4D Heart was used to quantify flow at the level of the aortic valve (Figure 1B) and compared to the measurements carried out using 4D Artery module at sinotubular junction. The analysis planes were manually positioned by the observer after pre-processing and manual segmentation of the aorta. The dimensions of ascending aorta were measured from sinus valsalva (aortic root) and from the mid-tubular aorta (Figure 1C).
The 2D PC datasets were analysed using Syngo.via-software (Siemens GmbH). Processing of the data included segmentation of the lumen borders of the aorta in the acquired planes in 1) the sinotubular junction and 2) the mid-tubular aorta. Parameters assessed in all predefined analysis planes with both 2D and 4D flow methods were as follows: peak velocity (cm/s), peak flow (ml/min) and regurgitation fraction (%).
Inter-observer analysis. Two independent observers (TK, SH) performed the 4D flow analysis using independent pre-processing, aorta segmentation and placement of 2D analysis planes in a total of 18 BAV patients. The obtained measurements, including peak velocity, peak flow, and regurgitation fraction, in both levels of the aortic root and in the mid-tubular aorta were then compared between the observers to test for interobserver reproducibility.
Statistical analysis. All statistical analyses were performed using SPSS Statistics 27 (IBM, Chicago, IL, USA). Categorical variables are presented as percentages and quantitative variables as means±standard deviations. The means between the BAV and TAV patient groups were compared using the independent samples t-test.
For non-normally distributed data, a paired comparison was carried out using Wilcoxon signed-rank test between 2D PC MRI and 4D flow MRI, as well as between 4D flow Artery and 4D flow heart measurements, including systolic peak velocity, peak flow, and regurgitation fraction. Medians and interquartile ranges were calculated for flow measurements to account for skewed data. A p-value <0.05 was considered statistically significant.
The inter-observer reproducibility for the 4D flow measurements was determined using the intraclass correlation coefficient (ICC) with a two-way mixed and an absolute agreement model. The guideline devised by Koo et al. was used for interpretation: below 0.50 – poor; between 0.50 and 0.75 – moderate; between 0.75 and 0.90 – good; above 0.9 – excellent (12).
Correlation between 2D PC MRI and 4D flow MRI measurements were determined using Pearson correlation coefficient.
Results
Study population. A total of 83 subjects were analysed; these consisted of 35 BAV patients [age 41.4±14.1 years; 14 (40.0%) female] and 48 TAV patients [age 62.6±8.4 years; 11 (22.9%) female]. The mean age of the TAV patients was significantly higher than that of the BAV patients (p=0.001). The diameter of the aortic root was also noted to be significantly wider in the TAV group (42.8±5.7 mm vs. 39.8±6.3 mm, p=0.03). In addition, the TAV patients were more obese and had a larger body surface area (BSA) when compared to the BAV patients. The characteristics of both patient groups are presented in Table I.
Characteristics of the study population.
Mild and moderate aortic valve stenosis was mainly present in the BAV group and accordingly the mean peak velocities in the aortic root measured by 2D PC MRI were significantly higher in BAV patients as compared to TAV patients (185.1±54.3 cm/s vs. 118.5±23.4 cm/s; p<0.001).
4D flow MRI quantification versus 2D PC MRI. The 4D flow MRI and 2D PC MRI derived parameters were found to have high positive correlation (R>0.70) for most part. The regurgitation fractions at tubular aorta were found to have moderate positive correlation (R=0.58). Detailed charts and R-values are presented in Figure 2.

Correlation between 2D phase contrast (PC) magnetic resonance imaging (MRI) and 4D FLOW MRI across all groups in the aortic root (A, C, E) and in the tubular aorta (B, D, F).
4D flow MRI yielded significantly higher peak velocities in the tubular aorta in both BAV and TAV patients as compared to 2D PC MRI [141.6 (121.3-179.6) cm/s vs. 128.0 (104.3-150.3) cm/s, p<0.001 in BAV and 86.9 (73.5-96.8) cm/s vs. 76.0 (60.3-85.6) cm/s, p<0.001 in TAV]. In contrast, in the BAV group, systolic peak velocities in the aortic root obtained by 4D flow were non-significantly lower [174.4 (149.4-210.9) cm/s] than values obtained with 2D PC MRI [185.4 (148.7-216.8) cm/s, p=0.6]. However, peak velocities in the aortic root in the TAV group resulted in significantly higher values when recorded with 4D flow MRI [130.5 (117.3-147.5) cm/s vs. 120.8 (105.7-134.5) cm/s, p<0.001].
In the BAV group, findings on peak flow differences between the two modalities followed the same pattern as the differences in peak velocities. Thus, 4D flow MRI yielded slightly lower values in the aortic root [470.5 (372.2-594.7) ml/s vs. 480.5 (342.5-586.8) ml/s, p=0.97], whereas in the tubular aorta, 4D flow [465.9 (331.4-531.5) ml/s] based peak flow quantification resulted in significantly higher values as compared to those obtained with 2D PC MRI [420.1 (316.6-507.2) ml/s, p=0.02]. In the TAV group, there were good agreements between the values of 4D flow and 2D PC MRI derived peak flows in the aortic root (p=0.25) and the tubular aorta (p=0.6).
When assessing the regurgitation fraction, it was noted that 4D flow MRI derived values were consistently lower in both locations in both groups than the corresponding 2D PC MRI derived values. A comparison of the values determined using the two methods is presented in Figure 3 and Figure 4.
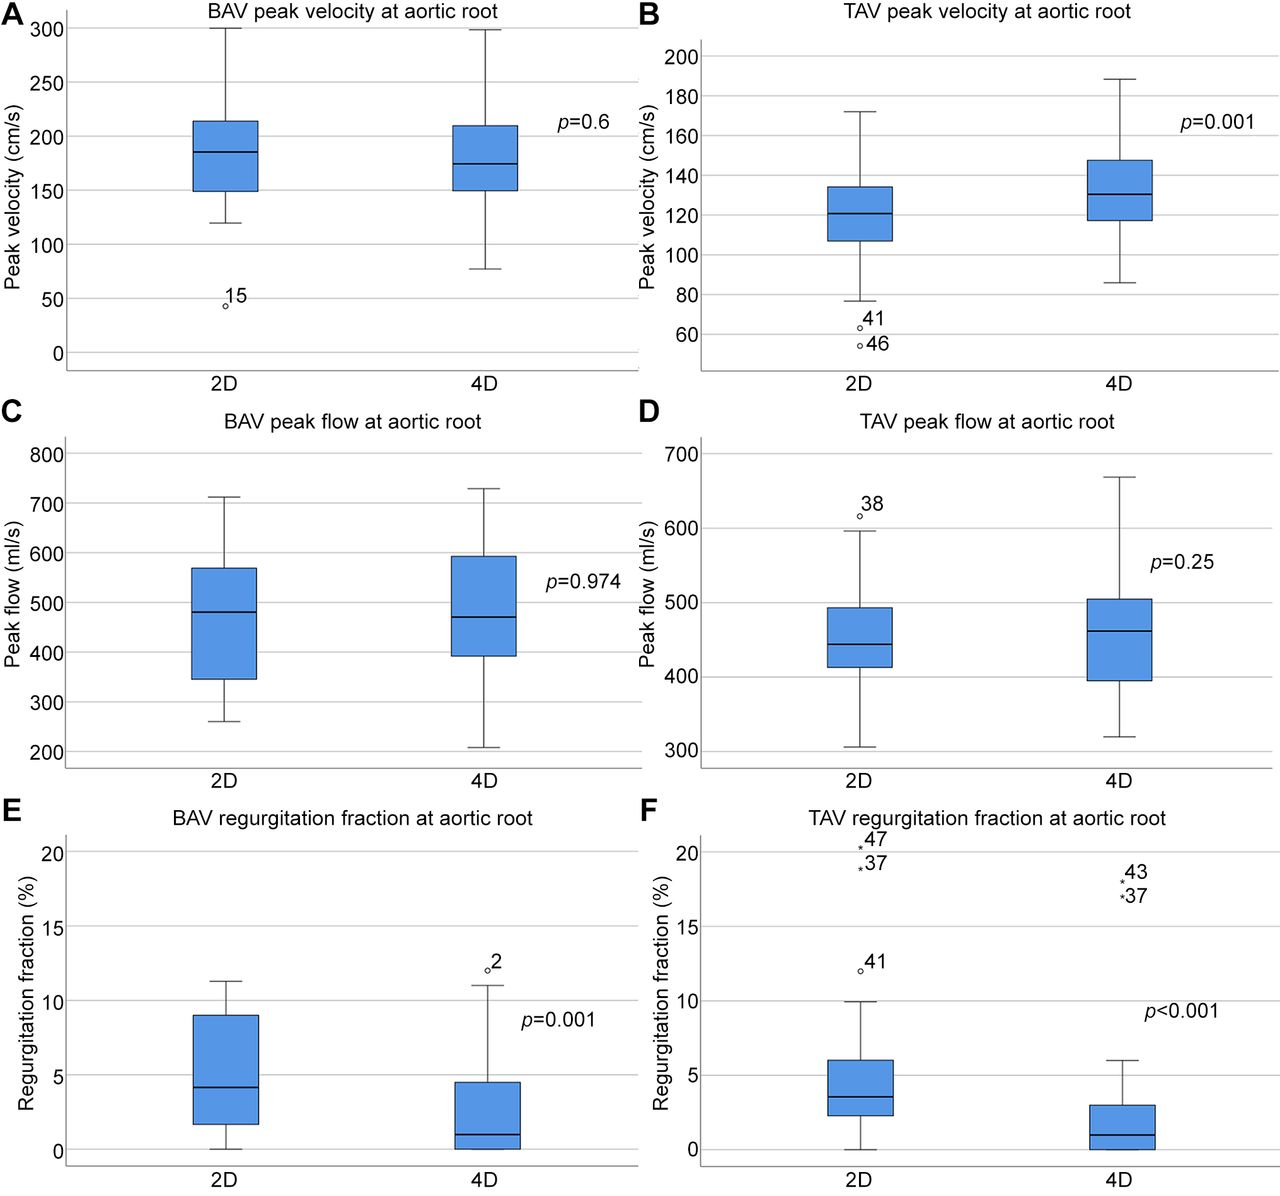
Comparison of 2D phase contrast magnetic resonance imaging (MRI) vs. 4D flow MRI in the aortic root of patients with bicuspid (BAV) (A, C, E) and tricuspid (TAV) (B, D, F) aortic valves.

Comparison of 2D phase contrast magnetic resonance imaging (MRI) vs. 4D flow magnetic resonance imaging (MRI) in the tubular aorta of patients with bicuspid (BAV) (A, C, E) and tricuspid (TAV) (B, D, F) aortic valves.
4D flow Artery versus 4D flow Heart analysis module. The 4D flow Artery and 4D flow Heart derived peak flow measurements were found to have high positive correlation (R=0.70). Peak velocities showed low positive correlation (R=0.34) while regurgitation fractions showed moderate positive correlation (R=0.61) (Figure 5).

Correlation between CAAS MR 4D flow heart and artery module across all groups in peak velocity (A), peak flow (B) and regurgitation fraction (C).
When the performances of the 4D flow Artery and the 4D flow Heart were compared, regurgitation fractions and peak flows were observed to be slightly higher with the Heart analysis. However, no statistically significant differences were evident in either group. On the contrary, peak velocities were found to be significantly lower when the Heart analysis was used in BAV patients [143.8 (127.1-180.2) cm/s] as compared to the Artery analysis module [174.4 (149.4-210.9) cm/s, p=0.04]. A similar trend, though non-significant was observed also in the TAV group [119.9 (107.5-128.6) cm/s vs. 130.5 (117.3-147.5) cm/s, p=0.06].
Inter-observer agreement. There was a good-to-excellent agreement between the observers for 4D flow derived values for systolic peak velocity (ICC=0.8), peak flow (ICC=0.8) and regurgitation fraction (ICC=1.0) in the tubular aorta. In contrast, the ICC scores were notably lower, varying from poor-to-moderate, in the aortic root: systolic peak velocity (ICC=0.3), peak flow (ICC=0.7) and regurgitation fraction (ICC=0.07) (Figure 6).

Interobserver variability in assessments of different parameters in the aortic root (A, C, E) and in the tubular aorta (B, D, F).
Discussion
In this study, the values obtained by the 4D flow MRI measurements were compared to conventional 2D PC MRI in evaluating patients with BAV and TAV. Modern 4D flow MRI technology is an attractive method since it should be better at assessing complex multidirectional hemodynamic flow patterns since it can capture velocity data in all three directions. In addition, 4D flow MRI technology offers the possibility for retrospective adjustment of the measuring angle and plane. On the contrary, the conventional 2D PC MRI uses only one-directional velocity encoding. Additionally, if the 2D PC MRI acquisition plane is positioned in the wrong location or direction; this can lead to an underestimation of peak velocity (13).
Even though one would expect more elaborate and precise velocity values with MRI technology-based method, and indeed it has been shown to be excellent in measuring velocities in a healthy population, it has been reported to be poor in detecting high-velocity values in patients with severely stenotic valves (8). This has been hypothesized to derive from the intravoxel averaging of the narrow peak jets in cases of severe valvular stenosis.
In this study, only cases of mild-to-moderate valvular stenosis were detected. The study revealed that there were no significant differences in the peak velocity in the valvular level between the two methods in BAV patients. Instead, 4D flow MRI appeared to be better at estimating the higher velocity values at the valvular level in TAV patients. The finding that the peak velocities were significantly higher in BAV as compared to TAV could be attributed to the higher accuracy of the 4D method to detect the decreases in flow at increasing flow velocities as described earlier by Halva et al. (8). When measuring the flow velocities upstream of the valve, 4D flow MRI produced systematically higher values indicating its superiority over 2D PC MRI.
It has been shown previously that when measuring lower flow velocities, 4D flow MRI achieves more accurate values in comparison to 2D PC MRI (9). Our results agree with this conclusion i.e., the 4D flow peak velocity values acquired in the tubular aorta of BAV and TAV patients were notably lower than in the aortic root and hence, 4D flow yielded significantly higher peak velocity estimates. This gives further support to the theory that the benefits of 4D flow MRI are most pronounced in situations in which there are lower velocities and regular laminar blood flow.
Since the measurement of the flow volume is not so dependent on the crucial location of the sample volume, the flow volume showed a better correlation between the two methods in both valvular types. However, in the measurement of the regurgitation fraction, 4D flow MRI demonstrated significantly lower values when compared to 2D PC MRI. This is of clinical significance, as regurgitation fraction is a critical flow parameter when determining the severity of valvular disease and a systematic underestimation could affect patient treatment and follow-up (10). However, in this study there were no clinically significant incidents of valvular regurgitation in any of the patients leading to a result of extremely low values of the regurgitation fraction. This might have an effect on the statistical calculations and the accuracy of 4D flow MRI should rather be analysed in patients with clinically relevant valvular regurgitation.
The second aim of our study was to compare two different analysis modules (Heart and Artery) provided by CAAS MR 4D flow (Pie Medical Imaging). Although the 4D flow Heart tool made it possible to place the analysis plane closer to the aortic valve, it was found that it still measured significantly lower peak velocities than those acquired with the 4D flow Artery method (p=0.04). There are no other studies that have compared these two commercial algorithms. Thus, concerning their clinical usability, this study reveals important information.
Previous studies using 4D flow MRI have also provided insights into the relationship between hemodynamic flow abnormalities and ascending aortic dilatation, which is a frequent finding especially in BAV patients (11, 14-17). Kauhanen et al. detected elevated flow displacement values in patients with ascending aortic dilatation as compared to patients without dilatation. Furthermore, flow displacement was found to result in increased WSS, which measures the fractional shearing stress exerted by the fluid on the displaced side of the vascular wall (11). Van Ooij et al. examined 571 BAV patients and reported significantly elevated 3D WSS patterns in those individuals with any degree of aortic stenosis (14). Since the Heart analysis algorithm lacks the possibility to analyse flow displacement or WSS, these measurements were not performed in the current study. Nonetheless, according to previous findings, 4D flow derived advanced flow markers could potentially play an important role when examining patients with BAV.
Inter-observer reproducibility of 4D flow MRI was shown to be excellent when measuring the flow parameters above the aortic root. This is most probably related to the lower velocity values acquired in the tubular aorta. However, the repeatability was much lower at the aortic root. This might be caused by the more difficult adjustment of the sample volume to narrower peak jets present at this location.
One of the limitations of this study and the analysis software used is the lack of automation for post-processing of the 4D flow data. Manually performed data processing is not only time-consuming but also a potential source of errors. This may be a contributing factor to the poor interobserver reproducibility found in our study. Furthermore, due to poor image contrast, both the segmentation and correct placement of the analysis planes in the aortic root proved challenging and were inherently affected by operator-dependent uncertainty, which is not acceptable for clinical practice. The accuracy of 4D flow MRI data may also be limited by its low temporal resolution. Another limitation regarding the 4D flow MRI technique is the long scan times, which are dependent on the heart rate of the patient. Finally, the study population of BAV patients was not large and the distribution of different valve fusion types was unknown. Therefore, the impact of different fusion-specific flow features on the performance of these two imaging modalities is not addressed here.
In conclusion, 4D flow MRI is accurate in comparison to the conventional method in normal aortic valves and in BAV with mild-to-moderate stenosis. However, the variations in inter-observer reproducibility and impaired accuracy at higher flow velocities should be taken into account in clinical practice when utilizing the 4D flow MRI approach.
Acknowledgements
The study was supported by funding from Kuopio University Hospital research residue funding (KP 11620), Mauri and Sirkka Wiljasalo Funding, and financial support through a legacy provided by Oiva Vaittinen.
Footnotes
Authors’ Contributions
Sofia Hautanen: Validation, formal analysis, investigation, writing – original draft, visualization. Teemu Kiljander: Conceptualization, formal analysis, investigation, writing – original draft, visualization. Tarmo Korpela: Validation. Petri Saari: Resources, project administration. Jorma Kokkonen: Resources. Pirjo Mustonen: Conceptualization. Saara Sillanmäki: Project administration, writing – review & editing. Elias Ylä-Herttuala: Software, writing – review & editing. Minna Husso: Software, writing – review & editing. Marja Hedman: Conceptualization, resources, writing – review & editing, supervision, project administration, funding acquisition. Petteri Kauhanen: Conceptualization, methodology, writing – review & editing, supervision.
Conflicts of Interest
The Authors have no conflicts of interest regarding this article.
- Received October 26, 2022.
- Revision received November 6, 2022.
- Accepted November 8, 2022.
- Copyright © 2023, International Institute of Anticancer Research (Dr. George J. Delinasios), All rights reserved
This article is an open access article distributed under the terms and conditions of the Creative Commons Attribution (CC BY-NC-ND) 4.0 international license (https://creativecommons.org/licenses/by-nc-nd/4.0).
References
In this issue


Jump to section
Related Articles
Cited By...
- No citing articles found.