


Abstract
Background/Aim: The habitual consumption of excessive fructose is associated with the onset and progression of lifestyle-related diseases, such as nonalcoholic fatty liver disease (NAFLD). In this study, we investigated the physiological changes observed when consuming a diet containing excessive fructose on the viewpoints of hepatotoxicity biological markers using a rat model and explored the biomarker candidates that could detect the effects of excessive fructose intake at an early stage. Materials and Methods: Male rats were fed 63% high fructose diet (HFrD) ad libitum and their blood samples were collected before and at 1, 2, 3, and 4 weeks after allocation. The plasma biochemical parameters, hepatotoxic enzyme activities including alkaline phosphatase (ALP) isozymes were analyzed. Results: HFrD consumption for 4-weeks created NAFLD-like symptoms, including elevated plasma lipid parameters and hepatotoxicity markers, as well as fat accumulation in the liver compared with rats consuming a control diet. Alanine aminotransferase (ALT) and glutamate dehydrogenase (GLDH) were increased from the 3rd and 2nd weeks, respectively, but no changes were observed on ALP activity. However, the daily consumption of the HFrD increased the plasma activities of liver-type ALP isozyme, and decreased plasma small intestinal-type ALP isozyme soon after the start of feeding. Conclusion: ALP isozyme analysis in combination with GLDH and ALT activities in the plasma samples could be a useful tool to detect the physiological changes induced by excessive fructose intake at an early stage of the development of NAFLD.
- Fructose
- metabolic syndrome
- alkaline phosphatase isozyme
- biomarker
- hepatotoxicity
- nonalcoholic fatty liver disease
The advent of modernization coupled with sedentary lifestyles has changed the epidemiology of disease from undernutrition to overnutrition (1). One of the most important diseases induced by overnutrition is metabolic syndrome, which is a cluster of dyslipidemic disorders including elevated serum triglycerides and reduced high-density lipoprotein cholesterol, fatty liver, elevated blood pressure, dysglycemia including insulin resistance and elevated serum glucose, and a pro-inflammatory state (2). The homecooked meals in many developed countries have been replaced in recent years by foods higher in calories, and this shift has been problematic because of the use of high-fructose corn syrup (HFCS) in sweetened beverages and foods (3). According to the report by Marriott et al., the HFCS percentage of sweeteners has increased from 16% in 1978 to 42% in 1998 and then stabilized (4). Additionally, total fructose consumption as percentage of energy increases 1%, and daily energy intakes increased 18% during these periods. The increase in consumption of HFCS has a temporal relation to the epidemic of obesity, and the over consumption in calorically sweetened beverages may play a role in the epidemic of obesity (5, 6).
HFCS is a fructose-glucose liquid sweetener alternative to sucrose first introduced to the food and beverage industry in the 1970s, and containing 42% to 55% fructose and glucose, depending on the application (7, 8). There are many reports about the different physiological effects of fructose and glucose. For example, Köseler et al. investigated the effects of high fructose and high glucose intake on body weight and some biochemical parameters using a rat model, and reported that the body weights in the high fructose-fed group were higher than those in the high-glucose-fed group (9). When comparing the effects of drinking fructose or glucose supplemented water in mice consuming a high-fat diet, the mice on the high-fat diet and drinking fructose developed more pronounced obesity, and hepatomegaly than mice receiving a high-fat diet and drinking glucose, despite similar caloric intakes (10). Rats on fructose but not glucose-supplemented diets displayed an abnormal glucose tolerance (11). Furthermore, excessive fructose intake has been widely used as metabolic syndrome-like animal models, including for obesity and diabetes animal models (12-15). According to these studies, the daily consumption of diets high in fructose can rapidly produce all of the key features of the metabolic syndrome (16).
Many putative mechanisms about fructose-induced metabolic syndrome have been postulated. About 50-70% of consumed fructose is absorbed into the body via glucose transporter 5 in the brush border of the small intestine, and then about 70% is metabolized in the liver (17, 18). Excessive intake of fructose has been reported to induce de novo synthesis of fatty acids and triglyceride accumulation in the liver, consequently leading to the development of hyperlipidemia, nonalcoholic fatty liver disease (NAFLD) and chronic inflammation (18-20). NAFLD is a primary cause of liver disease and is difficult to diagnose because it is mostly asymptomatic; it affects approximately one-third of the world’s population (21, 22). Approximately 30% of patients with NAFLD develop nonalcoholic steatohepatitis (NASH) with necrotizing inflammation and fibrosis of the liver. Hence, it is very important to develop measures to prevent the various diseases caused by excessive fructose intake. For this purpose, in addition to avoiding excessive fructose intake, suitable tools that can diagnose excessive daily fructose intake are needed. However, to the best of our knowledge, there is not one optimal method that can indicate the status of excessive fructose intake before the onset of NAFLD.
In this study, therefore, we investigated the physiological changes that occur when rats are fed a diet containing excessive amounts of fructose as compared with those in rats fed a completely fructose-free diet, focusing on hepatotoxicity biological markers. Furthermore, alkaline phosphatase (ALP) was selected as one of the hepatic toxicity markers secreted into the blood, and its isozyme activities were followed over time. Consequently, we obtained the biomarker candidates liver-type ALP (L-ALP) and intestinal-type ALP (I-ALP), to show the early-stage effects of the daily intake of excessive fructose.
Materials and Methods
Institutional approval of the study protocol. Institutional Animal Care and Use Committee of the Yokohama Research Center, Central Pharmaceutical Research Institute, Japan Tobacco Inc. (protocol code No. 21012, date of approval: February 8, 2021) approved all the animal procedures. This study was conducted in accordance with the Japanese Law for the Humane Treatment and Management of Animals (Law No. 105 issued on October 1, 1973), which defines animal experimentation as the use of animals for scientific purposes with the consideration of the 3Rs.
Diets. In this study, a modified AIN-93G purified control diet (CD; D21012002) and a 63% high fructose diet (HFrD; D21012001), were purchased from Research Diets, Inc. (New Brunswick, NJ, USA). Their compositions are shown in Table I.
Compositions of experimental diets.
Animals and housing environments. Twelve 5-week-old male Crl:CD (SD) rats were purchased from Jackson Laboratory, Inc. (Kanagawa, Japan), and quarantined and acclimatized for 1 week. During the quarantine and acclimation period, the animals were fed CD ad libitum, and then divided into two groups: a CD-fed group and an HFrD-fed group. The rats were allowed free access to the diets and tap water. They were housed in pairs in plastic cages with animal bedding in a 12-h light/12 h-dark cycle (lighting from 7:00 a.m. to 7:00 p.m.), air-conditioned room with a temperature of 23±1°C, relative humidity of 55±5%, and ventilation frequency of approximately 15 times per hour. The animals of each group were fed their assigned diets ad libitum for 4 weeks. Body weights and food consumption were measured daily during the first week of feeding and twice a week thereafter.
Weekly blood sampling. Blood samples were collected from the subclavian vein without anesthesia before allocation and at 1, 2, and 3 weeks after allocation, and from the abdominal aorta under isoflurane anesthesia (5%) at 4 weeks. All blood samples were taken into the lithium heparinized plasma (BD Vacutainer blood collection tubes, heparin lithium coated, Becton, Dickinson and Company, Auckland, NZ, USA) between 9:00 a.m. – 11:00 a.m. under the non-fasting condition. The blood samples were cooled on ice immediately after sampling and centrifuged at 1,750 g, 4°C for 30 min. After collection, the plasma was stored in an ultra-deep freezer set at −80°C until analysis.
Clinical analysis. The following parameters in plasma were measured at 37°C with an automated analyzer (TBA-120FR, Canon Medical Systems Corporation, Tochigi, Japan) using individual standard reagent: aspartate aminotransferase (AST), alanine aminotransferase (ALT), ALP, glucose, glutamate dehydrogenase (GLDH), sorbitol dehydrogenase, guanase, lactate dehydrogenase (LDH), gamma glutamyl transferase (γ-GTP), leucine aminopeptidase (LAP), 5′-nucleotidase (5′-NT), total cholesterol, total protein, triglycerides, and phospholipids.
Plasma isozyme analysis. Plasma L-ALP, I-ALP, and bone-type ALP (B-ALP) (Disodium 4-nitrophenylphosphate method, Helena laboratory, Saitama, Japan) were measured using standard reagents in a fully automated electrophoresis apparatus (Eparaiza 2, Helena laboratory). In addition, for B-ALP analysis, plasma was pretreated with an ALP separator (Helena laboratory) at room temperature for 30 min before measurement. In addition, plasma B-ALP analysis was pretreated with neuraminidase (Separator, Helena laboratory) at room temperature for 30 min according to the method of Hatayama et al. (23).
Necropsy and liver weights. After the blood collection at week 4, all the animals were euthanized by exsanguination from the abdominal aorta, and necropsied by pathologists, who were not informed about the kind of treatment each animal had received. The animals were examined in detail for gross lesions. The liver was weighed and the relative weight to the final body weight calculated. The necropsy was completed between 9:00 a.m. – 11:00 a.m.
Histopathology. The liver, duodenum, jejunum, and ileum, collected from all the animals, were fixed in 10% neutral buffered formalin, and prepared for histopathological examination by embedding in paraffin wax, sectioning, and staining with hematoxylin and eosin. Additional sections of the liver stained with Oil Red O and Sirius red were also prepared. The slides for the liver, duodenum, jejunum, and ileums were evaluated microscopically.
RNA extraction. Aliquots of the tissue samples were homogenized by a Tissue Lyser (QIAGEN, Hulsterweg, the Netherlands) and the total RNA was extracted using a RNeasy Mini kit (QIAGEN, Hulsterweg) according to the manufacturer’s instructions. The total RNA concentrations were determined at 260 nm using NanoQuant PlateTM and a plate reader (Infinite 200 PRO M nano, Tecan Group Ltd., Kawasaki, Japan). Two-μg of the isolated total RNA was used to synthesize cDNA with SuperScript VILO Mastermix (Thermo Fisher Scientific, Waltham, MA, USA) according to the manufacturer’s instructions.
Quantitative RT-PCR. The synthesized cDNA solutions were diluted 5-fold with Tris-EDTA buffer (pH8.0, Nippon Gene Co., Ltd., Tokyo, Japan). Before the measurements, the cDNA solutions were further diluted 10-fold with MILLI-Q water (Merck Millipore, Burlington, MA, USA) and used for TaqMan probe-based semi quantitative-real time PCR. The mRNA levels were measured in duplicate on a QuantStudioTM3 Real-Time PCR System (Thermo Fischer Scientific) using TaqMan Gene Expression Master Mix (Thermo Fisher Scientific) according to the manufacturer’s instructions. The data analysis was performed by a calibration curve method using SDS software (Thermo Fisher Scientific) and the results were normalized to b-actin expression levels. The following primer and TaqMan probe mixtures were obtained from Thermo Fisher Scientific: claudin-1 (Cl-1, Rn00581740_m1), claudin-4 (Cl-4, Rn01196224_s1), zonula occludens-1 (Zo-1, Rn07315717_m1), occludin (Oc, Rn00580064_m1), and β-actin (Rn00667869_m1). Thermal cycling conditions were set as follows: 1 cycle of reverse transcription at 50°C for 2 min, initial activation at 95°C for 10 min, and then 40 cycles of denaturation at 95°C for 15 s, annealing and extension at 60°C for 60 s. The relative expression levels of the target genes were calculated using β-actin as a calibrator.
Statistical analysis. Data are presented as the mean values±standard deviations (S.D.). Statistical analyses were performed to compare the data between the CD and HFrD groups using an unpaired Student’s t-test. The levels of significance were set at 5% (two-tailed). Statistical analyses were performed using the JMP (SAS Institute Inc., Charlotte, NC, USA).
Results
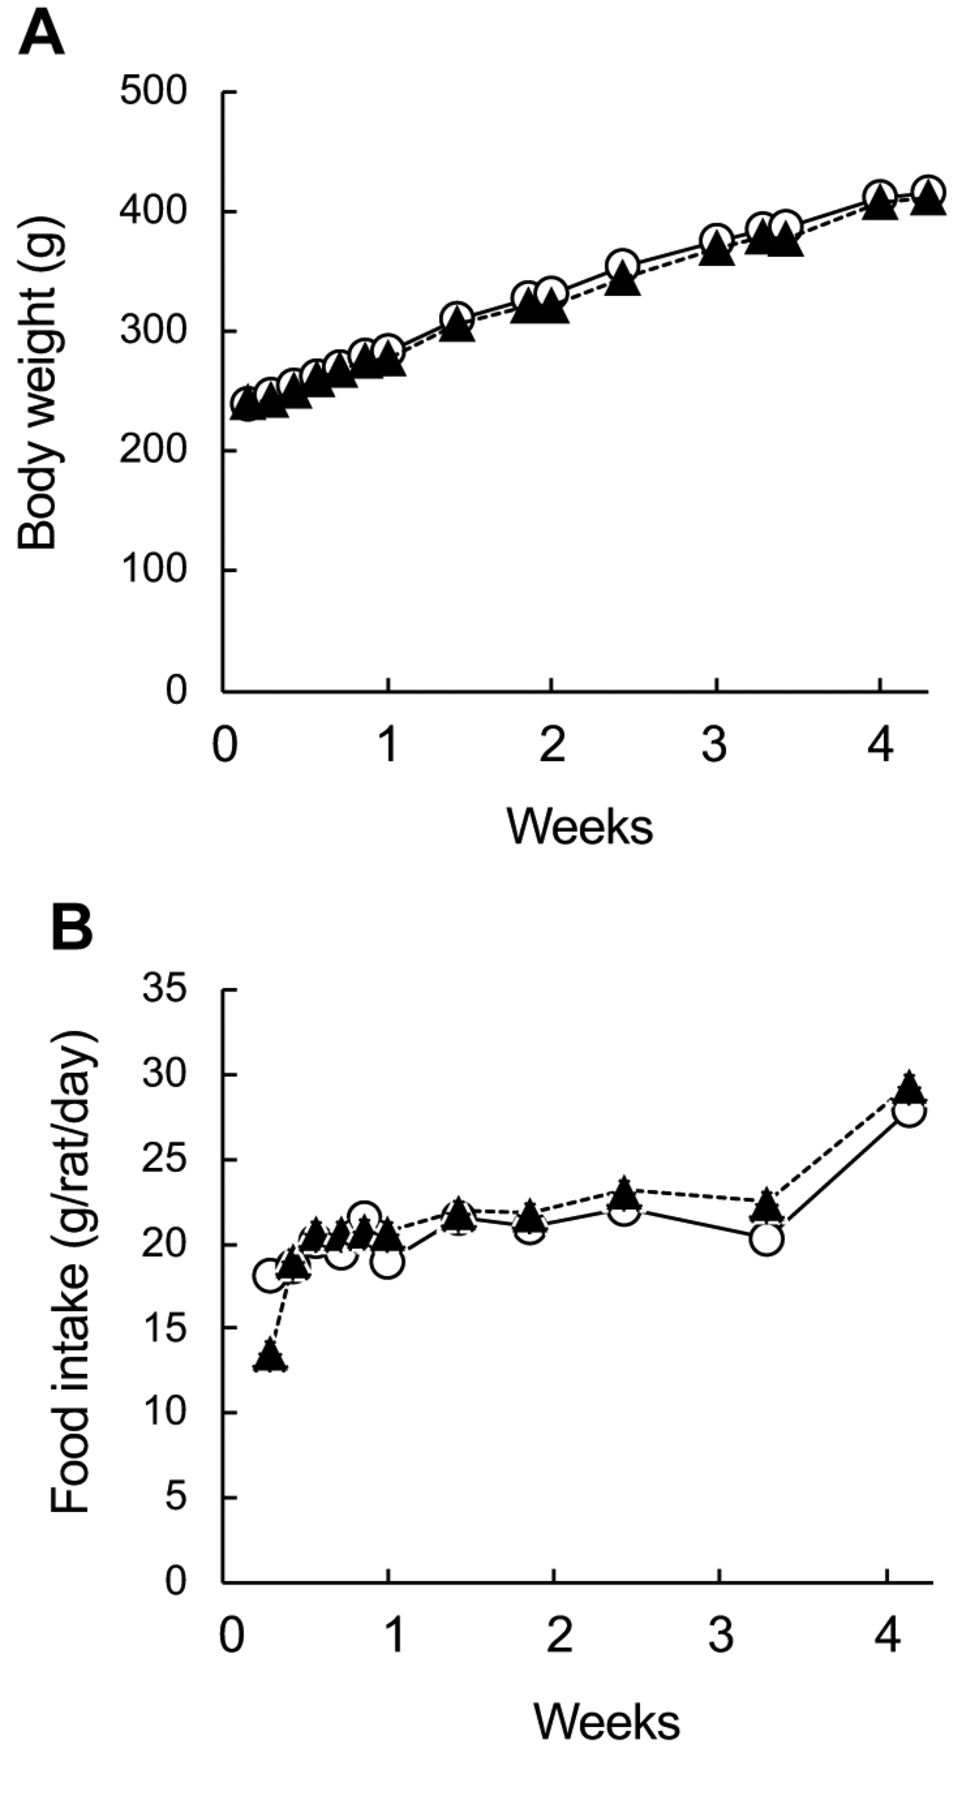
Growth parameters, liver weights and histopathology. Body weights of CD and HFrD groups indicted the similarly increased during the 4-weeks consumption (Figure 1A). The food intakes of CD and HFrD groups were similar (Figure 1B). At the necropsy at the end of the feeding period, the absolute and relative weights of the livers of the HFrD-fed group were significantly increased compared with those in the CD group, and discoloration of the liver was observed in one of six animals (Table II). Histopathology showed that the severity of periportal vacuolation and macrovesicular fatty change in the hepatocytes increased in the HFrD group compared to those in the CD group (Table III). Remarkable HFrD-related changes were not observed in the duodenum, jejunum, and ileum (data not shown).

Effects of fructose consumption on (A) body weights and (B) food intakes. Male SD rats were assigned to two respective diet groups: control diet (CD, ○) and high-fructose diet (HFrD, ▲) for 4 weeks. Data indicate mean±S.D. (n=6). There were no significant differences between CD and HFrD groups (p<0.05).
Effects of fructose consumption on organ weights, hepatic necropsy, and histopathology.
Effects of fructose consumption on plasma biological parameters.
Plasma biochemical parameters. At week 4, plasma triglycerides and phospholipid levels were significantly increased in the animals given HFrD compared with those of the CD group (Table III). Total cholesterol levels also tended to increase, without achieving significance. There were no effects on glucose and total protein levels.
Plasma hepatotoxic enzyme activities. Six hepatotoxic related enzyme activities were evaluated weekly; the results are shown in Figure 2. Compared to the CD group, the HFrD-fed group showed a significant increase or upward trend in plasma ALT activities after the third week of feeding (Figure 2A), and a significant increase or upward trend in plasma GLDH activities after the first week of feeding (Figure 2B). Plasma LAP activities showed a significant increase after the first week of feeding (Figure 2C). The other three enzyme activities, ALP, γ-GTP and 5′-NT, were not affected by the consumption of HFrD throughout the feeding period (Figure 2D-F).

Effects of fructose consumption on plasma hepatotoxic enzyme activities. Male SD rats were assigned to two respective diet groups: control diet (CD, open column) and high-fructose diet (HFrD, closed column). Blood samples were collected from the subclavian vein before allocation and at 1, 2, and 3 weeks after allocation, and from the abdominal aorta at 4 weeks without fasting. (A) ALT, alkaline phosphatase; (B) GLDH, glutamate dehydrogenase; (C) LAP, leucine aminopeptidase; (D) ALP, alkaline phosphatase; (E) γ-GTP, gamma glutamyl transferase; (F) 5′-NT, 5′-nucleotidase. Data indicate mean±S.D. (n=6). *Statistically different vs. CD group (p<0.05).
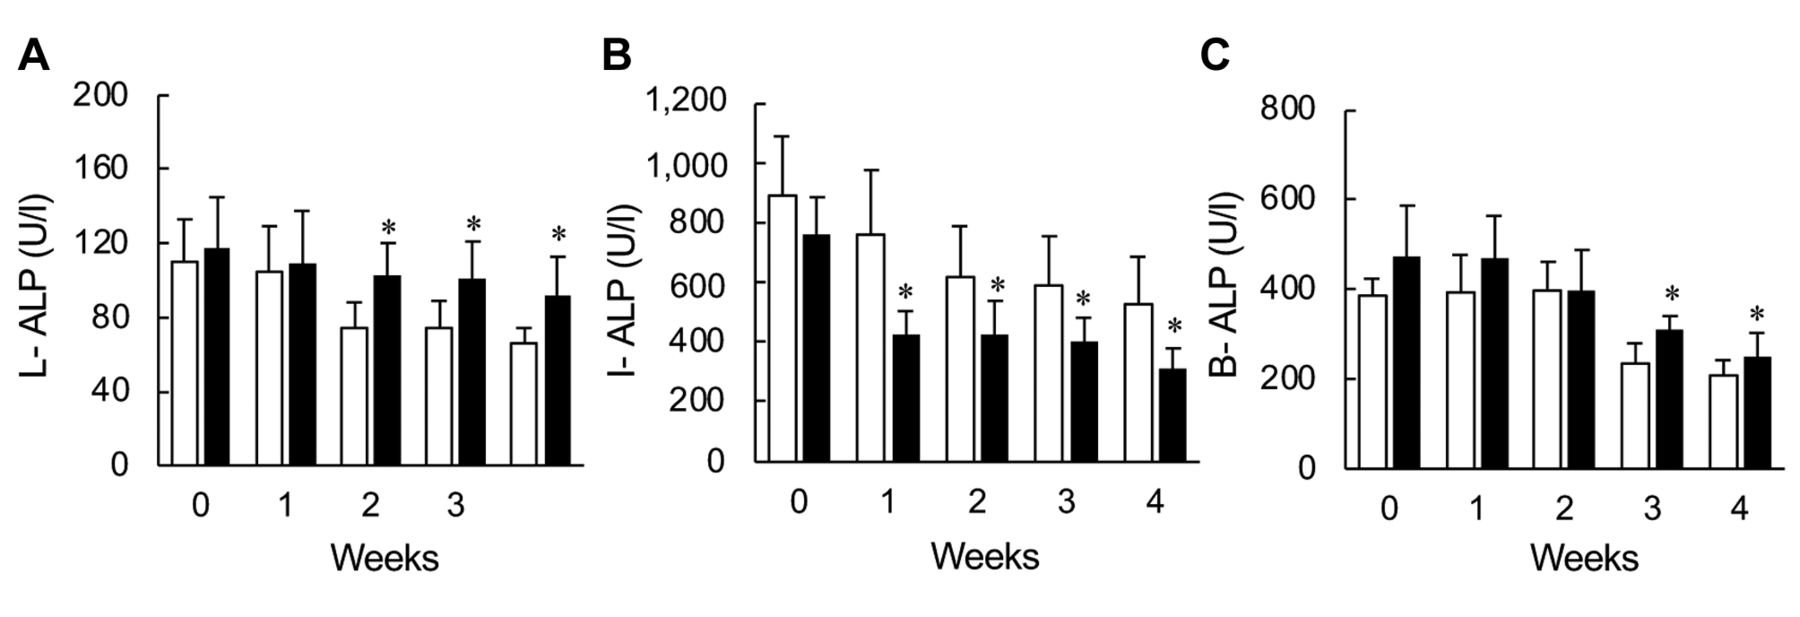
Plasma isozyme activities of ALP. Among three isozymes of ALP analyzed in this study, the plasma L-ALP isozyme activities increased significantly from the second week after feeding (Figure 3A). The plasma I-ALP isozyme activities of HFrD group showed a significant decrease after the first week of feeding (Figure 3B), and plasma B-ALP isozyme activities showed a significant increase after the third week of HFrD feeding (Figure 3C).

Effects of fructose consumption on plasma isozymes. Male SD rats were assigned to two respective diet groups: control diet (CD, open column) and high-fructose diet (HFrD, closed column). Blood samples were collected from the subclavian vein be-fore allocation and at 1, 2, and 3 weeks after allocation, and from the abdominal aorta at 4 weeks without fasting. (A) L-ALP, liver-type alkaline phosphatase isozyme; (B) I-ALP, small intestinal-type alkaline phosphatase isozyme; (C) B-ALP, bone-type alkaline phosphatase isozyme. Data indicate mean±S.D. (n=6). *Statistically different vs. CD group (p<0.05).
Tight junction-related gene expression in small intestine. The expression of Cl-1 was significantly decreased in the animal consuming HFrD for 4-weeks (Figure 4A). However, the expression of other three genes, Cl-4, Zo-1, and Oc, was similar between the CD and HFrD groups (Figure 4B-D).
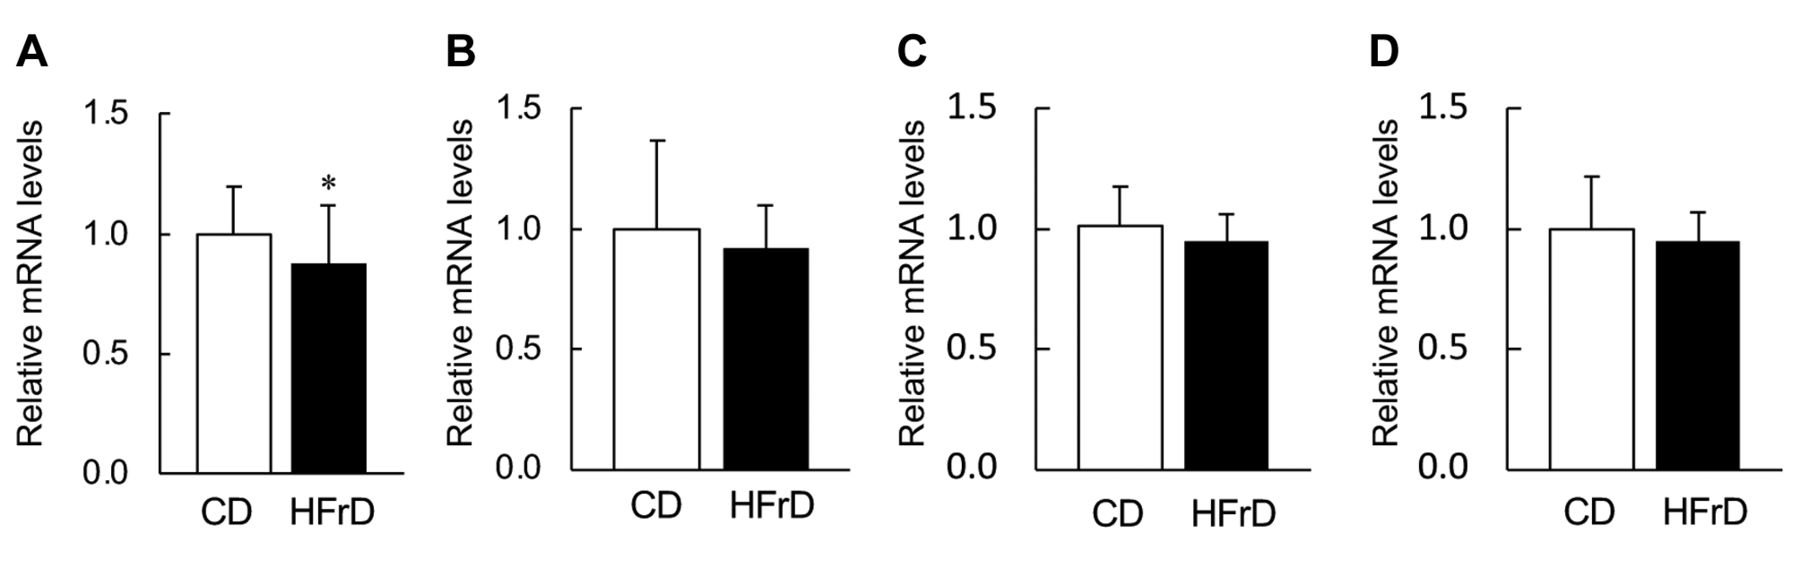
Effects of fructose consumption on tight junction-related gene expression in the small intestine. Male SD rats were assigned to two respective diet groups: control diet (CD, open column) and high-fructose diet (HFrD, closed column). (A) Cl-1, claudin-1; (B) Cl-4, claudin-4; (C) Zo-1, zonula occludens-1; (D) Oc, occluding. Blood samples were collected from rats without fasting. (a) Data indicate mean±S.D. (n=6). *Statistically different vs. CD group (p<0.05).
Discussion
Metabolic syndrome is a chronic disease of global importance, and if lifestyle modification and treatment are neglected, NAFLD can develop and progress to NASH and cirrhosis, increasing the risk of developing hepatocellular carcinoma in the future (21, 22, 24). One of major dietary factors for NAFLD induction is well known to be daily consumption of high-fat diet, and therefore, many research groups have aimed to find foods and food ingredients that can prevent high-fat diet induced NAFLD-like symptoms using animal models (25, 26). Additionally, daily intake of fructose-rich foods is also known to be a risk factor for NAFLD, and consequently metabolic syndrome (27-30), but most of the biological effects of fructose are unnoticed or asymptomatic. In order to prevent the NAFLD related with excess fructose intake, it is important to be able to detect physiological changes occurring before pathological alterations develop. In this study, the physiological changes that occur when rats are fed a diet containing excessive amounts of fructose compared with those of rats fed a diet completely free of fructose was investigated on the viewpoint of finding hepatotoxicity biological markers using a rat model and explored those biomarkers that could be used for early and convenient monitoring of the effects of excessive fructose intake.
We employed the modified AIN-93G based purified diet, in which 10% sucrose was replaced by corn starch as the CD (Table I). For the HFrD, every carbohydrate in the CD was replaced by fructose to obtain clear effects of excessive consumption of fructose. During 4-weeks consumption, the food intakes of the CD and HFrD groups were similar (Figure 1B). This result indicates that the intake of nutrients except for the carbohydrate source was equal between the CD-fed group and HFrD-fed group during the feeding period. Additionally, the plasma levels of total protein, which are used as markers of malnutrition (31), were not different between the groups (Table III), indicating that the nutritional status between both diet groups was also similar. However, the liver weights and severity of macrovesicular fatty change in the hepatocytes were increased in the HFrD group compared with those in the CD group (Table II), although there was no difference in their body weights (Figure 1A). Many studies have reported that excessive fructose intake induces accumulation of triglycerides in the liver and hyperlipidemia due to activation of de novo synthesis of fatty acids in the liver (14, 18, 32). In the present study, significant increases in plasma triglycerides and phospholipids were observed in the HFrD-fed group (Table III). Furthermore, there were positive correlations between the plasma triglycerides and liver weights (r=0.50 or greater). These results suggest that the increased liver weights and macrovesicular fatty change of the hepatocytes in the HFrD group were caused by the accumulation of triglycerides in the liver. In other words, the daily consumption of excessive fructose for 4 weeks induced a typical NAFLD-like situation, as seen in other reports (12, 33, 34).
In this study, periportal vacuolation in the hepatocytes was observed in the HFrD group after 4-weeks consumption (Table II). Plasma ALT activates were also significantly increased in the HFrD group (Figure 2B). Additionally, plasma LAP activities, which is a parameter of hepatic and biliary injury, increased in the HFrD group at 4 weeks, although the other parameters ALP, γ-GTP, and 5′-NT, were not changed (Figure 2). The 50-70% of consumed fructose is absorbed into the body via GLUT5 in the brush border of the small intestine, and then about 70% of that is metabolized in the liver (17, 18). Briefly, the fructose taken up into the liver is firstly converted to fructose monophosphate by ketohexokinase C, and further converted to glyceraldehyde triphosphate, which is a substrate for the synthesis of triglycerides, and very-low-density-lipoproteins (35-37). The expression of ATP citrate lyase is increased, and, finally, inflammation and hepatocyte cell death are induced by damaging intracellular organelles and mitochondria. Therefore, the changes observed in the periportal vacuolation in the hepatocytes and ALT activities under the excessive consumption of fructose can be explained by the hepatocyte cell death, caused by the above mechanism.
Our results in the histopathology and clinical analysis clearly indicated the effects of fructose on the hepatic and biliary systems. The main purpose of this study was to explore biomarkers that could be used for the early and convenient monitoring of the effects of excessive fructose intake. Hence, we followed the variation in the markers of the hepatic and biliary systems over time from immediately after the start of the excess fructose consumption to week 4. ALT, GLDH, and LAP activities were increased from the 3rd, 2nd, and 1st weeks, respectively, but the other enzyme activities were not changed (Figure 2). These results indicated that ALT, GLDH, and LAP activities might be candidates as biomarkers of excessive fructose intake. Furthermore, we investigated that the plasma ALP isozymes. Among three types of plasma ALP isozymes, liver type (L-ALP) activity was significantly increased from the 2nd week, and intestine-type (I-ALP) activity was decreased from the 1st week (Figure 3A and B), although total plasma ALP activities were not altered, indicating that the plasma L-ALP and I-ALP activities might be used as biomarkers for the early stages of the excessive consumption. A possible cause of such increases could be the effect of fructose on the intestinal microbiota because excessive fructose intake has been reported to increase inflammatory cytokine concentrations in the intestine (38-40). The expression of the intestinal tight junction proteins is reported to be decreased, resulting in increased endoplasmic reticulum stress, and increased intestinal membrane permeability (38, 41, 42). Furthermore, excessive fructose intake induces abnormal growth and reduced diversity of the intestinal microbiota (38, 41), and large amounts of lipopolysaccharides (LPS) produced by the intestinal bacteria are released from the intestinal lumen into the portal vein (13, 42-44). The liver detects the influx of LPS and other pathogen-associated molecular patterns (PAMPs) in the bile ducts, and consequently L-ALP production might be increased in the liver to detoxify the PAMPs (45-47). Our results support these hypotheses, because gene expression of Cl-1, which is concerned with the tight junction, was significantly decreased (Figure 4A). The activity of another ALP isozyme in the plasma (B-ALP) was also increased from the 3rd week (Figure 3) by the consumption of excess fructose. The scientific reasons for the changes in these parameters are the subject of future investigation.
In conclusion, our results indicate that ALP isozyme including L-ALP and I-ALP, and B-ALP analysis in combination with GLDH, ALT, and LAP activities in the plasma samples could be a useful tool to detect the physiological changes induced by excessive fructose intake at an early stage of the development of NAFLD, and consequently metabolic syndrome.
Acknowledgements
The Authors would like to thank the invaluable contributions of Toshiyuki Shoda, Tadakazu Takahashi, Taku Masuyama, Takuya Abe, Iori Tsubakihara, Masumi Takeda, Katsunori Ryoke, Makoto Saito, Ayaka Iketani and the staff at the Toxicology Research Laboratories, Central Pharmaceutical Research Institute, Japan Tobacco Inc. (Yokohama, Japan). This research was partially funded by the Japan Society for the Promotion of Science KAKENHI, grant number 21H03361.
Footnotes
Authors’ Contributions
Y.S., A.K. and H.S. conceived the study. Y.S., K.K., K.T. and T.Y. performed the experiments. A.K., D.Y. and H.S. provided scientific advice. Y.S. wrote the paper. D.Y. and H.S. revised the paper.
Conflicts of Interest
The Authors declare that they have no conflicts of interest in relation to this study.
- Received November 25, 2022.
- Revision received December 10, 2022.
- Accepted December 12, 2022.
- Copyright © 2023, International Institute of Anticancer Research (Dr. George J. Delinasios), All rights reserved
This article is an open access article distributed under the terms and conditions of the Creative Commons Attribution (CC BY-NC-ND) 4.0 international license (https://creativecommons.org/licenses/by-nc-nd/4.0).


