


Abstract
Background: The aim of this study was to compare three different methods for measurement of cochlear duct length (CDL) in the clinical setting for two different imaging modalities, namely computed tomography (CT) and cone-beam computed tomography (CBCT). Patients and Methods: One hundred temporal bone data sets (CT: n=50; CBCT: n=50) of non-malformed cochleae were retrospectively analyzed using three different CDL estimation techniques: 3D curved multiplanar reconstruction (cMPR), 2D cMPR and the A-value formula. Results: The data sets belonged to 60 patients (34 males, 26 females; mean age=50.28±18.58 years). For both imaging modalities, application of the 3D cMPR estimation technique led to significantly greater mean CDL values than the two-dimensional methods (p<0.0083). The CDL measurements viewed in CT imaging software were significantly shorter than the corresponding CBCT measurements (p<0.05). Using a linear mixed model, differences in CDL by sex (p=0.796), age (p=0.377) and side of ear (p=0.690) were not significant. Conclusion: The 3D cMPR technique was found to provide the most accurate in vivo CDL measurement in non-malformed cochlea in both CT and CBCT imaging compared to 2D methods. The study results also suggest that the higher spatial resolution in CBCT imaging results in more precise CDL determination than in CT.
- Cochlear duct length
- 3D curved multiplanar reconstruction
- computed tomography
- cone beam computed tomography
- A-value
Cochlear implant surgery requires accurate knowledge of the cochlear duct length (CDL) as the basis in treatment planning. The literature reveals varying percentages of interindividual differences between CDL according to gender (1, 2), ethnicity (1-3) and imaging modality (4-6) used to determine CDL. Over-insertion of the electrode during cochlea implant surgery may result in trauma to the cochlear structure and loss of residual hearing (7, 8). However, electrode under-insertion or insufficient electrode length can lead to inadequate coverage of the available frequency range and unsatisfactory hearing with an implant (9, 10). In contrast, an optimal electrode length that matches patient-specific cochlear anatomy and corresponds to the tonotopic locations greatly enhances speech recognition (11, 12).
To date, only few studies have compared three-dimensional (3D) with two-dimensional (2D) CDL estimation methods. In older studies, 3D reconstruction proved superior to 2D CDL estimation techniques due to reduced influence of the cutting-angle effect (13-16). Würfel et al. were the first to use a 3D curved multiplanar reconstruction (cMPR) model in cone-beam computed tomography (CBCT) scans to accurately represent the cochlea (5). Meng et al. followed with a study of 3D cMPR for CDL determination in computed tomography (CT) scans (17).
However, we were unable to identify any studies directly comparing 3D and 2D CDL estimation methods using both CT and CBCT imaging in a clinical setting. This retrospective study therefore had multiple aims, namely i) to compare three different methods of CDL measurement, ii) to analyze CDL measurements for the imaging modalities CT and CBCT, and iii) to determine possible effects of sex and age on CDL, as well as detect intra-individual differences in CDL between the left and right ear.
Patients and Methods
Patients and datasets. This retrospective study was approved by the local Ethics Committee (approval number: 2021-15895). One hundred radiological data sets (Bundeswehr Central Hospital Koblenz) from 60 patients (34 males, 26 females) were retrieved for this study. The patients had undergone an anatomical evaluation of their temporal bones with either CT (n=50 data sets) or CBCT (n=50 data sets) as part of a clinical visit for differential diagnosis of hearing loss between October 2012 and November 2016. We excluded data sets when anomalies were present in either the cochlea or the temporal bone.
Cochlea length measurement. For all included data sets, CDL was evaluated with three separate methods:
Method 1: 3D cMPR was constructed from manually defined points along the lateral wall of the bony cochlea (Figure 1), using the technique described by Würfel et al. (5).
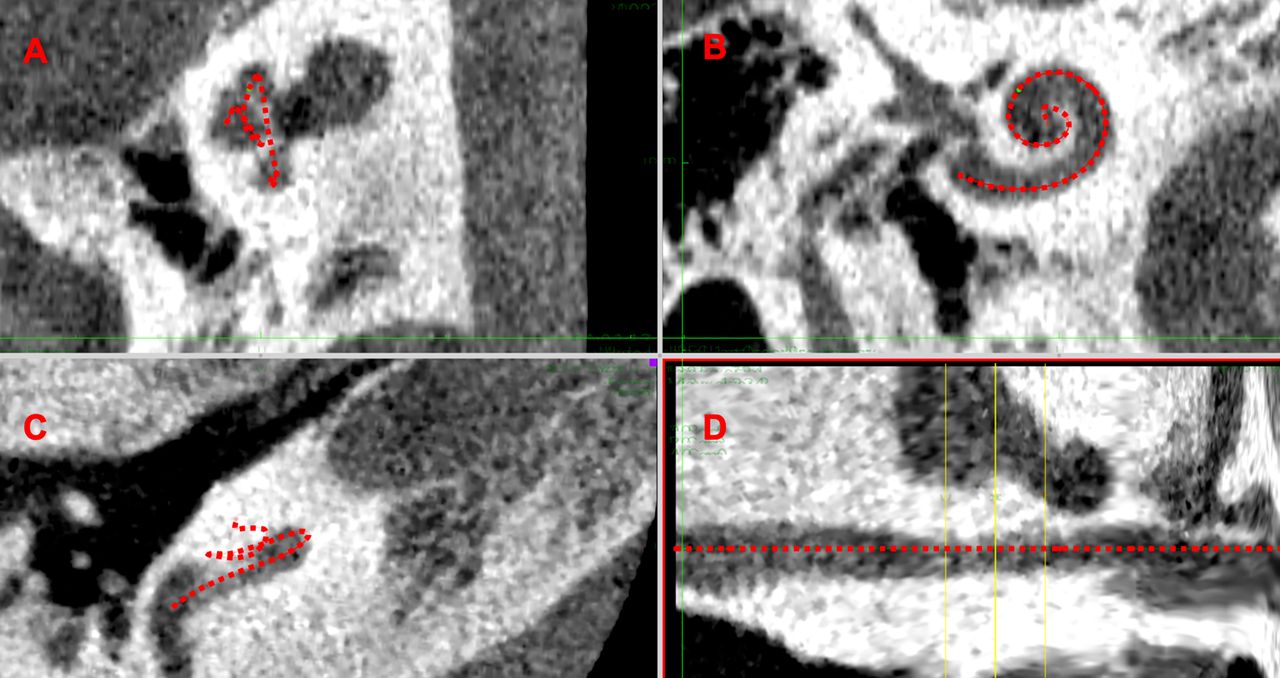
Method 1: 3D curved multiplanar reconstruction (cMPR). 3D cMPR of the cochlea, indicated by the red line in the paracoronal plane (A), transverse plane (B), unformatted plane of the cochlea (C) and cMPR (D).
Method 2: CDL estimation based on the diameter of the basal turn (A-value) (Figure 2) by applying the following equation for complete CDL: CDL (measured at the organ of Corti)=4.16A−3.98. The method is presented in detail by Alexiades et al. (18).

Method 2 ‐ cochlear duct length estimation via A-value determination, indicated by the red line.
Method 3: This CDL estimation method relied on measurements performed on 2D cMPR images constructed at the level of each of the three turns (basal, middle and apical). Examination of the cochlea was performed for the transverse plane, with levels aligned according to the center of the osseous cochlear structure. After angle correction, the individual turn lengths were added to derive the total CDL (Figure 3).

Method 3 ‐ 2D curved multiplanar reconstruction (cMPR). Application of 2D cMPR method with level alignment in the transverse plane, indicated by red lines (A, B, and C), followed by measurements of the basal turn (A), middle turn (B) and apical turn (C).
Statistical analysis. Initially, an analysis of variance test was used to test for significant differences between the three CDL estimation methods within each of the two imaging modalities. Post-hoc testing for differences between the CDL estimation methods was performed with either a paired Student’s t-test or Wilcoxon signed-rank test. The significance level was set at p<0.05 and the Bonferroni-corrected p-value of 0.0083 was used to adjust for multiple testing.
A linear mixed model was used to analyze possible differences in length measurement between the examination modalities CBCT and CT. The dependent variable was cochlear length measurement. Fixed effects were defined as age, examination modality, gender, measurement method and side; the individual patient was defined as a random effect.
Results
The mean age of the study population was 50.28±18.58 years. The baseline characteristics of the study population are given in Table I.
Baseline characteristics of the study population.
Analysis of variance detected significant differences in CDL between the three estimation methods applied for both CT (p<0.001) and CBCT (p<0.001) imaging modalities.
Comparison of CDL estimation method by CT imaging. The mean CDL determined by application of 3D cMPR measurement technique was 31.964±1.668 mm and that using 2D cMPR was 31.056±1.825 mm for the CT images examined.
When using the equation (A-value) for CDL estimation, the mean length was 31.151±1.631 mm. The CDL was significantly longer (mean difference Δ=0.908 mm; p<0.001) when measured using the 3D cMPR method versus 2D cMPR. CDL estimation with the 3D cMPR method resulted in significantly greater (mean difference Δ=0.812 mm; p<0.001) CDL values than the A-value equation. The comparison between the results of the 2D cMPR measurement and those of the A-value equation revealed a slighter greater CDL estimation when using the latter method. This difference of 0.096 mm did not reach statistical significance (p=0.604).
Comparison of CDL estimation methods by CBCT imaging. The average CDL was 33.146±1.947 mm when using the 3D cMPR technique and CBCT imaging. The 2D cMPR method led to a mean CDL of 31.844±2.108 mm and the A-value equation generated a mean CDL of 32.625±1.667 mm for the CBCT imaging modality.
Comparison between the 3D and 2D cMPR methods showed significantly greater CDL (mean difference Δ=1.302 mm; p<0.001) when using the 3D cMPR technique. The CDL estimation with the 3D cMPR method led to significantly greater CDL values (mean difference Δ=0.521 mm; p<0.007) than using the A-value equation. In CBCT imaging, use of the A-value equation led to greater CDL values than the 2D cMPR technique. This difference of 0.781 mm was statistically significant (p=0.009).
Results of the linear mixed model. When comparing the imaging modalities, the linear mixed model detected a significant difference (p=0.005) in mean CDL estimations. The CDL measurements viewed in CT imaging software were 1.222 mm shorter [95% confidence interval (CI)=−2.064 ‐ −0.380 mm] than the corresponding CBCT measurements. The CDL for males was on average 0.110 (95% CI=−0.959 ‐ −0.739) mm shorter than that for females but this difference was not significant (p=0.796). Even though the mean CDL for the right ear was 0.051 (95% CI=−0.200-0.302) mm longer than that of the left ear, the difference was not significant (p=0.690). Regarding age, the model showed an average CDL increase of 0.010 (95% CI=−0.125-0.033) mm per year (Figure 4), which did not reach statistical significance (p=0.377).

Linear mixed model. Linear mixed model for effect of age on cochlear duct length for the two imaging modalities and three different estimation methods. CBCT: Cone-beam computed tomography; cMPR: curved multiplanar reconstruction; CT: computed tomography.
Finally, a linear mixed model incorporating the effects of measurement method, age, sex and ear was used to calculate the estimated mean for the three CDL estimation techniques to allow comparison with the literature (Table II).
Results of linear mixed model for estimated mean cochlea duct length according to calculation method and imaging modality.
Discussion
To the best of our knowledge, this is the first study that directly compared 3D and 2D CDL estimation methods using both CT and CBCT imaging in a clinical setting. The 3D cMPR method for CDL measurement proved more accurate than both 2D estimation techniques. These findings are in line with the literature (19) and highly relevant from a clinical perspective. Rivas et al. found that selection of a cochlear implant electrode array was influenced by the choice of algorithm used in CDL determination, with mean absolute differences of 1.15 mm between CDL estimations (20). Timm et al. suggested that CDL estimations are not suitable for clinical use, where accuracy is paramount in each individual patient case as over- or underestimation of CDL was found in 33% of the analyzed cochleae (21). Thus, it follows that the degree of variability involved in CDL determination may lead to completely different choices of cochlear implant electrode array, depending on the manufacturer-specific threshold values for the array type.
Most of the current methods of CDL estimation in use today rely on calculations from parameters measured in the basal turn (18, 22). However, due to the complex anatomy of the cochlea, these formulae remain approximations, even though many authors have attempted to improve the accuracy of these equations and models by adding additional parameters such as basal turn width (22) and spiral coefficients (23, 24). In a recent analysis of methods and results, Koch et al. detailed the many pitfalls associated with 2D CDL estimations and suggested that the 3D cMPR method significantly reduces the time needed to perform reconstruction compared to the use of histological sections (19). Another study found that manual CDL determination by cMPR required an average of 9.3±0.72 minutes per cochlea, while a semi-automated approach with a new otological planning software program needed only 5.9±0.69 minutes (25).
In this study, the estimated means for 3D cMPR were 31.964±1.668 mm with CT and 33.146±1.947 mm with CBCT. Although measured along the lateral wall, these CDL correspond more with CDL measurements taken at the level of the organ Corti (16, 26). This difference was attributed partly to the study population itself, whose A-values show that the included patients belonged to the middle group with smaller cochleae as defined in a study by Escude et al. (24). In addition, the strict intraluminal measurement performed in our study may have led to systematically shorter CDL estimations. Finally, Koch et al. note there is a considerable amount of variation surrounding CDL in studies utilizing CT scans due to inter-observer variability when placing the curve, the lack of standardized guidelines as to where measurements are to be taken, and differences between observers in apex selection (19). Standardization of CDL measurement protocols may improve both accuracy and consistency in CDL determination.
In this study, CBCT provided more accurate CDL estimations than CT scans, irrespective of the calculation method used. These findings are in accordance with the literature in CBCT imaging in cadaveric studies, in which CBCT displayed good agreement for cochlear metrics (27, 28). There is, however, considerable variation between CBCT and CT scanners and their respective viewing software programs, which might considerably influence CDL determination (29). 3D cMPR relies on accurate detection of structures in radiological imaging, a factor that is positively influenced by the higher spatial resolution available in CBCT. The lower radiation dosages compared to conventional CT make CBCT imaging an optimal choice for CDL estimation.
This study is mainly limited by the small sample size and single-center design. Future research with thinner scanner slices is needed to confirm these findings.
Conclusion
The 3D cMPR technique provides the most accurate in vivo measurement of CDL for both CT and CBCT imaging compared to 2D methods in non-malformed cochlea. This should be considered in treatment planning, seeing how variations in CDL determination may lead to a completely different choice of cochlear implant electrode array, depending on the manufacturer-specific threshold values for the array type.
The study results also suggest that the higher spatial resolution in CBCT imaging results in more precise CDL determination than using plain CT measurements.
Footnotes
This article is freely accessible online.
Authors’ Contributions
All Authors conceived and designed the analysis, collected the data, contributed data, performed the analysis, and wrote the article.
Conflicts of Interest
None.
- Received June 26, 2021.
- Revision received July 20, 2021.
- Accepted July 21, 2021.
- Copyright © 2021 International Institute of Anticancer Research (Dr. George J. Delinasios), All rights reserved
References
In this issue


Jump to section
Related Articles
Cited By...
- No citing articles found.