


Abstract
Background/Aim: In vivo studies on pathogenesis of type 2 diabetes mellitus (T2DM) have been reported, however, the relationship between insulin-receptor substrate 1 (IRS1) and the area of Langerhans’ islets was unknown. Therefore, a correlation between both parameters was assessed. Materials and Methods: Diabetic groups were fed with a high-fat diet (HFD) and injected with three different doses of streptozotocin, namely 25, 35 and 45 mg/kg, and compared to a control group after 9 weeks. Results: Administration of HFD/streptozotocin increased the level of fasting blood glucose but reduced the level of IRS1 and the area of Langerhans’ islets in diabetic groups. The coefficient of correlation between IRS1 and area of Langerhans’ islets was 0.259 (p=0.232). In addition, the coefficient of correlation for fasting blood glucose with the area of Langerhans’ islets and IRS1 was −0.520 (p=0.011) and −0.603 (p=0.002), respectively. Conclusion: The reduction of IRS1 was weakly correlated with the destruction of Langerhans’ islets, suggesting there is an intermediate step between both parameters.
- Diabetes mellitus
- Wistar rats
- high-fat diet
- streptozotocin
- insulin-receptor substrate 1
- Langerhans’ islet
The prevalence of diabetes mellitus for all age groups worldwide was estimated to be 4.4% in 2030, in which it will increase in people above 65 years old (1). In Asia, the dramatic rise of diabetes is largely due to the rise in risk factors, including overweight and obesity (2). According to the fact that the prevalence of diabetes rises every year, numerous studies are conducted to investigate its pathophysiology and therapy. There are two main types of diabetes: type 1 diabetes mellitus, which is an autoimmune disease with damage of pancreatic β-cells, and type 2 diabetes mellitus (T2DM), which is characterized by insulin resistance when the body is unable to use insulin and β-cells are unable to compensate (3, 4).
Physiologically, insulin binds to its receptor, which belongs to the superfamily of receptor tyrosine kinases. This results in phosphorylation of specific tyrosine residues, which bind to phosphorylated juxta membrane domain residue tyrosine 960, a family of large docking proteins called insulin-receptor substrate (IRS). There are two IRS proteins in humans: IRS1 and IRS2, which play a role in the insulin-signaling pathway. The studies by Rondinone et al. (5) and Pederson et al. (6) demonstrated that IRS1 is the main docking protein for phosphoinositide-3-kinase, which is associated with an increase in glucose uptake by cells. Consequently, levels of insulin in cells can be assessed by measuring the tyrosine phosphorylation of IRS1, as a downstream product of insulin binding to cell receptors (7). In addition, decreasing levels of IRS1 have been observed in various animal models of insulin resistance, suggesting its role in the development or progression of T2DM (8-12).
T2DM characterized by insulin resistance occurs in the cells of muscles, liver and fat tissue (13). In insulin resistance, insulin binds to its receptor but the signal is not sent into the cell, causing no glucose uptake and increasing blood glucose’s level. The proportion of insulin resistance compared with β-cell dysfunction differs among individuals, in which some primarily have insulin resistance and a minor defect in insulin secretion, while others have slight insulin resistance but are primarily lacking insulin secretion (14). In the early phase of T2DM, it was found that the mass of β-cells in the Langerhans’ islet expands in order to increase insulin secretion. However, when the disease progressed, approximately half of the β-cells disappeared (15). In animal models, volume density of the islets, islet diameter, and β-cell number have been assessed in order to study the pathophysiology of T2DM (16).
Several investigators have reported that rats given a single high-dose injection of streptozotocin intraperitoneally or intravenously endured rapid chemical destruction of the pancreatic β-cells (17-23). Furthermore, other groups demonstrated that the combination of a high-fat diet (HFD) and low-dose injection of streptozotocin in rats served as an alternative animal model for T2DM with the characteristic of insulin resistance (17, 18). Numerous in vivo studies on pathogenesis of T2DM by using animal models receiving an HFD combined with multiple injections of a low dose of streptozotocin have been reported for the study of prevention and treatment of diabetes (17-23). However, the relationship between IRS1, an important element in insulin-signaling pathways, and Langerhans’ islet area has not been fully elucidated. In the current study, we assessed the correlation between IRS1 and the area of Langerhans’ islets in a rat model of T2DM.
Materials and Methods
Animal husbandry and treatment. All animal experimental protocols were conducted in Animal Facility of Mochtar Riady Institute for Nanotechnology in accordance with the National Research Council Guide for the Care and Use of Laboratory Animals. This study protocol was approved by Mochtar Riady Institute for Nanotechnology Ethical Committee, Indonesia (02.1505027). A total of 32 male Wistar rats at 6 weeks old were purchased from PT. Indoanilab (Bogor, Indonesia). All animals were housed in polycarbonate plastic cages (two rats per cage) with wood-shaving bedding, maintained in a controlled room at temperature 25±2°C, with humidity 50±10%, and 12/12 h of light-dark cycles with ad libitum access to food and water. Male Wistar rats were used as they are widely used as diabetic animal model and male pancreatic islet β-cells are more prone than female ones in exhibiting streptozotocin-induced cytotoxicity. Furthermore, female rats are resistant to the effects of low-dose streptozotocin (21, 23-25).
Following 1 week of acclimatization, rats were randomly divided into a control group (n=8) and three different treated groups (total n=24). Federer formula was used to determine the number of samples for each group after adjustment with 80% successful rate in inducing diabetes. The animal model, experimental design and HFD composition in this study were performed according to Zhang et al. (21) and Furman et al. (10) with modification (Figure 1). The rats in the control group were fed with regular basal diet based on AIN76 rodent diet formula (67.7% of carbohydrate, 11.5% of lipid and 20.8% of protein) and had intraperitoneal injection with saline. The diabetic groups were fed with an HFD: 48% of carbohydrate, 22% of lipid and 20% of protein (Food Technology Laboratory, Bogor Agricultural University, Bogor, Indonesia) for 4 weeks and were further divided into three different doses of streptozotocin: 25, 35 and 45 mg/kg body weight (BW), with n=8 in each group. The streptozotocin injections were administered intraperitoneally twice within a 1-week interval. The blood was collected at week 0, 4, 5 and 9 from the tail after 10 hours of fasting at night and checked for fasting blood glucose using Easy Touch Glucose test strip (CEI Technology Inc., Guishan, Taoyuan, Taiwan, ROC). Four weeks after the second injection of streptozotocin, at week 9, all rats were sacrificed by exsanguination after anesthesia using a combination of 40-80 mg/kg BW ketamine and 5-10 mg/kg BW xylazine. The liver was collected and stored in phosphate buffered saline for protein analysis. The pancreas was removed and fixed in 10% buffered neutral formalin for histological analysis.

The experimental design of this study. *At 25, 35 or 45 mg/kg bodyweight.
Histological analysis. Fixed pancreas in 10% buffered neutral formalin was dehydrated in a series of increasing alcohol concentration (70-100%), immersed in xylene and embedded in paraffin. The paraffin block of pancreas was for 4 μm thickness using a microtome, then the sections were deparaffinized in xylene and rehydrated through a series of decreasing ethanol concentration (100-70%) and stained with hematoxylin and eosin solution. Histological specimens of pancreas were observed and the area of Langerhans’s islets were measured using ZEN microscope software (Zeiss, Oberkochen, Germany) at a magnification of 100×.
Protein isolation and analysis. Liver protein stored in phosphate-buffered saline, weighed 50-100 g and transferred into radio-immunoprecipitation assay buffer (Abcam, Cambridge, UK), after adding with proteinase inhibitor to prevent protein degradation. Supernatant was collected using a combination freeze-thaw method and mechanical grinding using a tissue homogenizer. Total protein concentration in the supernatant was measured using Bradford Kit (Bio-Rad, CA, USA). Levels of tyrosine-phosphorylated IRS1 were measured using My BioSource Elisa Detection Kit (San Diego, CA, USA).
Statistical analysis. Data were analyzed for normality based on Sapiro-Wilk test of normality. Mean differences in fasting blood glucose (FBG), IRS1 and area of Langerhans’ islets were analyzed with Mann-Whitney using SPSS software version 23 (IBM, Armonk, NY, USA). The correlation among variables were analyzed with Spearman’s Rho correlation, with p<0.05 set as statistical significance.
Results
Dose-dependent increment in FBG of T2DM rats. Following 10 hours of fasting, blood was taken from rat tails and glucose measured by test strips. The FBG levels at week 9 of rats injected with streptozotocin of 25 mg/kg, 35 mg/kg and 45 mg/kg were 141.5±26.7 mg/dl, 232.5±81.8 mg/dl and 353.75±94.0 mg/dl, respectively. Average levels of FBG in rats receiving streptozotocin of 35 mg/kg and 45 mg/kg were statistically significantly higher at week 9 than at week 0 (Table I; p=0.001). The comparison between diabetic groups were analyzed using non-parametric Mann-Whitney test and showed statistically significantly higher FBG levels at week 9 between rats treated with 35 to 45 mg/kg compared with 25 mg/kg (p=0.005 and p=0.027, respectively (Table I). Using a cut-off value for FBG of 140 mg/dl, as described previously (21), there were no hyperglycemic rats in the control group, while in groups injected with streptozotocin at 25 mg/kg, 35 mg/kg and 45 mg/kg the proportion was 50.0%, 87.5% and 87.5%, respectively (Figure 2).
Fasting blood glucose (FBG) levels in diabetic groups. The average FBG level in three diabetic groups on a high-fat diet injected with streptozotocin at 25, 35 and 45 mg/kg body weight were compared at week 0 (before treatment) and week 9 after treatment.
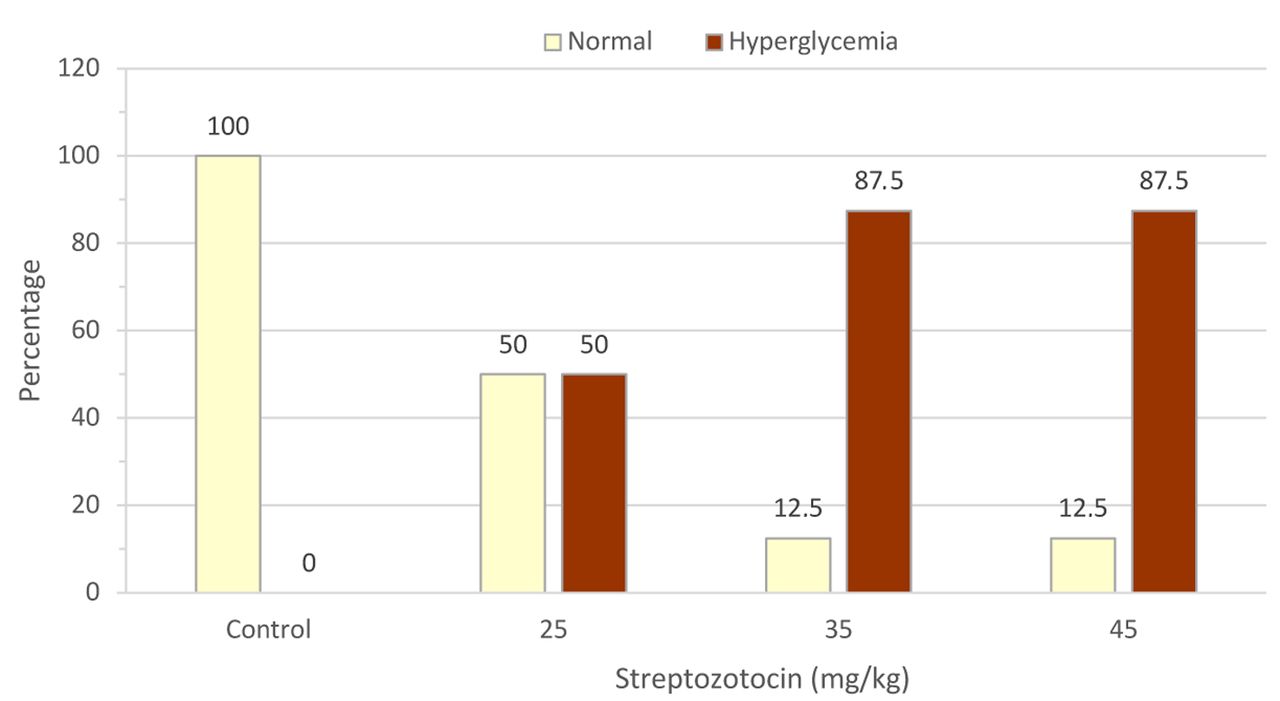
Proportion of hyperglycemic rats at week 9 after treatment with high-fat diet with and without streptozotocin. Glucose was measured in blood from the tail vein after 10 hours of fasting at night. The proportions of normal and hyperglycemic rats were determined in each group using a cut-off value of 140 mg/dl as published elsewhere (21).
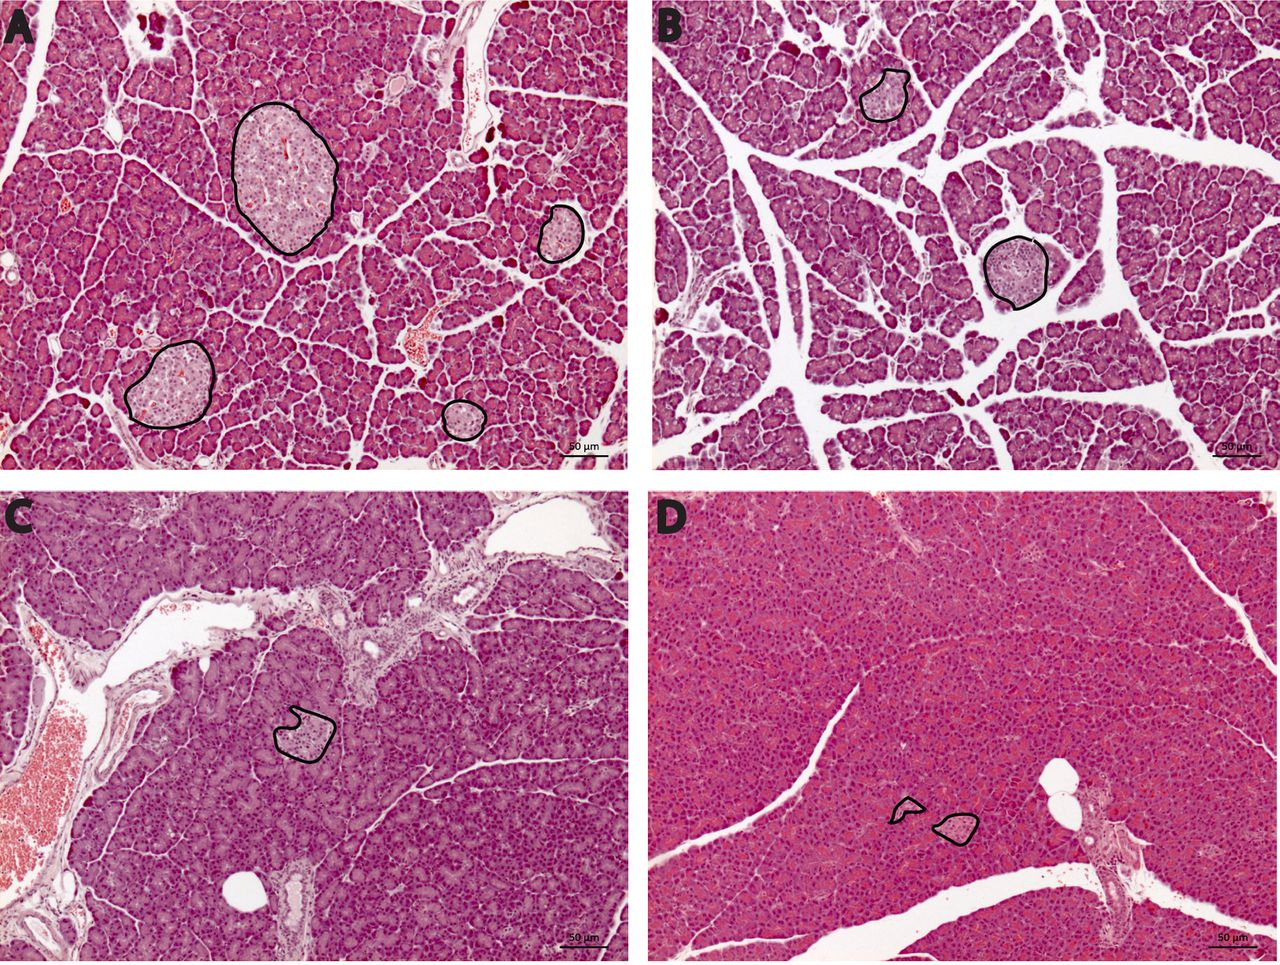
Dose-dependent reduction in area of Langerhans’ islets. As shown in Figure 3A, Langerhans’ islets were dispersed evenly in control pancreas. The pancreatic sections stained with hematoxylin and eosin showed pancreatic lobules composed of grape-like clusters of exocrine cells and endocrine islets of Langerhans containing β-cells. Within the control groups, the size of islets was relatively large and their shapes were oval or round with a clearly defined outline. Figure 3B-D show that Langerhans’ islets displayed irregular shape and size in the diabetic groups at all three doses of streptozotocin. The average area of Langerhans’ islets in control rats were subsequently compared to diabetic groups treated with three different doses of streptozotocin. The decline in the area of Langerhans’ islets suggested there was a dose-dependent reduction. Indeed, rats injected with streptozotocin at 45 mg/kg had the smallest area of Langerhans’ islet as compared to that of the control group (p=0.015; Table II).

Sections of rat pancreas were stained using hematoxylin-eosin and captured at 100× magnification. Langerhans’ islets are outlined in bold. Rats of the control group presented an elliptical shape with a clear boundary of Langerhans’ islets (A). Pancreatic section of diabetic group treated with (B) 25, (C) 35 and (D) 45 mg/kg body weight of streptozotocin showed Langerhans’ islets to be of smaller size, irregular shape and unclear boundaries.
Total area of Langerhans’ islets at week 9. The area of pancreatic Langerhans’ islets at 100× magnification was calculated and analyzed using ZEN microscope software. The differences between groups were analyzed using Mann-Whitney two-independent sample test.
Dose-dependent reduction in hepatic expression of IRS1. The response of hepatic cells to the presence of insulin was assessed by measuring levels of tyrosine-phosphorylated IRS1, as a downstream product of insulin-bound cellular receptors. Of note, one datum of IRS1 in the group treated with streptozotocin at 45 mg/kg was considered as an outlier and omitted from the analysis. Table III shows the levels of IRS1 in control rats and diabetic groups treated with streptozotocin decreased to 1,103.99±218.76 pg/ml, 901.77±105.53 pg/ml and 868.03±143.55 pg/ml, respectively. Furthermore, levels of IRS1 in diabetic groups injected with streptozotocin at 35 and 45 mg/kg were the lowest. This indicated significant reduction of IRS1 in these streptozotocin-treated rats as compared to the control group (p=0.021 and p=0.017, respectively).
Expression of phosphorylated insulin receptor 1 (IRS1) at week 9. Data from one rat in the group treated with 45 mg/kg streptozotocin were considered an outlier and omitted from the analysis. The differences between groups were analyzed using Mann-Whitney two-independent-sample test.
Relationship among IRS1, area of Langerhans’ islet and FBG in diabetic groups. Correlation of IRS1 with area of Langerhans’ islet and FBG, as well as between FBG and area of Langerhans’ islet were assessed in all HFD/streptozotocin-treated rats (n=23; one datum in the group treated with streptozotocin 45 mg/kg was consider an outlier and omitted from the analysis). The results indicated a non-parametric distribution, thus the potential relationships were analyzed using Spearman’s rho correlation test. As displayed in Table IV, the correlation analysis between IRS1 and area of Langerhans’s islet showed a weak correlation at r=0.259 (p=0.232). IRS1 was significantly inversely correlated with FBG (r=−0.520, p=0.011); inverse correlation indicated that a decrease in IRS1 was associated with an increase in FBG. The analysis of correlation between area of Langerhans’ islets and FBG also showed a significantly inverse relationship (r=−0.603, p=0.002), indicating reduction of the area of Langerhans’ islets was associated with an increase in FBG.
Correlation analyses between insulin receptor 1 (IRS1), fasting blood glucose (FBG) and area of Langerhans’ islets. Correlation analyses were analyzed with Spearman’s rho non-parametric correlation.
Discussion
In the present study, a total of 32 male Wistar rats were divided into four groups, consisting of one control group fed with basal diet and three diabetic groups. The three diabetic groups were fed with HFD for 4 weeks and injected with streptozotocin twice, at a weekly interval, with dose of 25, 35 and 45 mg/kg BW. This was performed to mimic the condition of T2DM as HFD/streptozotocin administration leads to hyperinsulinemia, insulin resistance and severely reduced functionality of β-cells (11, 12, 20). It has been suggested that streptozotocin injection generates reactive oxygen and nitrogen species, which are able to induce destruction of β-cells. Streptozotocin liberates toxic amounts of nitric oxide that participate in DNA damage and β-cells necrosis (26). The cytotoxic effect of streptozotocin on pancreatic β-cells is also due to depletion of intracellular ATP (27). Collectively, this results in a decrease in insulin biosynthesis and secretion (28, 29).
Firstly, our findings showed a dose-dependent increment in FBG level. Of note, streptozotocin at doses of 35 and 45 mg/kg significantly increased FBG at week 9 (p <0.01; Table I). The diabetic group treated with 45 mg/kg had a significantly higher FBG level as compared to the other groups (Table I). By using 140 mg/dl as a cut-off, both groups indeed had the same proportion of hyperglycemic rats (Figure 2). In general, the induction of T2DM performed by either a single injection of streptozotocin (19) or a combination of HFD and streptozotocin induces hyperglycemia and diabetes (21-23). It was initially reported that animal models of diabetes respond differently to streptozotocin injection using doses ranging from 25 to 100 mg/kg (21). A single dose of streptozotocin at 60 and 65 mg/kg established severe hyperglycemic condition associated with a depletion of pancreatic insulin content but these dosages were too toxic and can cause death to animals (20). Nonetheless, another study demonstrated that a combination of HFD and lower dose of streptozotocin as 35 mg/kg stimulated natural disease progression and metabolic characteristics similar to those of T2DM (17). Taken together, these might serve as a rationale to use a low dose of streptozotocin in subsequent studies of T2DM.
Secondly, our results showed a dose-dependent reduction in the area of Langerhans’ islets. Upon streptozotocin injections, the islets of Langerhans became smaller and irregular (Figure 3). Streptozotocin injection in diabetic rats reduces the number of β-cells, hence altering the shape and boundaries of Langerhans’ islets (16, 20, 30). Of note, a significant reduction in the area of Langerhans’ islets was observed in the diabetic group injected with the highest dose of streptozotocin, as compared to those in the control group (p<0.05; Table II). Streptozotocin is a chemical toxin that induces prompt and irreversible necrosis of pancreatic cells (26) and administration of streptozotocin induces a partial loss of Langerhans’ islet mass by necrosis (19). These facts would explain the dose-dependent reduction in the area of Langerhans’ islet observed in this study.
Thirdly, our study demonstrated a dose-dependent reduction in the level of tyrosine-phosphorylated IRS1 in the diabetic groups. The decrease of IRS1 in the diabetic groups injected with streptozotocin at 35 and 45 mg/kg was statistically significant as compared to the levels observed in the control group (p<0.05; Table III). The mechanism underlying insulin resistance involves pro-inflammatory cytokines, e.g. tumor necrosis factor alpha and interleukin 6, which inhibit insulin receptor signaling and glucose transport (31). Decreasing levels of phosphorylated IRS1 have been observed in insulin-resistant states and were correlated with the hyperglycemic condition (32). Another study by Kulkarni et al. indeed demonstrated insulin resistance in Irs1 knockout mice (33). Together with an elevation of blood glucose, insufficiency of IRS1 contributes to the pathogenesis of T2DM (8). Arguably, streptozotocin injection indirectly induces a reduction in phosphorylated IRS1.
Finally, by analyzing all data in the diabetic groups, we observed a moderate correlation between IRS1 and FBG, as well as between the area of Langerhans’ islets and FBG (Table IV). As expected, both relationships were observed to be inversely correlated. It suggests that HFD and streptozotocin administration reduce functionality of β-cells partly through destruction of Langerhans’ islets, resulting in reduction of released insulin. This in turn reduces the levels of phosphorylated IRS1, thus diminishing the efficiency of cellular uptake of blood glucose. Taken together, this resulted in increased levels of FBG in treated rats. We only found, however, a weak linear relationship between IRS1 and area of Langerhans’ islets (Table IV). This might be due to an indirect connection between destruction of β-cells and reduced level of phosphorylated IRS1, as there might be several intermediate steps involved, e.g. level of secreted insulin. Further studies will be required to elucidate the exact relationship between these parameters.
Acknowledgements
This study was funded by the Universitas Pelita Harapan’s Research Foundation and was supported by the Mochtar Riady Institute of Nanotechnology, Karawaci, Tangerang. We expressed our gratitude to Professor Dr. George Mathew, Professor Dr.Irawan Yusuf and Dr. Ivet Suriapranata who kindly contributed to fruitful discussion of this study. We also appreciated input of Dr.Veli Sungono and Dr. Nikolaski Lumbuun, who reviewed the statistical analyses.
Footnotes
Authors’ Contributions
All Authors contributed to this study and the preparation of the article.
This article is freely accessible online.
Conflicts of Interest
The Authors have no conflicts of interest to declare.
- Received October 8, 2020.
- Revision received October 26, 2020.
- Accepted October 28, 2020.
- Copyright© 2021, International Institute of Anticancer Research (Dr. George J. Delinasios), All rights reserved
References
In this issue


Jump to section
Related Articles
Cited By...
- No citing articles found.