


Abstract
Background/Aim: To elucidate the influence of calf circumference (CC) on sarcopenia in patients with chronic liver damages (CLDs, n=525, 255 men). Patients and Methods: Anthropometry parameters including arm circumference, arm muscle circumference, CC, arm muscle area, triceps skinfold thickness, waist circumference and body mass index were measured. Patients with both grip strength (GS) decline and skeletal muscle index (SMI) decline were diagnosed as sarcopenic. Results: Liver cirrhosis was identified in 103 cases (40.4%) in males and 87 cases (32.2%) in females. Sarcopenia was identified in 23 male patients (9.0%) and 38 female patients (14.1%). CC had the strong positive correlation with SMI both in male (r=0.79, p<0.0001) and female (r=0.83, p<0.0001). Among the above mentioned 7 anthropometry parameters, CC had the highest area under the receiver operating characteristics curve (AUC) for sarcopenia both in males (AUC=0.88) and females (AUC=0.86). Conclusion: CC can be helpful for predicting sarcopenia in CLDs.
In individuals with chronic liver damages (CLDs), metabolic or nutritional disorders including protein-energy-malnutrition or muscle abnormalities are frequently observed, which can be related to falls, poor quality of life or poor prognosis (1-11). When the liver function deteriorates, the ability to detoxify harmful substances such as ammonia can decrease. Branched-chain amino acids (BCAAs) are often used in muscles to detoxify harmful substances in patients with decreased liver function (1). Sarcopenia, which is defined by decreased muscle mass and strength or decreased physical activity, can occur because the consumption of BCAAs prevents the synthesis of proteins required for muscle mass increase (1). Sarcopenia is one of the most common consequences observed in patients with liver cirrhosis (LC) (1, 8, 12-18). Japanese CLD patients are gradually aging these days, which is also a crucial public health problem as aging is also closely linked to sarcopenia (19-21). To understand the association of sarcopenia with adverse outcomes, it is required to consider sarcopenia a systemic disorder (22-24). Clinical and research interest in sarcopenia is thus growing internationally.
Anthropometry is a convenient and non-invasive method to assess size and composition of the human body, and thus it is suitable for nutritional assessment in clinical settings (25-28). Arm circumference (AC), arm muscle circumference (AMC), calf circumference (CC) and arm muscle area (AMA), etc. are used to evaluate muscle mass, and body mass index (BMI), triceps skinfold thickness (TSF) and waist circumference (WC), etc. are used to evaluate fat mass (28). Of these parameters, measurement of CC is recommended in the revised Asian Working Group for Sarcopenia (AWGS) guidelines in order to facilitate earlier identification of sarcopenic individuals (29). The cutoff values of CC for sarcopenia in the revised AWGS guidelines are 34 cm in males and 33 cm in females (29). Kawakami, et al. have reported that CC was positively correlated with SMI and could serve as a surrogate marker of muscle mass for diagnosing sarcopenia (30). When the questionnaire strength, assistance with walking, rising from chair, climbing stairs and falls (SARC-F) is combined with CC, its sensitivity for identifying sarcopenia has been reported to be enhanced (31). Thus, clinical evidence regarding CC and sarcopenia have been accumulated. However, to the best of our knowledge, there have been few reports regarding the relationship between CC and sarcopenia in patients with CLDs (32, 33). The aim of the study was to elucidate the influence of CC on sarcopenia in patients with CLDs.

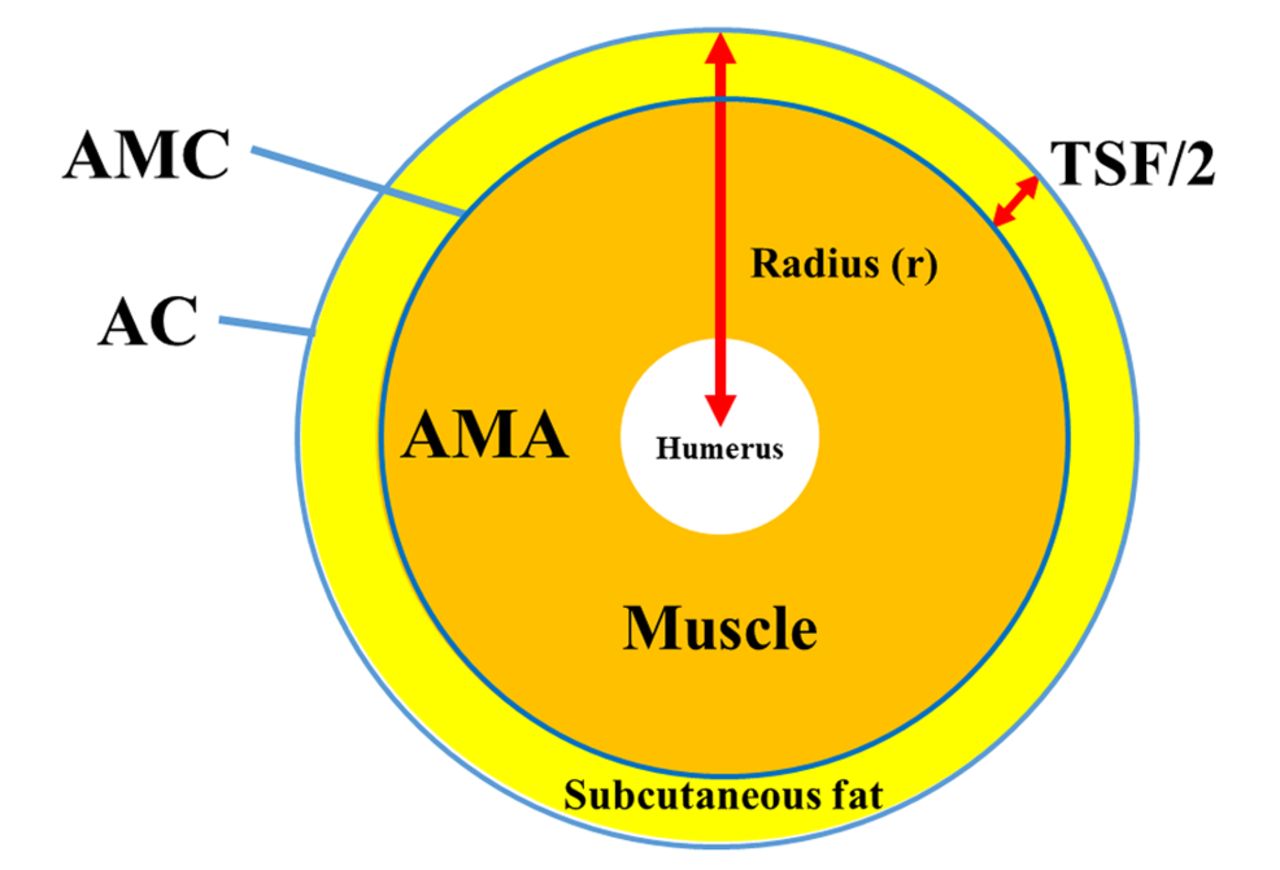
Diagram of AC, AMC, AMA and TSF. AC (cm)=2πr, AMC (cm)=2π(r-TSF (cm)/2)=AC-πTSF (cm), AMA=π(r-TSF (cm)/2)2=(AMC (cm))2/4π.
Patients and Methods
Patients. Five hundred and twenty-five CLD subjects evaluable for sarcopenia and anthropometry parameters consulted our hospital between April 2014 and January 2019, and they were participated in this study. LC was determined by liver biopsy, radiological findings (deformation of the liver surface, varices or splenomegaly, etc.), liver fibrosis markers and/or laboratory data (lower platelet count or prolonged prothrombin time) (34-37). Anthropometry parameters included AC (cm), TSF (cm), AMC (cm), CC (cm), WC (cm), AMA (cm2) and BMI (kg/m2).
Grip strength (GS) was measured according to the current Japanese Society of Hepatology (JSH) guidelines, and the definition of decreased GS was: GS <26 kg for males and <18 kg for females (19). Skeletal muscle index (SMI) was tested using bioimpedance analysis (BIA) as described previously (38). The definition of SMI decline was: SMI <7.0 kg/m2 in males and SMI <5.7 kg/m2 in females referring to the guidelines (19). Patients with both GS decline and SMI decline were diagnosed as sarcopenic (19). Because of the intrinsic limitations of BIA, which are hampered by ascites, patients with severe ascites were excluded from this study. We retrospectively examined the association of anthropometry parameters with sarcopenia in CLD patients. The institutional review board in our hospital approved this research protocol, and the declaration of Helsinki was strictly adhered to ensure the rights of the patients. An opt out method was used in order to obtain informed consent from the patients.
Patient demographics.
Anthropometry measurements. In our hospital, anthropometry measurements have been taken by an expert nutrition therapist after full explanation of the need and implications of anthropometry measurements to patients. Anthropometry measurements including AC, CC, TSF and WC were based on the Japanese anthropometric reference data (JARD) 2001. AMC was calculated using the following formula: AMC (cm)=AC-πTSF (cm). AMA was calculated using the following formula: AMA (cm2)=(AMC (cm))2/4π (Figure 1).
Comparison of baseline characteristics between male patients with and without sarcopenia.
Statistical analysis. The JMP 14 software (SAS Institute Inc., Cary, NC, USA) was used to statistically analyze the data. For the numerical variables, Mann-Whitney U-test or Student's t-test, or Pearson's correlation coefficient r was used to assess group characteristics when appropriate. For the categorical variables, Fisher's exact test or Pearson χ2 test was used to assess group characteristics when appropriate. Receiver operating characteristic curve (ROC) analysis and area under the ROC (AUC) results were presented along with the corresponding optimal cutoff point, sensitivity and specificity. Data were demonstrated as median value [interquartile range (IQR)]. The statistical significancelevel was set at p<0.05.
Results
Baseline features. Baseline features of the study cohort [n=255 males; median (IQR) age=64 (50,71) years] and n=270 females [median (IQR) age=66 (56, 72) years; p=0.0118] are presented in Table I. LC was identified at baseline in 103 male cases (40.4%) and 87 female cases (32.2%). Hepatitis C virus was identified in 50.6% males (129/255) and 55.6% (150/270) females. Albumin-bilirubin (ALBI) grade 1 was found in the majority of males (184/255, 72.2%) and females (215/270, 79.6%).
Comparison of baseline characteristics between female patients with and without sarcopenia.
In males, the median (IQR) GS was 34.4 (28.5, 40.8) kg, while in females, it was 21.05 (17.7, 24.3) kg. Forty men (15.7%) and 70 women (25.9%) had a GS decrease (GS: <26 kg for men and <18 kg for women). In males, the median (IQR) SMI was 7.5 (6.95, 8.02) kg/m2, while in females, it was 5.91 (5.49, 6.45) kg/m2. Sixty-four men (25.1%) and 98 women (36.3%) had SMI decrease (SMI: <7.0 kg/m2 for men and <5.7 kg/m2 for women). Sarcopenia was identified in 23 male patients (9.0%) and 38 female patients (14.1%).
In terms of anthropometric parameters, the median (IQR) AC (cm), TSF (cm), AMC (cm), AMA (cm2), WC (cm), CC (cm) and BMI (kg/m2) in males vs. females were 28 (27, 30) cm vs. 27.5 (25, 30) cm (p=0.0055), 1.2 (0.9, 1.5) cm vs. 1.95 (1.4, 2.6) cm (p<0.0001), 24.3 (22.8, 25.8) cm vs. 21.3 (20.2, 22.4) cm (p<0.0001), 47.2 (41.3, 52.8) cm2 vs. 36.0 (32.5, 39.9) cm2 (p<0.0001), 89.0 (83.0, 96.5) cm vs. 85.0 (79.4, 94.0) cm (p<0.0001), 37.1 (35.0, 39.4) cm vs. 34.6 (32.9, 37.5) cm (p<0.0001) and 23.3 (21.4, 25.9) kg/m2 vs. 22.05 (20.3, 25.2) kg/m2 (p=0.0046), respectively.

Distribution of CC in males (A) and females (B). In males, there were 66 patients in group A [CC: ≤35.0 cm (first quantile)], 64 in group B [CC: >35.0 cm, ≤37.1 cm (median)], 62 in group C [CC: >37.1 cm, ≤39.4 (third quantile)] and 63 in group D (CC: >39.4 cm). In females, there were 68 patients in group A [CC: ≤32.9 cm (first quantile)], 70 in group B [CC: >32.9 cm, ≤34.6 cm (median)], 67 in group C [CC: >34.6 cm, ≤37.5 (third quantile)] and 65 in group D (CC: >37.5 cm).
In males, the differences of baseline characteristics between sarcopenic patients and non-sarcopenic patients reached significance in terms of age (p=0.0061), BMI (p<0.0001), serum albumin (p=0.0208), GS (p<0.0001), SMI (p<0.0001), AC (p<0.0001), AMC (p<0.0001), AMA (p<0.0001), WC (p=0.0393) and CC (p<0.0001) (Table II). In females, the differences of baseline characteristics between sarcopenic patients and non-sarcopenic patients reached significance in terms of age (p<0.0001), BMI (p<0.0001), serum albumin (p=0.0292), GS (p<0.0001), SMI (p<0.0001), AC (p<0.0001), TSF (p=0.0005), AMC (p=0.0002), AMA (p=0.0056), WC (p=0.0055) and CC (p<0.0001) (Table III).
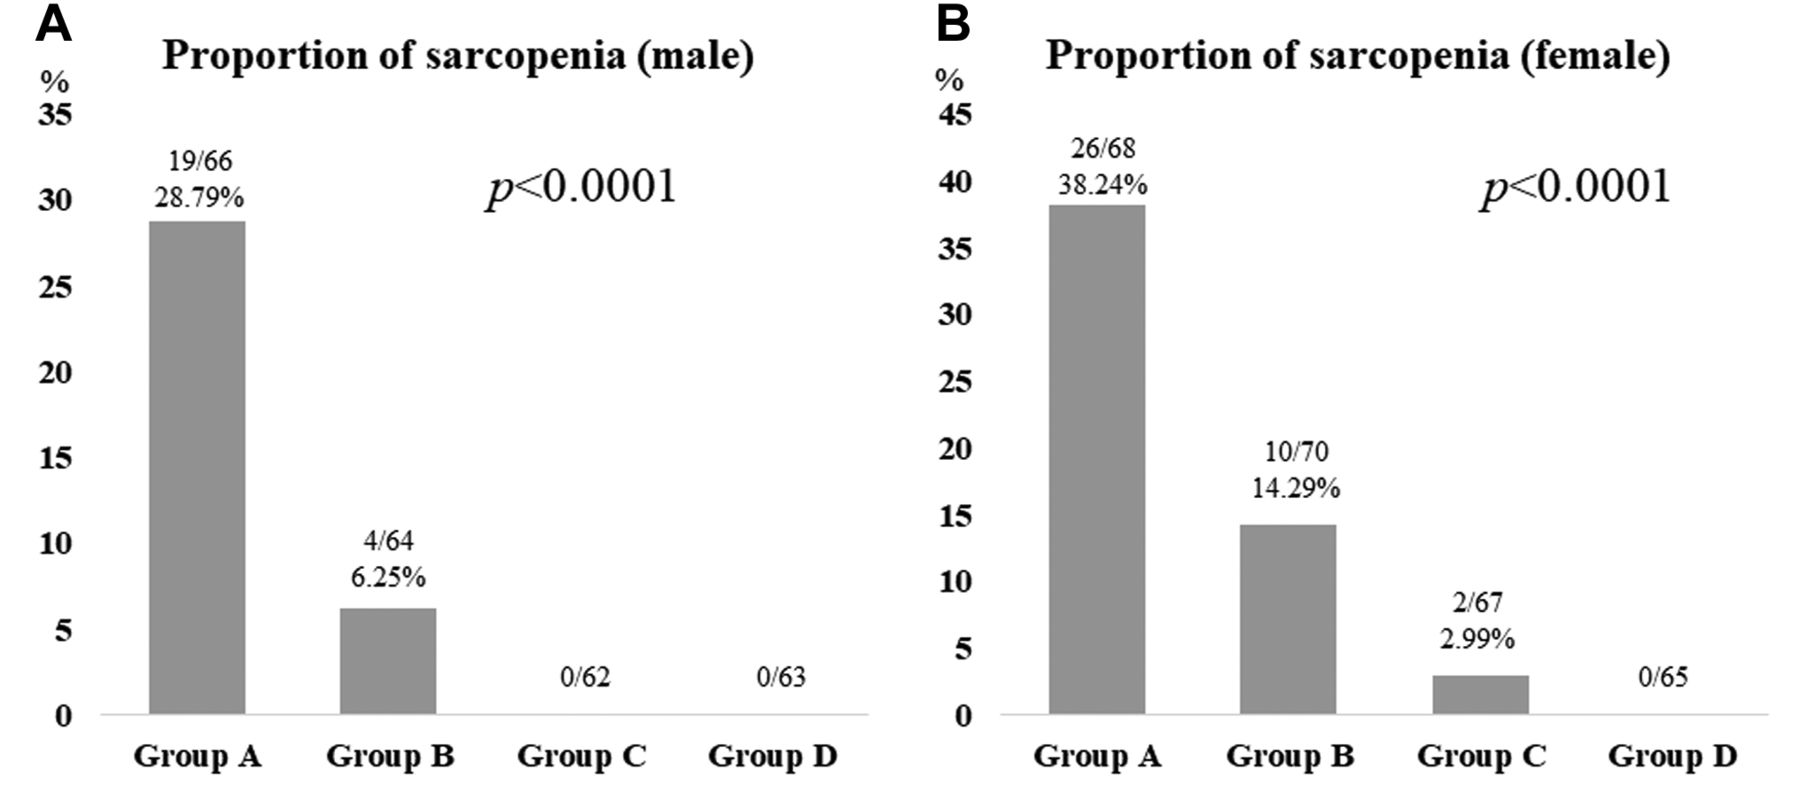
Distributions of CC (cm) in males and females. Distributions of CC in males and females are shown in Figure 2A and B. In males, there were 66 patients in group A [CC: ≤35.0 cm (first quantile)], 64 in group B [CC: >35.0 cm, ≤37.1 cm (median)], 62 in group C [CC: >37.1 cm, ≤39.4 (third quantile)] and 63 in group D (CC: >39.4 cm). In females, there were 68 patients in group A [CC: ≤32.9 cm (first quantile)], 70 in group B [CC: >32.9 cm, ≤34.6 cm (median)], 67 in group C [CC: >34.6 cm, ≤37.5 (third quantile)] and 65 in group D (CC: >37.5 cm). In males, the proportion of sarcopenia was well stratified among groups of A (19/66, 28.79%), B (4/64, 6.25%), C (0/62) and D (0/63) (overall p<0.0001) (Figure 3A). In females, the proportion of sarcopenia was also well stratified among groups of A (26/68, 38.24%), B (10/70, 14.29%), C (2/67, 2.99%) and D (0/65) (overall p<0.0001) (Figure 3B).

The proportion of sarcopenia among groups of A, B, C and D in males (A) and females (B).
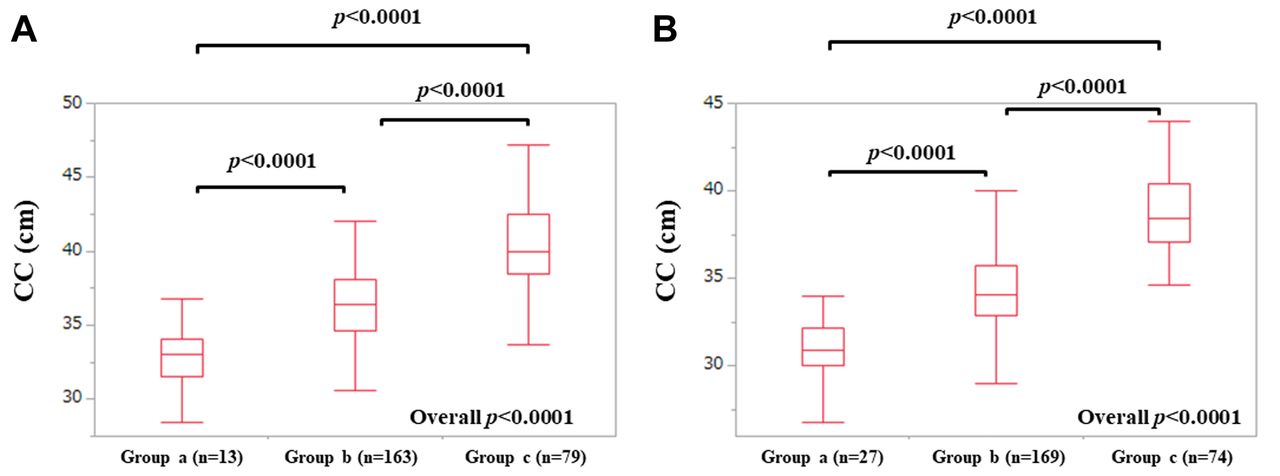
CC according to BMI in males (A) and females (B). Our study cohort was classified into 3 groups according to BMI; patients with BMI <18.5 kg/m2 (group a); those with BMI 18.5 to 25.0 kg/m2 (group b); those with BMI ≥25.0 kg/m2 (group c).
CC according to BMI in males and females. Our study cohort was classified into 3 groups according to BMI; patients with BMI <18.5 kg/m2 (group a); those with BMI 18.5 to 25.0 kg/m2 (group b); those with BMI ≥25.0 kg/m2 (group c) (39). In males, the median (IQR) CC in group a (n=13), b (n=163) and c (n=79) were: 33.0 (31.5, 34.1) cm, 36.4 (34.6, 38.1) cm and 40.0 (38.5, 42.5) cm (p values: a vs. b. p<0.0001; b vs. c, p<0.0001; c vs. a, p<0.0001; overall p<0.0001), respectively. In females, the median (IQR) CC in group a (n=27), b (n=169) and c (n=74) were: 30.9 (30.0, 32.2) cm, 34.1 (32.85, 35.75) cm and 38.45 (37.1, 40.425) cm (p values: a vs. b. p<0.0001; b vs. c, p<0.0001; c vs. a, p<0.0001; overall p<0.0001), respectively (Figure 4A and B).
Correlation between 7 anthropometric parameters and SMI in males. The correlation coefficients between 7 anthropometric parameters and SMI in males were: r=0.72 in AC (p<0.0001), r=0.36 in TSF (p<0.0001), r=0.68 in AMC (p<0.0001), r=0.79 in CC (p<0.0001), r=0.60 in WC (p<0.0001), r=0.68 in AMA (p<0.0001) and r=0.77 in BMI (p<0.0001) (Table IV).
Correlation between anthropometry parameters and SMI and GS in males.
Correlation between 7 anthropometric parameters and GS in males. The correlation coefficients between 7 anthropometric parameters and GS in males were: r=0.44 in AC (p<0.0001), r=0.063 in TSF (p=0.3168), r=0.55 in AMC (p<0.0001), r=0.42 in CC (p<0.0001), r=0.028 in WC (p=0.6587), r=0.54 in AMA (p<0.0001) and r=0.21 in BMI (p=0.0006) (Table IV).
Correlation between 7 anthropometric parameters and SMI in females. The correlation coefficients between 7 anthropometric parameters and SMI in females were: r=0.62 in AC (p<0.0001), r=0.48 in TSF (p<0.0001), r=0.52 in AMC (p<0.0001), r=0.83 in CC (p<0.0001), r=0.61 in WC (p<0.0001), r=0.39 in AMA (p<0.0001) and r=0.75 in BMI (p<0.0001) (Table V).
Correlation between 7 anthropometric parameters and GS in females. The correlation coefficients between 7 anthropometric parameters and GS in females were: r=0.15 in AC (p=0.0154), r=0.11 in TSF (p=0.0779), r=0.14 in AMC (p=0.0214), r=0.34 in CC (p<0.0001), r=0.058 in WC (p=0.3407), r=0.085 in AMA (p=0.1620) and r=0.12 in BMI (p=0.0488) (Table V).
ROC analysis of 7 anthropometric parameters for the presence of sarcopenia in males. Results of ROC analysis of 7 anthropometric parameters for the presence of sarcopenia in males are shown in Table VI (corresponding AUC, optimal cutoff point, sensitivity and specificity). CC had the highest AUC (0.88) for sarcopenia, followed by AMC (AUC=0.84) and AMA (AUC=0.84).
ROC analysis of 7 anthropometric parameters for the presence of sarcopenia in females. Results of ROC analysis of 7 anthropometric parameters for the presence of sarcopenia in females were shown in Table VII (corresponding AUC, optimal cutoff point, sensitivity and specificity). CC had the highest AUC (0.86) for sarcopenia, followed by AMC (AUC=0.75) and AMA (AUC=0.75).
Correlation between anthropometry parameters and SMI and GS in females.
Discussion
As mentioned above, anthropometry easily and non-invasively provides an assessment of size and composition of the human body (25). Especially in facilities without BIA or computed tomography, anthropometry is of great significance. The revised AWGS guidelines propose separate algorithms for community vs. hospital settings (29). In community settings, assessment of muscle mass is not required for the diagnosis of sarcopenia in the revised AWGS guidelines. In both community and hospital settings, first screening for possible sarcopenia using CC or questionnaire is recommended, but in the Japanese Society of hepatology criteria for sarcopenia in liver disease, such recommendation is not found (19, 29). To elucidate the relationship between CC and sarcopenia in CLD patients is important. To the best of our knowledge, this is the largest study elucidating the relationship between CC and sarcopenia in patients with CLDs.
In our study, the proportion of sarcopenia was well stratified by CC regardless of gender and CC had the highest AUC for sarcopenia (0.88 in males and 0.86 in females) among the 7 anthropometry parameters. Hiraoka, et al. reported that the AUC values for muscle mass decrease of finger-circle test were 0.654 in males and 0.698 in females (33). Considering these, our results denoted that CC can be a useful anthropometry measurement for sarcopenia in CLDs. In addition, measurement of CC is easily available in the clinical settings and it should thus be highly recommended although the current JSH criteria for sarcopenia in CLDs do not. The cutoff values of CC for sarcopenia in the revised AWGS guidelines are 34 cm in males and 33 cm in females. However, our ROC analysis indicated that the optimal cutoff values of CC were 35.4 cm in males and 33.8 cm in females, which are higher than AWGS data (29). This is probably due to the difference in the target population between the AWGS cohort (elderly patients only) and our cohort [median (IQR) age that was 64 (50, 71) years]. Age restriction for assessing sarcopenia is not included in the current JSH criteria (19).
ROC analysis of anthropometrical parameters for the presence of sarcopenia in males.
The close correlation between CC and BMI also gave us some insights for sarcopenia in CLDs. CC is used to mainly evaluate muscle mass (correlation coefficient of our data between CC and SMI was: r=0.79 in males and r=0.83 in females) and BMI is used to mainly evaluate fat mass. BMI can be critical for assessing sarcopenia in CLDs, while caution should be exercised for the presence of sarcopenic obese patients (40). In this study, of the 175 male patients with visceral obesity (WC ≥85 cm), 10 (5.71%) had sarcopenia, while of the 91 female patients with visceral obesity (WC ≥90 cm), 5 (5.49%) had sarcopenia. However, CC significantly correlated with GS both in males and females although the correlation coefficients (r=0.42 in males and r=0.34 in females) were not so impressive compared with SMI. Muscle mass appears to reflect muscle strength to some extent.
A recent meta-analysis has reported that although the screening specificity performance of SARC-F for sarcopenia was high, its sensitivity was low (pooled results of sensitivity and specificity, 0.21 and 0.90) (41). While in our study, sensitivity and specificity of CC were 0.913 and 0.776, respectively. Hiraoka et al. reported that SARC-F score in combination with muscle strength decline and CC can be an easy and simple method for assessing muscle volume loss in CLD patients, which may be linked to our results (32). The revised AWGS guidelines recommend SARC-Calf as a screening tool for sarcopenia (29). Taking the meta-analysis of SARC-F and our current data (i.e., high sensitivity of CC for sarcopenia) into consideration, SARC-Calf should be recommended as a screening tool for sarcopenia in CLDs.
According to the Japanese anthropometric reference data (JARD) 2001, the median BMI, AC, TSF, AMC, CC, and AMC in Japanese adult males are 22.5 kg/m2, 27.2 cm, 10.0 mm, 23.7 cm, 35.0 cm, 44.8 cm2, respectively, while those in Japanese adult females are 20.7 kg/m2, 25.2 cm, 15.0 mm, 20.2 cm, 32.7 cm, 32.4 cm2, respectively. The median BMI, AC, TSF, AMC, CC, AMC in our male patients were 23.3 kg/m2, 28.0 cm, 12.0 mm, 24.3 cm, 37.1 cm, 47.2 cm2, indicating that all values of these parameters were higher compared with JARD 2001 male data. The median BMI, AC, TSF, AMC, CC, AMC in our female patients were 22.1 kg/m2, 27.5 cm, 19.5 mm, 21.3 cm, 34.6 cm, 36.0 cm2, indicating that all values of these parameters were also higher compared with JARD 2001 female data. The physique of Japanese CLD patients seems to be getting better than before. These data may reflect improvements in therapies for underlying liver diseases or the changes in disease structure (42, 43).
ROC analysis of anthropometrical parameters for the presence of sarcopenia in females.
Several limitations associated with the study should be mentioned. Firstly, this was a retrospective cross-sectional observational study which only enrolled patients from a single hospital. Secondly, our data included population data on CLDs in Japan, and further studies on other ethnic backgrounds are necessary to confirm and expand its adaptation to these other backgrounds. Thirdly, patients with large ascites who may have sarcopenia were excluded due to the limits of BIA, allowing a possibility for bias. Finally, owing to the cross-sectional nature of our study, the causal relationship between CC decrease and sarcopenia is unclear. Our data should be interpreted with caution. The study results nevertheless denoted that sarcopenia and CC in CLDs have a close relationship. In conclusion, CC can be a helpful screening tool for predicting sarcopenia in CLDs.
Acknowledgements
The Authors would like to thank Yasuko Higuchi in our hospital for the anthropometry measurement. This work was partly granted by Hyogo Innovative Challenge, Hyogo college of medicine, Japan.
Footnotes
Authors' Contributions
Data curation, Hiroki Nishikawa, Kazunori Yoh, Hirayuki Enomoto, Yoshinori Iwata, Yoshiyuki Sakai, Kyohei Kishino, Yoshihiro Shimono, Naoto Ikeda, Tomoyuki Takashima, Nobuhiro Aizawa, Ryo Takata, Kunihiro Hasegawa, Takashi Koriyama, Yukihisa Yuri and Takashi Nishimura; Formal analysis, Hiroki Nishikawa; Supervision, Hirayuki Enomoto, Shuhei Nishiguchi and Hiroko Iijima; Writing – original draft, Hiroki Nishikawa and Kazunori Yoh; Writing – review & editing, Hiroki Nishikawa.
This article is freely accessible online.
Conflicts of Interest
The Authors have no conflicts of interest to declare regarding this study.
- Received May 28, 2020.
- Revision received June 17, 2020.
- Accepted June 18, 2020.
- Copyright© 2020, International Institute of Anticancer Research (Dr. George J. Delinasios), All rights reserved


