


Abstract
Background/Aim: A bioimpedance analysis (BIA) can indicate an overhydrated state as the extracellular water/total body water (ECW/TBW) value. This study aimed to assess the clinical significance of this value in patients with chronic liver diseases (CLDs). Patients and Methods: A total of 552 CLD patients who received a liver biopsy and underwent anthropometric assessment and BIA-based body composition analysis were enrolled. The association of the ECW/TBW value with the liver fibrosis and nutritional status was assessed. The relationship between the ECW/TBW value and the prognosis of cirrhotic patients (N=209) was also evaluated. Results: The ECW/TBW value increased as liver fibrosis progressed and was also related to decreased muscle mass/sarcopenia. The presence of overhydration was associated with a poor prognosis of cirrhotic patients. Conclusion: An increased ECW/TBW value was associated with progressive liver fibrosis and malnutrition and related to the prognosis of cirrhotic patients.
A bioimpedance analysis (BIA) can provide various data regarding the body's compositions (1, 2). Recently, the clinical significance of sarcopenia, which develops in relation to aging or certain diseases (3-5), has been increasing, and several studies using BIA-based muscle mass data in patients with chronic liver diseases (CLDs) have been reported (6-8). However, the BIA method can also indicate an overhydrated state as the ratio of extracellular water (ECW) to total body water (TBW). Given the importance of water balance, the clinical utility of the ECW/TBW value has mainly been studied in patients with renal diseases (9-11).
Patients with CLDs tend to retain water, as do those with chronic renal diseases; however, few studies have assessed the clinical significance of the ECW/TBW value in patients with CLDs. We recently investigated patients with hepatitis virus-related CLDs and showed that the ECW/TBW value increased in line with the progression of the diseases (12).
In the current study, we investigated the association of the ECW/TBW value with the degree of the liver fibrosis and nutritional status in CLD patients, including non-viral CLDs. In addition, we investigated whether or not the ECW/TBW value was related to the prognosis of patients with liver cirrhosis (LC).
Patients and Methods
Patients. We studied a total of 552 patients who received a liver biopsy and underwent an anthropometric assessment and BIA-based body composition analysis on the same days from February 2006 to June 2012. The body composition of the patients was assessed using a BIA device (InBody720®; InBody Japan, Tokyo, Japan). Regarding the anthropometric measurement, a designated dietitian obtained all of these data as described previously (13).
The evaluation of liver fibrosis with a liver biopsy and laboratory data. Live biopsy samples were obtained with standard ultrasound-guided techniques, and the liver fibrosis stage was determined on a scale of F0-F4 according to the METAVIR system (F0: no fibrosis, F1: portal fibrosis without sept, F2: portal fibrosis with rare septa, F3: numerous septa without cirrhosis and F4: cirrhosis) (14). We obtained blood samples on the same day as the liver biopsies, and evaluated the values of well-established liver fibrosis markers, with the AST-to-platelet count ratio (APRI) (15) and the FIB-4 index (16) determined using the following formulae:

Characteristics of enrolled patients (N=552).
Definition of an overhydrated state and the presence of sarcopenia determined with the body composition analysis. Patients with CLDs, particularly LC patients, tend to develop malnutrition and water retention (17), so we analyzed the ECW/TBW value as an index of water retention/edema. The degree of water retention was classified into three categories as follows: ECW/TBW<0.39 (not overhydrated), 0.39≤ECW/TBW<0.40 (mildly overhydrated), and ECW/TBW≥0.40 (moderately to severely overhydrated) (12). Using the BIA device, we also assessed the presence of sarcopenia by calculating the appendicular skeletal muscle mass index (SMI) as follows:

Sarcopenia was diagnosed using the cut-off values (7.0 kg/m2 for men and 5.7 kg/m2 for women) mentioned in the guideline of the Japan Society of Hepatology (18).
The evaluation of the nutritional status based on anthropometric measurements. The triceps skinfold thickness (TSF) represents the fat mass, while the arm muscle circumference (AMC) and arm muscle area (AMA) can be used as indices of the skeletal muscle mass. As described in our previous report (13), a designated dietitian measured the TSF and arm circumference (AC), and the muscle-mass-related values (AMC and AMA) were calculated with the following formulae:

The values of %TSF, %AMC and %AMA were determined with reference to the standard values of these variables in Japanese people (19).

The ECW/TBW value in relation to the fibrosis stages in patients with chronic liver diseases. The ECW/TBW ratio increased as the fibrosis stage progressed. There were significant differences between the F0-1 vs. F4, F2 vs. F4, F3 vs. F4, and F2 vs. F3 groups.
Statistical analyses. Regarding the continuous variables, statistical differences among the groups were analyzed using the Mann-Whitney U-test, Kruskal-Wallis test or Steel-Dwass test, as appropriate. Regarding categorical variables, statistical differences between two groups were determined by the chi-squared test. The relationships between the ECW/TBW value and various clinical variables were evaluated using Spearman's correlation coefficient. The survival curves were generated with the Kaplan-Meier method, and the prognoses were analyzed with the log-rank test. A p-value<0.05 was considered to be statistically significant. The study was conducted with the approval of the ethics committee of the institutional review board.
Results
Clinical characteristics of the patients with CLDs. We enrolled a total of 552 patients with CLDs who received a liver biopsy, body composition analysis and anthropometric assessments on the same day. The basic clinical characteristics of the enrolled patients are shown in Table I. The cohort included 261 male patients (47.3%), and the median age was 62 years old. The numbers of patients with hepatitis virus-related CLDs versus non-viral CLDs were 383 (69.4%) and 169 (30.6%), respectively.
Association of the ECW/TBW ratio with the histological findings and clinical variables related to liver fibrosis. We first evaluated the relationship between the ECW/TBW value and the histological findings of the patients with CLDs. As shown in Figure 1, the ECW/TBW value increased as the fibrosis stage progressed, and a significant difference was observed between the F2 and F3 stages, suggesting that the water retention tendency manifested in the non-cirrhotic stages.

The correlation of the ECW/TBW value with the variables in relation to the liver function tests. The ECW/TBW value was significantly correlated with the variables related to the progression of CLD. The panels (A)-(D) showed the associations of the ECW/TBW with the following variables. (A) Albumin value, (B) Prothrombin time (%), (C) FIB-4 index, (D) APRI (AST-to-platelet ratio index).
We also assessed whether or not the ECW/TBW value was associated with various parameters related to the progression of liver fibrosis (Figure 2). The ECW/TBW values were negatively associated with the albumin value (p<0.0001) and PT percentage (p<0.0001) and positively associated with the major fibrosis markers FIB-4 index (p<0.0001) and APRI (p<0.0001).
Association of the ECW/TBW values with the nutrition-related variables. The serum albumin value was inversely associated with the ECW/TBW value (Figure 2A); however, the serum albumin value can be used not only as a liver function marker but also as a nutritional marker. We therefore analyzed the association between the ECW/TBW value and the nutrition-related anthropometric variables. As shown in Figure 3A, the %TSF value, which is an indicator of the fat mass, did not differ significantly. In contrast, the indices of skeletal muscle mass (%AMC and %AMA) differed with statistical significance (Figure 3B and C).
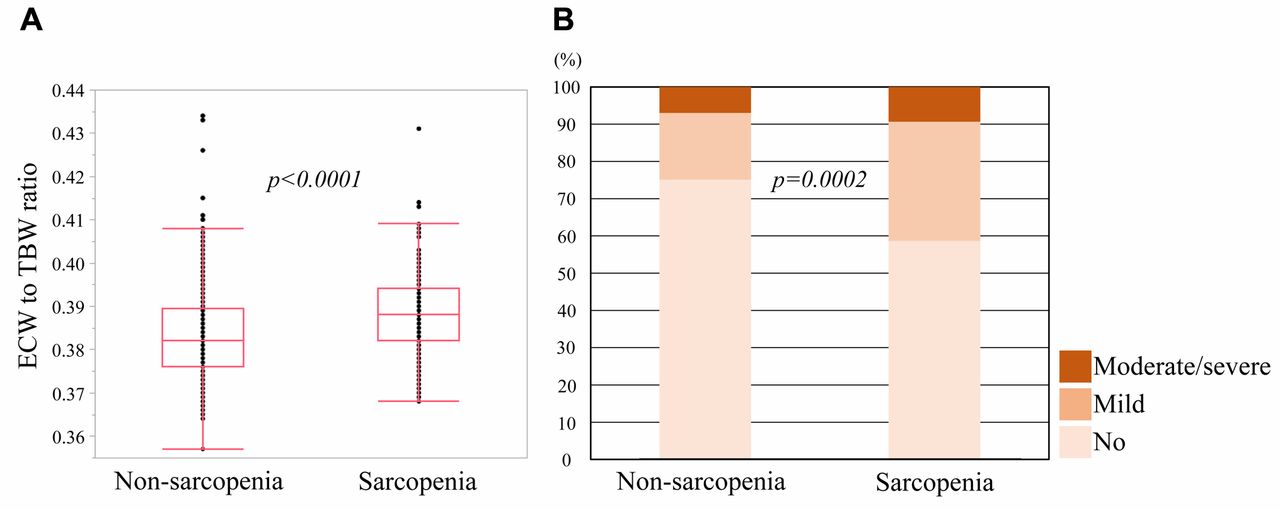
Association of the ECW/TBW values with the presence of sarcopenia. Based on the suggested significant association of the ECW/TBW value with the skeletal muscle mass, we further assessed whether or not the ECW/TBW values differed between the patients with and without sarcopenia. The ECW/TBW values were significantly higher in the sarcopenia group than in the non-sarcopenia group (p<0.0001) (Figure 4A). Furthermore, the ratio of overhydrated patients was significantly higher in the sarcopenia group than in the non-sarcopenia group (p=0.0002) (Figure 4B).
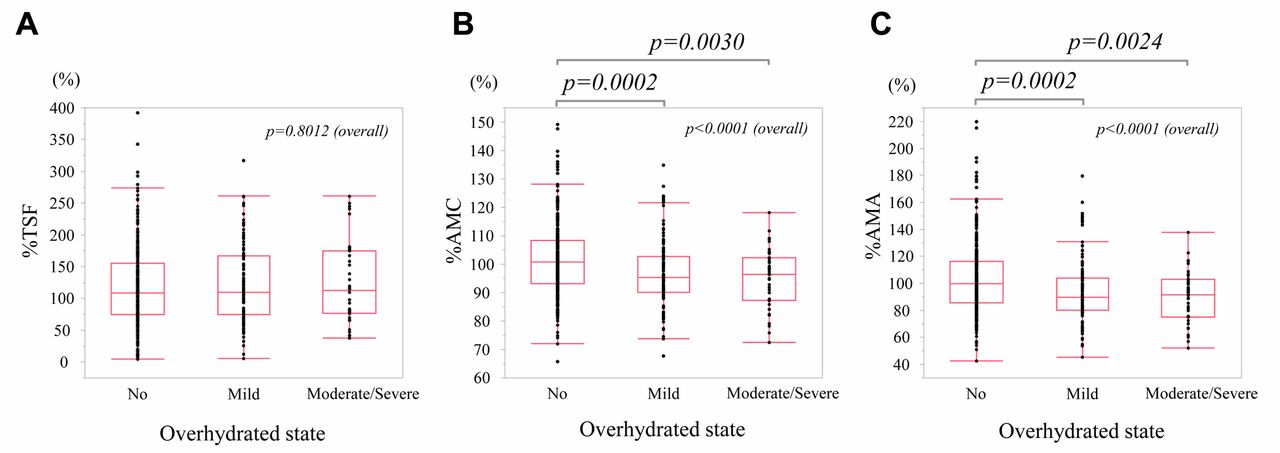
Association of the ECW/TBW value with the nutrition-related anthropometric variables. Since the ECW/TBW value was inversely associated with the serum albumin value, which is a nutrition marker (see Figure 2), we assessed the nutrition-related anthropometric data. The degree of water retention was classified into three categories as follows: ECW/TBW<0.39 (not overhydrated), 0.39≤ECW/TBW<0.40 (mildly overhydrated), and ECW/TBW≥0.40 (moderately to severely overhydrated). (A) The %TSF value, which is an indicator of the fat mass, did not differ significantly among the groups. (B and C) The indices of skeletal muscle mass (%AMC and %AMA) differed with statistical significance among the groups. ECW: Extracellular water; TBW: total body water; TSF: triceps skinfold thickness; AC: arm circumference; AMC: arm muscle circumference; AMA: arm muscle area.

Association of the ECW/TBW value with the presence of sarcopenia. (A) The ECW/TBW values were significantly higher in the sarcopenia group than in the non-sarcopenia group. (B) The ratio of the overhydrated patients was significantly higher in the sarcopenia group than in the non-sarcopenia group.
Association of the ECW/TBW value with the prognoses of cirrhotic patients. In order to assess the clinical relevance of overhydration, we finally assessed whether or not the ECW/TBW value was associated with the prognosis of the LC patients. The mean observational period was 1508 days, and the basic characteristics of the LC patients (N=209) are shown in Table II. The cohort included 114 male patients (54.5%), and the median age was 67 years old. When the patients were classified into three groups according to the overhydrated state, the prognoses differed significantly based on the overhydrated state (p=0.0092), suggesting a significant relationship between overhydration and a poor prognosis in cirrhotic patients (Figure 5A). When we classified the patients into two groups according to the presence/absence of overhydration, the patients with overhydration showed a significantly worse prognosis than those without overhydration (p=0.0331) (Figure 5B).

Association of the ECW/TBW ratio with the prognoses of cirrhotic patients. (A) The degree of water retention was classified into three categories as follows: ECW/TBW<0.39 (not overhydrated), 0.39≤ECW/TBW<0.40 (mildly overhydrated), and ECW/TBW≥0.40 (moderately to severely overhydrated). The prognoses were significantly different among the groups. (B) When patients were classified according to the presence/absence of overhydration, patients with overhydration had a worse prognosis than those without overhydration.
Discussion
The BIA method provides the various kinds of body composition data, and its clinical application has been expanding (1, 2). Recently, the Japan Society of Hepatology proposed the diagnostic criteria of sarcopenia based on the specific clinical features of patients with CLDs (18). In the guideline, the BIA method was listed as one way to evaluate the skeletal muscle mass. In addition to sarcopenia, CLD patients have a range of clinical problems; we focused on the overhydrated state in CLD patients in the present study. We showed that an increased ECW/TBW value was associated with various clinical features, including advanced liver fibrosis and a deteriorated nutritional status, particularly decreased skeletal muscle mass/sarcopenia. In addition, we showed that an increased ECW/TBW value was associated with a poor prognosis among cirrhotic patients.
In the present study, the ECW/TBW value was shown to increase in line with the progression of liver fibrosis (Figures 1 and 2). One important point was that the ECW/TBW value differed significantly between patients with F2 stage disease and those with F3 stage disease. This result was consistent with the findings of our previous study evaluating hepatitis virus-related CLDs (12) and suggested that patients with CLDs began retaining water before progression to the F4/cirrhotic stage. The present study further showed that the ECW/TBW value reflected the degree of liver fibrosis. However, as described in our previous study (12), its diagnostic performance as a sole liver fibrosis marker was fair to moderate and needs to be evaluated in greater detail.
Characteristics of patients with liver cirrhosis (N=209).
We also investigated the association between the ECW/TBW values and the nutritional parameters. Nutritional problems are often observed in patients with CLDs, particularly cirrhotic patients, and are considered to be associated with an unfavorable prognosis (20, 21). We found that the ECW/TBW value was inversely associated with the level of albumin, one of the most common serum nutritional markers (Figure 2A). This result seems to be reasonable, as a low albumin value reduces the serum colloid osmotic pressure. However, we also found that an increased ECW/TBW value was associated with a disturbed nutritional status, particularly decreased skeletal muscle mass/sarcopenia (Figures 3 and 4), suggesting that overhydration was associated with the presence of a disturbed nutrition status.
In the present study, we showed that an overhydrated status was related to the prognosis of patients with LC. Although previous studies have shown that the ECW/TBW value was useful as a prognostic factor in non-hepatic diseases (22, 23) to our knowledge, the current study is the first to show a relationship between the ECW/TBW value and the prognosis of cirrhotic patients (Figure 5). A high ECW/TBW value therefore appeared to reflect both progressed liver fibrosis and a disturbed nutritional status and was related to a poor prognosis of LC patients.
Several limitations associated with the present study warrant mention. First, regarding its association with liver fibrosis in CLD patients, as described above, the impact of the ECW/TBW value as a sole liver fibrosis marker has not been confirmed, and further assessments will be required. Second, the present study was conducted at a single center, and the anthropometric data for the nutritional assessment were obtained by a designated dietarian. Third, this study was a retrospective one, and the prognosis of the patients should ideally be investigated in a prospective cohort.
In conclusion, our findings suggested that an increased ECW/TBW value was associated with the degree of liver fibrosis and malnutrition as well as the prognosis of cirrhotic patients.
Acknowledgements
The Authors would like to thank Inui S, Higuchi Y, Fujii S, Matsushita Y, Kanazawa N, Kido H and Minemoto K (Hyogo College of Medicine) for their technical and secretarial assistance.
Footnotes
Authors' Contributions
KK: data collection and analysis; HE: study design, data analysis and the manuscript writing. YS: data collection and analysis. EM, NH, TN, YI and HI: data collection; SN: data collection and supervising the study. All of the Authors read and edited the manuscript and approved the final version of the manuscript.
This article is freely accessible online.
Conflicts of Interest
The Authors declare no conflicts of interest related to this study.
Funding
This work was partly granted by Hyogo Innovative Challenge, Hyogo College of Medicine, Japan.
- Received January 21, 2020.
- Revision received January 28, 2020.
- Accepted February 3, 2020.
- Copyright© 2020, International Institute of Anticancer Research (Dr. George J. Delinasios), All rights reserved
References
In this issue


Jump to section
Related Articles
Cited By...
- Modification of the ALBI-PLT Score for the Prediction of High-risk Varices
- Factors Associated With Longitudinal QOL Change in Patients With Chronic Liver Diseases
- Sarcopenia and Frailty in Chronic Liver Damage: Common and Different Points
- The Association Between Extracellular Water-to-Total Body Water Ratio and Therapeutic Durability for Advanced Lung Cancer