


Abstract
Background/Aim: This study evaluated whether the lymphocyte tolerance factor (LTF) was an indicator of radiation tolerance of lymphocytes (RTL) using the relative lymphocyte count (RLC), and considering clinical outcomes. Patients and Methods: A total of 92 cervical cancer patients treated with concurrent chemoradiotherapy (CCRT) were analysed. RLC0 was pre-treatment RLC, and RLC1, and RLC2 were at the first and second week of CCRT, respectively. LTF1 was RLC1:RLC2. LTF2 was the dimension of the convex or concave shape comprising the three RLC vertexes. Patients were divided into three groups: good RTL group, low LTF1; moderate RTL group, high LTF1 and low LTF2; and poor RTL group, high LTF1 and high LTF2. Results: Patients with good tumour response to radiotherapy were mostly included in the good RTL group than in the other groups. The poor RTL group had lower 3-year progression-free survival (57.1% vs. 83.8% and 82%, p=0.01) and 5-year disease-specific survival (71.8% vs. 90.4% and 94.9%, p=0.062) rates than the moderate and good RTL groups. Multivariate analyses showed that poor RTL was a significant survival predictor. Conclusion: The poor RTL group according to LTF is a potential predictor of clinical outcome.
Emerging evidence has revealed that radiation-related lymphopenia influences the clinical results in various solid tumours (1). Two major aspects that may influence lymphopenia are extrinsic factors, such as the radiation therapy (RT) field, and intrinsic factors, such as weak immunity resulting from chronic stress or cancer. Previous studies have evaluated possible causes of lymphopenia through clinical correlation of lymphopenia according to the same field as well as extended RT field in cervical cancer patients treated with concurrent chemoradiotherapy (CCRT) (2-4). However, although previous studies over the past 10 years have shown the association between RT field and lymphopenia and that lymphopenia could be resolved by reducing the field size (5), studies are limited regarding the association between radiation tolerance of lymphocytes (RTL) and clinical outcomes. This might be because there is no method to evaluate RTL in a clinical setting.
The absolute lymphocyte count (ALC) in the second week (ALC2), among weekly lymphocyte counts, was the most relevant factor associated with survival of cervical cancer patients treated with pelvic CCRT (3). The ratio of the relative lymphocyte count (RLC) to the pre-treatment ALC (ALC0) was the ALC2, a representative of RTL, which might also be a potential prognostic factor in cervical cancer. Specially, compared to the reduction rate from baseline to RLC1, the reduction rate from RLC in the first week (RLC1) to the RLC in the second week (RLC2) may better reflect the change in lymphocyte subsets such as T cells, which have a central role in adaptive immunity considering the anti-tumour effect, thereby resulting in higher tolerance to RT (6-8). Therefore, the RLC1 to RLC2 ratio may reflect the RTL that is relevant considering the anti-tumour effect. In addition, we can evaluate the RTL through a simple graph comprising the pre-treatment RLC (RLC0), RLC1, and RLC2, because a concave curve indicates more radio-resistance than a convex curve in a cell survival curve obtained during conventional radiobiology (9). Accordingly, the current study investigated whether lymphocyte tolerance factors (LTFs) using RLC were associated with clinical outcomes of cervical cancer patients treated with CCRT.
Patients and Methods
This study was approved by the Ajou University Hospital Institutional Review Board (AJIRB-MED-MDB-19-278). The need for informed consent was waived because of the retrospective nature of the study. The study included 92 patients with stage IB2-IVA cervical cancer, according to the 2018 International Federation of Gynecology and Obstetrics (FIGO) classification, who underwent weekly cisplatin-based CCRT at our hospital between 2007 and 2018. A total of 146 patients were excluded because 44 had extended RT fields; three were treated with neoadjuvant chemotherapy, 59 underwent fractionation modification, three underwent CCRT with fluorouracil, 30 did not undergo magnetic resonance imaging before treatment or in the fourth week during CCRT, and seven had no information about ALC before treatment, and in the first or second week during CCRT. All patients underwent biopsy for determining the tumour pathology as well as physical examination, complete blood count, and imaging studies [chest radiography, magnetic resonance imaging (MRI) and/or positron emission tomography-computed tomography (PET-CT)]. Cystoscopy or sigmoidoscopy was performed for patients with suspected bladder or rectal invasion on MRI.
All patients received weekly cisplatin of 40-70 mg/m2 for 5-6 weeks concurrent with RT. Overall, 91 patients underwent pelvic external beam RT (EBRT) followed by high-dose-rate intracavitary brachytherapy (HDR-BT) and one patient replaced HDR-BT with EBRT. The EBRT pelvic dose of 45 Gy in 25 fractions (1.8 Gy per day) was delivered, and boost irradiation was delivered to the parametrium or lymph nodes (LNs) at a dose of 5.4-14 Gy in 3-7 fractions for cases with parametrial invasion or LN metastasis. All patients underwent MRI for determining the acute tumour response to RT and for obtaining information regarding the effect of HDR-BT in the fourth week (between 36 Gy and 45 Gy) during pelvic CCRT. If the size of the cervical tumour did not decrease sufficiently to perform irradiation using point A of HDR-BT – as recommended by the International Commission on Radiation Units report 38 – additional EBRT was delivered to the central pelvis. Two-dimensional HDR-BT with iridium-192 was performed biweekly for 2-4 weeks after pelvic EBRT. The HDR-BT dose to point A was 5-30 Gy in 1-7 fractions. Point A was modified by 1 or 1.5 cm according to the size of the uterus in patients. During HDR-BT simulation planning, the equivalent doses (α/β ratio=3) of the rectal and bladder points were intended to be <70 Gy and 80 Gy, respectively. The total dose (TD) was the sum of the central pelvic EBRT EQD2 (equivalent dose in 2 Gy fractions using an α/β ratio of 10) and HDR-BT EQD2.
After treatment, follow-up was performed every 3 months in the first year and every 6 months thereafter. The median follow-up duration was 38 months (range=6-138 months) for 89 patients, as 3 patients, described as not applicable, did not visit the hospital after treatment completion and were lost to follow-up. Progression was evaluated by using Pap smears, tumour markers such as squamous cell carcinoma antigen and cytokeratin 19 fragments, and imaging studies such as computed tomography, pelvic MRI, and/or PET-CT. Patients who experienced disease progression underwent chemotherapy, RT, or conservative care. The study end-points were acute tumour response, progression-free survival (PFS), and disease-specific survival (DSS).
The acute tumour response during CCRT was evaluated by determining the ratio of the tumour volume (TV) on MRI in the fourth week (TV1) to the TV on MRI before treatment (TV0). TV was defined as the sum of the cervical tumour and enlarged LN, and measured by using the Eclipse Treatment Planning System, version 11.0 (Varian Medical Systems, Palo Alto, CA, USA). T2-weighted, diffusion-weighted, or dynamic contrast-enhanced MRI images were used to contour the TV. The ALC0, ALC in the first week during CCRT (ALC1), and ALC2 were acquired at the pelvic EBRT dose of 0 Gy, median 9 Gy, and median 18 Gy, respectively. The RLC0, RLC1, and RLC 2 were the pre-treatment RLC (the ratio of ALC0 to ALC0), the ratio of ALC1 to ALC0, and the ratio of ALC2 to ALC0, respectively. The value of RLC0 was fixed as 1. LTF1 was defined as the ratio of RLC1 to RLC2, as shown in Figure 1A. LTF2 was defined as the positive triangle dimension (Gy × ratio) with a convex shape (Figure 1B) or the negative triangle dimension with a concave shape (Figure 1C), both of which comprised the three vertexes of RLC0, RLC1, and RLC2. All the patients were stratified into three groups according to the median values of LTF1 and/or LTF2: patients with low LTF1 were included in the good RTL group, those with both high LTF1 and low LTF2 in the moderate RTL group, and those with both high LTF1 and high LTF2 in the poor RTL group. The following parameters were compared among the three groups: ALC0, ALC1, ALC2, age at diagnosis, pathologic type, FIGO stage, TV0 (cm3), TV1 (cm3), TV1 to TV0 ratio (TV1/TV0), HDR-BT dose (EQD2), TD (EQD2), RT technique, overall treatment time (weeks), progression, and disease-specific death (DSD). A linear association was observed between TV0 and TV1 with the trend line ±95% confidence interval (CI). TV0, TV1, and TV1/TV0 were compared among the three groups according to RTL in a sub-group of patients to obtain the linear correlation between TV0 and TV1. Comparisons between groups were performed using the Fisher's exact test or the chi-squared test for categorical variables and using analysis of variance for continuous variables. Differences in the PFS and DSS rates among the three groups were compared using Kaplan–Meier plots and log rank tests. A Cox proportional hazard model was used to compare young age, large TV0, poor RTL group, low HDR-BT dose, and low TD through multivariate analysis. Two-sided p-values <0.05 were considered statistically significant. All statistical analyses were performed using R software version 3.6.1 (the R foundation for Statistical Computing, http://www.r-project.org).
Results
The median (interquartile range) LTF1 and LTF2 were 1.532 (range=1.351-1.769) and 1.184 (range=0.22-1.731), respectively. Figure 2 shows the changes in the RLC in the good, moderate, and poor RTL groups. Table I shows the patient characteristics and data for ALCs, clinical factors, acute tumour response to RT, progression, and DSD for all the three groups according to LTF1 and LTF2. The poor RTL group had a higher number of patients with high-stage disease compared to the other two groups. The good RTL group included significantly more patients with small TV1 compared to the moderate RTL group or poor RTL group. Patients with a low TV1/TV0 and those with a high HDR-BT dose were more often observed in the good RTL group than in the other two groups. Patients who experienced disease progression and DSD were more common in the poor RTL group than in the other two groups.

(A) Lymphocyte tolerance factor (LTF) 1 was defined as the ratio of the relative lymphocyte count (RLC) in the first week to the RLC in the second week during concurrent chemoradiotherapy. (B) LTF 2 was defined as the positive triangle dimension with a convex shape and (C) as the negative triangle dimension with a concave shape.
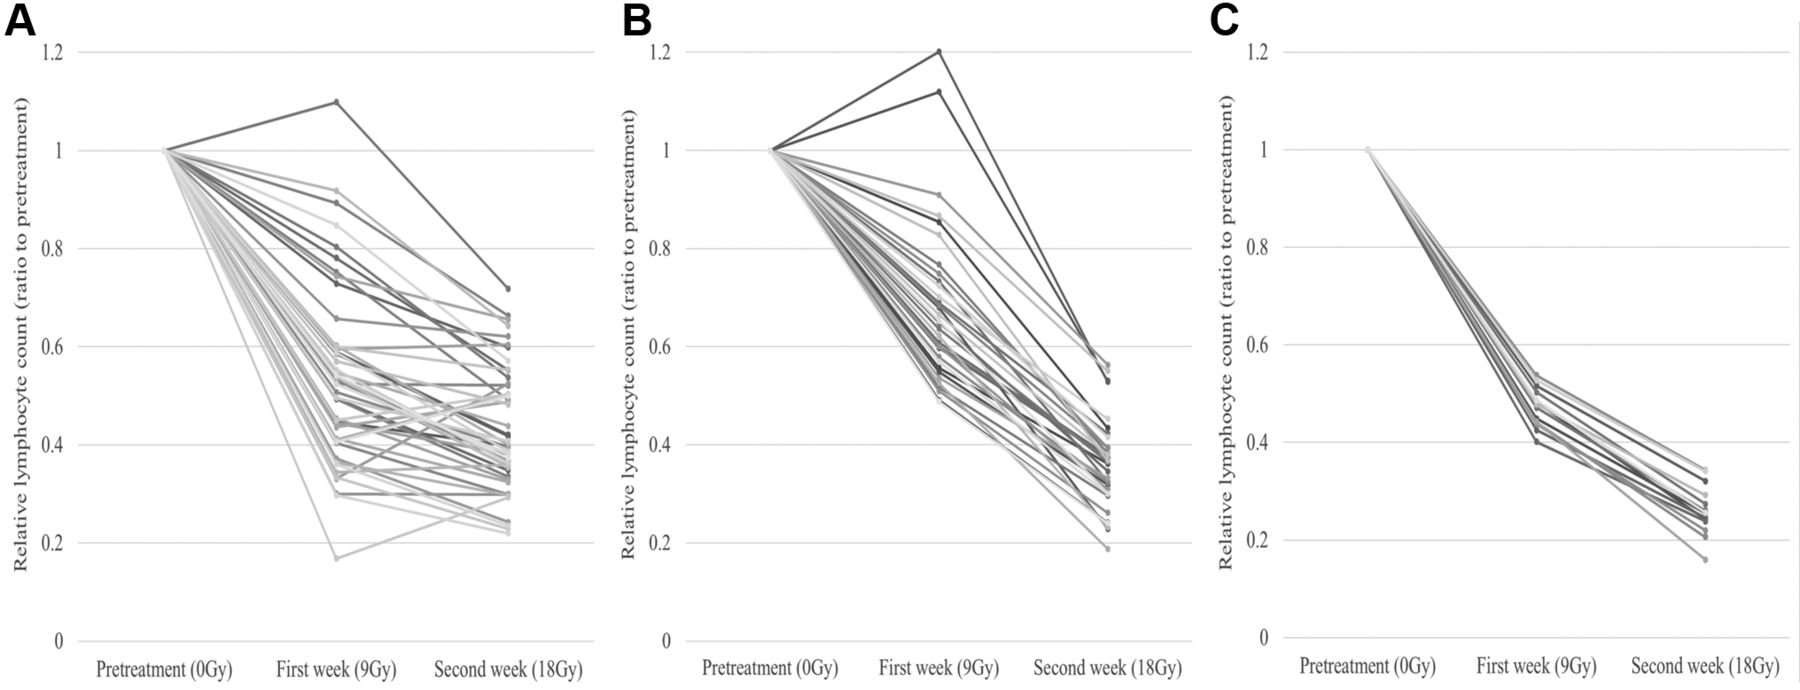
Changes in the relative lymphocyte count at 2 weeks since the start of concurrent chemoradiotherapy in (A) the good radiation tolerance of lymphocytes (RTL) group, (B) moderate RTL group, and (C) poor RTL group.
Figure 3 shows the linear regression analysis between TV0 and TV1. A total of 70 patients with TV0 >15 cm3 exceeded the 95%CI of the line showing the linear trend. Patients with a low TV1/TV0 were significantly more often present in the good RTL group than in the other two groups (Table II).
Local progression was observed in six patients. A total of nine patients showed distant metastasis, with metastasis to the para-aortic LN (PALN) in six, to the lung in one, to both PALN and lung in one, and dissemination in one. In addition, two patients showed both local progression and distant metastasis, with PALN metastasis in one and both PALN and liver metastasis in one. The 3-year PFS and 5-year DSS rates for all the patients were 79.1% and 89.5%, respectively. Figure 4 shows the Kaplan–Meier plots and log rank tests for PFS and DSS for all the three groups according to LTFs. The poor RTL group had lower 3-year PFS and 5-year DSS rates compared to the moderate RTL group and good RTL group (3-year PFS: 57.1% vs. 83.8% and 82%, p=0.01; 5-year DSS: 71.8% vs. 90.4% and 94.9%, p=0.062). Multivariate analyses showed that the poor RTL group was a significant predictor of PFS and DSD (Table III).
Clinical factors and treatment results according to lymphocyte tolerance factors.

The linear regression trend line (±95% confidence interval) between the pre-treatment tumour volume and the tumour volume obtained in the fourth week during concurrent chemoradiotherapy.
Acute tumour response to radiotherapy in patients with pre-treatment tumour volume more than 15 cm3.

Kaplan–Meier plots and log rank tests showing (A) progression-free survival and (B) disease-specific survival among the good radiation tolerance of lymphocytes (RTL) group, moderate RTL group, and poor RTL group.
Multivariate analyses for progression and disease-specific death in all patients.
Discussion
The degree of lymphocyte reduction might be influenced by the RTL in the same RT field and dose. In turn, the RTL could be due to the low immunity or immunosuppression due to cancer. The current study presents the clinical relevance of RTL through a simple model using RLC0, RLC1, and RLC2.
Previous methods measured RTL by analysing the apoptosis of lymphocytes after exposure to in vitro doses of 0, 2, 4, or 8 Gy (10). However, changes in the circulating lymphocytes of patients can interfere with the evaluation of an individual's immunity and the cancer immunosuppressive effect. Preclinical studies have shown that chronic stress or cancer cells could induce apoptosis of lymphocytes (11-14). Thus, the changes in circulating lymphocytes during CCRT can reflect the proportion of lymphocytes that are relatively prone to apoptosis after RT owing to the patient's original stress or cancer. In the current study, we analysed the pre-treatment RLC (0 Gy) as well as the RLC in the first week (9 Gy) and second week (18 Gy), i.e., at regular time intervals, with the same RT field and dose. As shown in the literature, T cells are more radio-resistant than B cells (6). Moreover, various types of T cells such as cytotoxic, helper, natural killer, and effector T cells are involved in anti-tumour immunity (7, 15, 16). Therefore, changes from RLC1 to RLC2, defined as LTF1, are more likely to indicate the radiation tolerance of T cells compared to that from RLC0 to RLC1 or that from RLC0 to RLC2. In the current study, the tumour response to RT was better in patients with low LTF1 (i.e., the good RTL group) than in those with high LTF1 (i.e., the moderate or poor RTL group), supporting the results of previous studies that showed that anti-tumour T cells could enhance tumour response to RT (17). However, the cell survival curve with a convex shape indicates the radio-sensitive property of irradiated cells while a survival curve with a concave shape indicates the radio-resistant property of irradiated cells (9). In the current study, the proportion of apoptotic lymphocytes was possibly higher in patients with a high LTF2 (the survival curve had a convex shape) than in those with a low LTF2 (the survival curve had a concave shape). This possibly indicates an immunosuppressive status that resulted from chronic stress or cancer. Thus, we can infer that reduction in anti-tumour T cells might be sustained in patients with both high LTF1 and LTF2 (i.e., the poor RTL group). The result of this study that the clinical outcomes in the poor RTL group were the worst among the three groups supports this inference.
The current study results suggest that RTL, described as changes in the RLC, can predict the treatment results in cervical cancer patients treated with primary CCRT. This implies the existence of regulatory factor(s) relevant to an individual RTL as well as risk stratification through the simple calculation of the RLC. Repeated acute stress might induce imbalance in the immune homeostasis, and changes in the regulatory factors such as stress hormones or microRNAs could result in changes in the RTL (18, 19). Moreover, regulatory RNAs from tumour cells influenced immune escape through a decreased activity of anti-tumour T cells (20). Therefore, RTL, as a prognosticator, might help to identify a group of regulatory proteins or RNAs in cervical cancer.
The current study has several limitations. The duration of follow-up was not long enough to assess long-term survival. Moreover, the timing of lymphocyte collection and the irradiation dose were not exactly the same in all patients owing to uncontrolled clinical practices, both of which could have affected ALC. Furthermore, this was a small-sized retrospective study. Therefore, a prospective study is warranted to confirm the clinical significance of the poor RTL group. Nevertheless, the current study was the first to evaluate the association between RTL and clinical outcomes as well as to provide a simple method for RTL measurement.
In conclusion, the poor RTL group divided by LTFs is a potential predictor of poor acute tumour response, PFS, and DSS. The results of the study are valuable, as they can be used in future pioneering studies to discover the upper regulatory factors that affect the development and prognosis of cervical cancer as well as to determine the predictors of clinical results in patients treated with primary CCRT.
Acknowledgements
This research was supported by the Bio & Medical Technology Development Program of the National Research Foundation (NRF) funded by the Korean government (MSIT) (NRF-2018M3A 9E8023860). This work was supported by the intramural research fund of Ajou University Medical Center.
Footnotes
Authors' Contributions
OC was responsible for the conception and design. OC, MC, SJC, TWK, EJL, and YL were responsible for the acquisition of date. SL and OC were responsible for the statistical analyses and interpretation. SL wrote the first draft of the manuscript. All Authors read and approved the final manuscript.
This article is freely accessible online.
Conflicts of Interest
There are no conflicts of interest to declare regarding this study.
- Received August 7, 2019.
- Revision received September 10, 2019.
- Accepted September 11, 2019.
- Copyright© 2019, International Institute of Anticancer Research (Dr. George J. Delinasios), All rights reserved
References
In this issue


Jump to section
Related Articles
Cited By...
- No citing articles found.