


Abstract
Background: In recent years, the number of cancer patients has increased. Cancer patients are prone to sarcopenia as a result of the decrease in muscle mass and muscle weakness which occurs in cancer cachexia. Attention has been given on the effects of fatty acid administration on cancer patients. Materials and Methods: We conducted a retrospective chart-review study of consecutive patients with unresectable advanced GI cancer (stage IV) (n=46) receiving chemotherapy treatment in an outpatient or in-hospital setting between December 2012 and September 2015 at our Institution. The collected data were characteristics, psoas muscle area as measured by computed tomography (CT), and biochemical blood test and serum fatty acid profiles. Three methods of analysis were evaluated: (i) Comparison of biomarkers between two groups: psoas muscle index change rate (ΔPMI) decrease group vs. ΔPMI increase group. (ii) Correlation between ΔPMI and biomarkers. (iii) Multiple regression of ΔPMI and biomarkers Results: In the ΔPMI decrease group, n-6/n-3 ratio and AA/EPA ratio in the decrease group were significantly higher than those in the increase group. Among all parameters, serum EPA was positively and significantly related to ΔPMI (CC=0.443, p=0.039). In contrast, serum CRP, AA/EPA ratio and n-6/n-3 ratio were negatively related to ΔPMI (CC=−0.566, CC=−0.501, CC=−0.476, p=0.006, p=0.018, p=0.025, respectively). On multiple regression analysis, serum CRP value was strongly related to ΔPMI (r2=0.421, β=−0.670, p=0.001). Conclusion: Higher n-6/n-3 and AA/EPA ratios were associated with a decrease in psoas muscle area, that lead to diagnosis of sarcopenia. Higher CRP was also associated with a decrease in psoas muscle area, suggesting that this might be an indicator of cachexic skeletal muscle depletion in cachexic patients with advanced gastro-intestinal cancers.
The International Agency for Research on Cancer (IARC) reported that 14 million cases of cancer were newly diagnosed in 2012 (1). This number is expected to increase up to 22 million people in another 20 years (1). Cancer patients are prone to sarcopenia as a result of the decrease in muscle mass and muscle weakness which occurs in cancer cachexia (2, 3). Sarcopenia can also be diagnosed by measuring the psoas muscle area (4, 5). Although nutritional management of cancer patients to prevent and resolve sarcopenia has not been established, attention has been focused on the effects of fatty acid administration on cancer patients (6-8). Furthermore, studies that have identified a relationship between a significant decrease in psoas muscle volume and CRP increase in patients with cancer cachexia (9). Against this background, we hypothesized that factors relating to CRP increase, such as fatty acid profile as inflammatory profiles, were associated with a decrease in psoas muscle volume (10). In addition, n-3 fatty acid enriched diets are proved to down-regulate the production of the pro-inflammatory cytokines (11), and they also reduce Th1 cytokines from monocytes and macrophages, and suppress to activate immune cells such as T-lymphocytes, NK cells, and monocytes (12-14), and finally they play important roles in inflammation-related diseases. The previous study (15) reported that suppression of cancer cells as well as formation of IL-6 precursors when human colorectal cancer cells. Giving an observation at the level of cancer cells, omega-3 polyunsatulated fatty acid (PUFA) levels were reported to decrease associated with reduced expression of Toll-like receptor 4 (TLR4) and reduction of skeletal muscle volume (16).
To investigate these results, we studied the association of psoas muscle area and serum fatty acids. Our goal was to determine whether a disturbance of serum inflammatory status could be treated by nutritional treatments, leading to an improvement in cachexia.
Materials and Methods
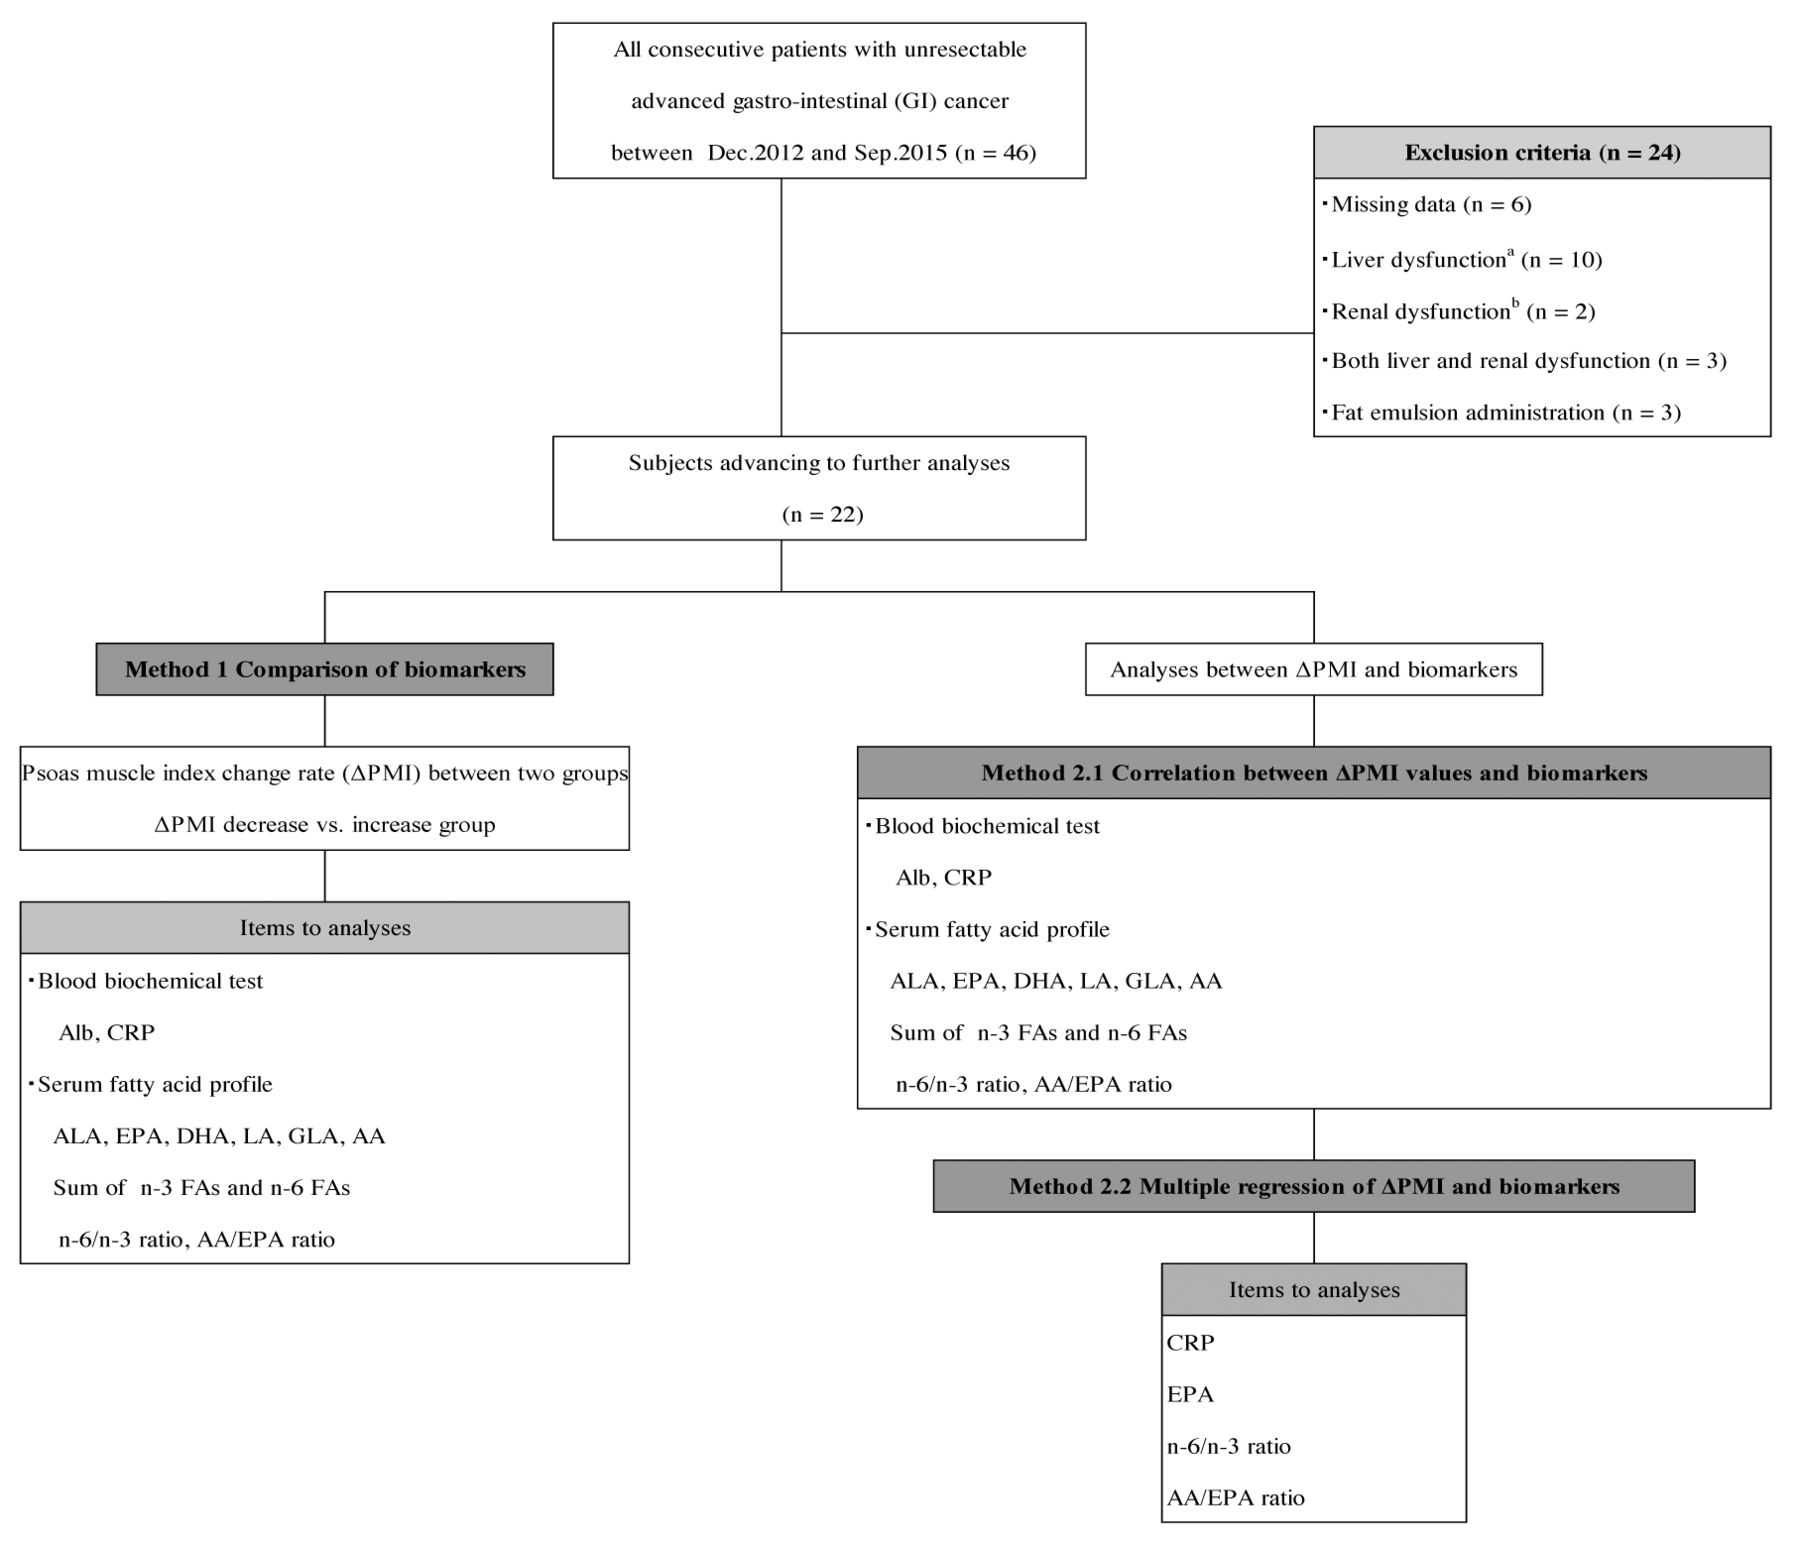
Subjects. The study was conducted under a retrospective chart-review design in all consecutive patients with unresectable advanced gastro-intestinal (GI) cancer (stage IV) undergoing chemotherapy on in- or outpatient basis at our institution between December 2012 and September 2015. Exclusion criteria were missing one or more data collections listed the followings; liver (AST >40 IU/l or ALT >40 IU/l, T-Bil >1.5 mg/dl) renal dysfunction (serum creatinine >1.5 mg/dl) or both; and fat-emulsion administration (Figure 1). This study was approved by the Ethics Committee of the institute and its approval number was H-28-026.
Data handling. The collected data were classified into the following four domains: (1) characteristic domain, including age, gender, height, weight (before last surgery), and site of cancer; (2) psoas muscle volume domain, measured by computed tomography (CT) to calculate psoas muscle index (PMI), its change rate (ΔPMI), psoas muscle index (PMI) value, ΔPMI (%), and average ΔPMI for 30 days (%), as calculated by the following equations:
 Average ΔPMI for 30 days (%)=ΔPMI/number of days between the day of surgery and final blood collection (days) ×30; (3) biochemical blood test, including albumin (Alb) and C-reactive protein (CRP) concentration; and (4) serum fatty acid profile, including serum concentrations of α-linolenic acid (ALA), eicosapentaenoic acid (EPA), docosahexaenoic acid (DHA), linoleic acid (LA), γ-linolenic acid (GLA), arachidonic acid (AA), sum of serum n-3 fatty acids (FAs), sum of serum n-6 FAs, n-6/n-3 ratio and AA/EPA ratio. Here, the sum of serum n-3 and n-6 FAs were ALA+EPA+DHA and LA+GLA+AA, respectively. Analysis was contracted to a large commercial laboratory (BML Inc.; [and city and country]). Serum samples were obtained by centrifugation and frozen until analysis by gas chromatography (17). Patient demographics are shown in Table I.
Biochemical blood tests and serum fatty acid profiling were conducted on the same day as CT imaging for the measurement of psoas muscle volume during a stabilized period before discharge after final surgical procedure. ΔPMI was measured twice: first measurement was done on the day of admission for final surgery and second was done 50 days after first measurement.
Method 1: Comparison of biomarkers between ΔPMI increase group and ΔPMI decrease groups. ΔPMI for individual subjects was calculated and used to divide patients into decrease and increase groups. The results of blood biochemical tests and serum fatty acid profile in these two groups were then compared.
Demographics of all subjects
Method 2: Comparison of ΔPMI and biomarkers by correlation between ΔPMI and biomarkers (Method 2.1) and multiple regression analysis of ΔPMI and biomarkers (Method 2.2). In Method 2.1, the correlation between ΔPMI and (1) all blood biochemical parameters, and (2) fatty acids in all subjects was evaluated. In Method 2.2, factors which showed a correlation in Method 2.1 were analyzed by multiple regression analysis.
Statistical analysis. Median and quartiles (25%, 75%) were determined and significant differences among groups were analyzed by the Mann-Whitney test in Method 1. A p-value of <0.05 was considered to indicate statistical significance. Values in Method 2-1 were analyzed by Spearman's rank correlation coefficient. Spearman's rank correlation coefficient is accepted as very strong in the range of ±0.7~±1, strong correlation in the range of ±0.4~±0.7, slightly correlated in the range of ±0.2~±0.4, ±0.2 < no correlation. Multiple regression analysis was performed in Method 2-2. The independent variables were selected four items in which CRP, EPA, n-6/n-3 ratio and AA/EPA ratio showing significant correlation in results of Method 2-1. All statistical analyses were conducted using PASW for Windows Version 23.0 (SPSS Inc, Chicago, IL, USA).
Results
Patient characteristics. The characteristics of all subjects are presented in Table I.
Results of Method 1 - Comparison of biomarkers between two groups: ΔPMI increase group vs. ΔPMI decrease group. In the ΔPMI decrease group, n-6/n-3 and AA/EPA ratios in decrease group were significantly higher than those in the increase group. These observations could be interpreted that patients with n-6/n-3>5.73 or AA/EPA >3.96 expressed in their medium values (Table II) are predicted to have psoas muscle depletion or sarcopenia. To contrary, no significant difference existed between blood biochemical tests and other serum fatty acid profiles among two groups (Table II).

Flow chart of this study. All consecutive patients with with unresectable advanced gastro-intestinal (GI) cancer (stage IV) undergoing chemotherapy on in- or outpatient basis at our Institution. Alb: Albumin; CRP: C-reactive protein; ALA: α-linolenic acid; EPA: eicosapentaenoic acid; DHA: docosahexaenoic acid; LA: linoleic acid; GLA: γ-linolenic acid; AA: arachidonic acid; Sum of n-3 FAs: ALA+EPA+DHA; Sum of n-6 FAs: LA+GLA+AA. aLiver dysfunction: AST >40 IU/L or ALT >40 IU/L, T-Bil >1.5 mg/dl. bRenal dysfunction: serum-creatinine >1.5 mg/dl.
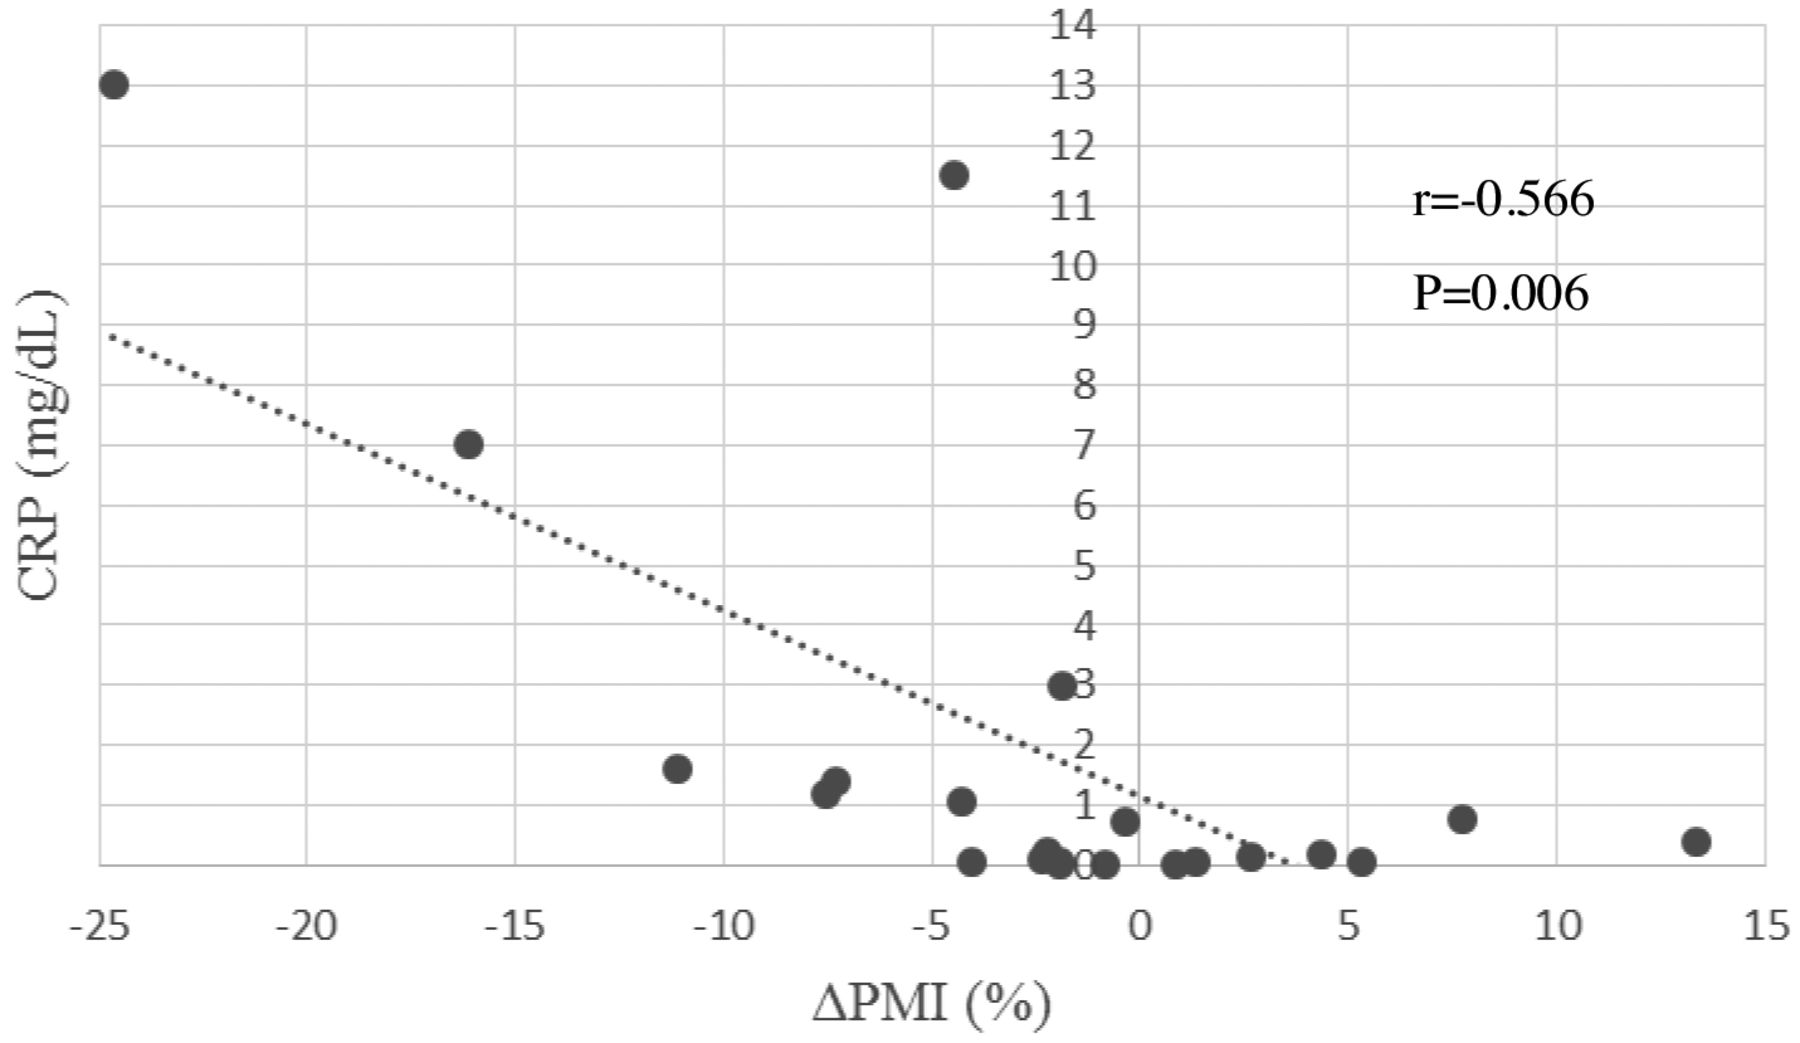
Results of Method 2.1 - Correlation between ΔPMI and biomarkers. Correlation coefficients and their p-values for all analyzed parameters were shown in Table III. Among all parameters, serum EPA seemed positively related to ΔPMI significantly (CC=0.443, p=0.039). To contrary, serum CRP, AA/EPA ratio and n-6/n-3 ratio were negatively related to ΔPMI (CC=−0.566, −0.501, −0.476, p=0.006, 0.018, 0.025, respectively). These results might be interpreted that serum fatty acid, mainly n-6/n-3 ratio and CRP might be mirror images of muscle volume (Figures 2 and 3).
Results of Method 2.2-Multiple regression analysis of ΔPMI and biomarkers. Multiple regression analysis has shown that serum CRP value seemed strongly related to ΔPMI (r2=0.421, β=−0.670, p=0.001). This result could be interpreted that decreasing of psoas muscle seemed to be affected by an inflammation, shows by serum CRP before surgery. Furthermore, inflammation status before surgery might predict decreasing rate of muscle volume up to six-twelve month, after surgery (Table IV).
Discussion
Previous studies have shown that a lower ΔPMI, likely to be sarcopenia, results in poor prognosis in patients with solid cancers. In other words, cancer patients with inflammation due to cancer cachexia must be considered to be associated with risk factors nutritionally.
Comparison of biomarkers between ΔPMI decrease group vs. ΔPMI increase group.
Correlation between ΔPMI and biomarkers taken before surgery
CRP as an indicator of psoas muscle volume depletion. We had hypothesized in the pre-study period that a larger ΔPMI might be associated with lower Alb or higher CRP on the basis that Alb and CRP are both indicators of inflammation associated with advanced cancer, as in the patients in this study. In a comparative study, no significant difference was found between ΔPMI and CRP (0.08, 2.30, p=0.084). However, as so ΔPMI and CRP values were negatively correlated, decreases of psoas muscle area could be considered to be associated with co-existing inflammation as read by CRP elevation. Furthermore, since CRP (p=0.001) was found to have the strongest association with ΔPMI in multiple regression analysis, psoas muscle area might decrease as a result of inflammation shown with CRP elevation. In previously studied examination, CRP was reported to be an accurate measurement of pro-infllamatory cytokine activity that has been implicated in muscle wasting (18-20). This might support our observation that CRP seems to be a strong predictor of muscle wasting and cachexia in patients with advanced cancers. In summary, CRP levels measured before surgery or chemotherapy in patients with advanced gastro-intestinal cancers seemed to be used on ordinary daily-basis in the clinical settings and to be a good predictor of cancer cachexia and loss of skeletal muscle mass.
Multiple regression of ΔPMI and biomarkers taken before final surgery.

Correlation between ΔPMI (%) and CRP. The blood samples were drawn one day before surgery. ΔPMI: Psoas muscle index change rate; CRP: C-reactive protein.

Correlation between ΔPMI (%) and serum n-6/n-3 ratio. The blood samples were drawn one day before surgery. ΔPMI: Psoas muscle index change rate; ALA: α-linolenic acid; EPA: eicosapentaenoic acid; DHA: docosahexaenoic acid; LA: linoleic acid; GLA: γ-linolenic acid; AA: arachidonic acid; Sum of n-3 FAs: ALA+EPA+DHA; Sum of n-6 FAs: LA+GLA+AA.
n-6/n-3 and AA/EPA ratios as indicators of psoas muscle volume depletion. We anticipated that higher ΔPMI would be associated with lower n-3 fatty acid levels as an anti-inflammatory effect in the serum fatty acid profile. We also anticipated that inflammatory n-6 fatty acid levels would be higher in the inflammatory phase. Results showed that n-6/n-3 ratio (4.39, 7.72, p=0.024) and AA/EPA ratio (2.64, 5.06, p=0.009) was significantly higher in the ΔPMI decrease group, suggesting that ΔPMI and serum fatty acid were associated or that the relationship might be causal. In addition, since ΔPMI and n-6/n-3 and AA/EPA ratios were negatively correlated, psoas muscle area and serum fatty acid concentrations expressed as inflammatory/anti-inflammatory profile ratio could be considered to be related. We, therefore, suggest that a higher serum n-6/n-3 ratio is associated with a decrease in psoas muscle area volume and the possibility of sarcopenia. If fatty acid profile could be measured in the clinical setting, it could serve as a predictor of sarcopenia or muscle-depleting cachexia in patients with advanced cancer. These results on serum fatty acid profiles in patients with advanced gastrointestinal cancers as n-6/n-3 ratio or arachidonic acid (AA)/eicosapentaenoic acid (EPA) ration, taken before surgery or chemotherapy, seem as adequate indicators of cancer cachexia or decrease of skeletal muscle mass observed later.
Clinical implication for n-3 fatty acids administration to patients diagnosed elevated serum AA/EPA or n-6/n-3 ratio. We could emphasize what a clinical implication can be evaluated when patients are detected to have an elevated serum AA/EPA or n-6 / n-3 ratio. There have been reports that inflammation and nutritional status improved by intervention with fish oil administration. (7, 21, 22). As fish oil is rich in EPA and DHA, we therefore considered that an improved CRP and decreased serum AA/EPA ratio, or n-6/n-3 ratio could be reached by eating a diet with n-3 fatty acid, such as EPA and DHA. In this context, we conclude that adverse events associated with cachexic PMI decrease could be prevented by changing serum fatty acids profiles with fish oil supplementation, leading to an elevated AA/EPA ratio and n-6/n-3 ratio, observed in the present study. Moreover, dietary supplementation with n-3 fatty acids including fish oil or marine phospholipids has stabilized loss and appetite observed in patients with cancer cachexia in a randomized controlled double-blinded trial (23). Additionally, other studies have also shown the effectiveness of nutritional supplementations with fish oil or leucine to improve cachexic status in patients with esophagus cancer (24). It could, therefore, be said that dietary supplementation with n-3 fatty acids may be applied to prevent advancing cancer cachexia and decreased quality of life for patients with diagnosed elevated serum AA / EPA or n-6 / n-3 ratio.
Study limitations. Several limitations of this study warrant mentioning. First, the number of subjects was too small to allow drawing of definitive conclusions. Second, the subjects included patients who survived and died. Comparison of separate analyses of dead and surviving cases might help clarify risk factors. Third, no information about the diet of subjects was obtained, and we were unable to determine whether food intake had an impact on the changes in fatty acid profile. Although patients administered fat emulsion were excluded, detailed nutritional status of patients was not known. Further analysis of the impact of diet on these changes is necessary. Fourth, fatty acids were measured in serum samples. Measurement is also possible in red blood cell membranes, that due to the long half-life of erythrocytes provide more stable levels. Accordingly, values obtained by measurement of erythrocyte membrane composition might be more accurate. Fifth, the PMI measurement date might produce an error because it was measured by manually outlining the margin of the psoas muscle area on CT images. Measurement was performed on different days, depending on the patients' status, for example on the day of blood sampling date, or 50 days after this date. Therefore, to standardize the change in psoas muscle volume on different days, the average ΔPMI for 30 days was calculated. Further prospective, well-scheduled studies are warranted.
Conclusion
An n-6/n-3 or AA/EPA ratio higher than 5.73 or 3.96, respectively, is associated with a decrease in psoas muscle volume, possibly leading to diagnosis of sarcopenia and corresponding to a poor outcome. Due to expenses, however, fatty acid profiling in most hospital clinical settings is not feasible. In these settings, elevated CRP is a suitable surrogate of fatty acid profile; as CRP levels increase in patients with advanced GI cancers, psoas muscle volume may decrease, leading to sarcopenia and a poor patient outcome. We consider that CRP improvement and decrease of serum AA/EPA and n-6/n-3 ratio –by receiving a diet with n-3 fatty acid, such as EPA and DHA– to be able to prevent cachexic PMI decrease associated with adverse events. Furthermore, a significant relationship between elevated serum AA/EPA ratio, n-6/n-3 ratio and PMI depletion in cachexic cancer patients was shown.
Acknowledgements
This study was supported by Ms. Junko Kawaguchi, RD, who kindly supported the preparations for the approval of the Ethics Committee of the institutes, Osaka Saiseikai Nakatsu Hospital.
Footnotes
This article is freely accessible online.
Conflicts of Interest
The Authors declare that they have no conflicts of interest.
Ethical Statement
The Authors certify that they comply with the ethical guidelines for publishing in the Journal of Cachexia, Sarcopenia and Muscle: update 2015.
- Received March 29, 2017.
- Revision received June 10, 2017.
- Accepted June 12, 2017.
- Copyright© 2017, International Institute of Anticancer Research (Dr. George J. Delinasios), All rights reserved


