


Abstract
We have previously reported that salivary glycine and proline levels are increased to nearly butanoate level in elderly people. In order to identify the source of glycine and proline, we performed high-performance liquid chromatography analysis of amino acid production to a total of seven oral cells before and after stimulation with inflammation inducers. We found that production of amino acids (per a given number of cells) by normal oral mesenchymal cells (gingival fibroblast, pulp cell, periodontal ligament fibroblast) was approximately three-fold that of oral squamous cell carcinoma cell lines (HSC-2, HSC-3, HSC-4, Ca9-22), and that production of glycine and especially proline by all these seven cells was much lower than that of glutamine and glutamic acid. Treatment of three oral mesenchymal cells with interleukin (IL)-1β or lipopoly-saccharide (LPS) reproducibly increased the production of glutamic acid and glutamine, but not that of glycine and proline. Glycine and proline only marginally stimulated the IL-8 production by IL-1β-stimulated gingival fibroblast, whereas glycine dose-dependently inhibited the nitric oxide production by lipopolysaccharide-stimulated mouse macrophage-like RAW264.7 cells. These data demonstrated that normal oral mesenchymal cells are not the major source of glycine and proline that accumulates in the saliva of aged people, suggesting the involvement of the deregulation of collagen metabolism during aging.
We have recently discovered the following unique properties of glycine, the most abundant amino acid in saliva: The production of glycine was most dramatically increased during activation of mouse macrophage-like cells (1); the salivary concentration of glycine was significantly increased by template therapy whereas other amino acids did not (2); the salivary concentration of glycine was most dramatically increased among twenty amino acids in elderly people, nearly reaching that of butanoate, a bacterial product (3), keeping the ratio of glycine to proline at nearly the same value (0.623) with that of collagen (4, 5). Survey through PubMed revealed that only eight articles have investigated the salivary proline (all published before 2005) and only two articles including our own (3) have reported the increase of glycine and proline during the aging process. However, it is not yet clarified from which cells or tissues glycine and proline are derived.
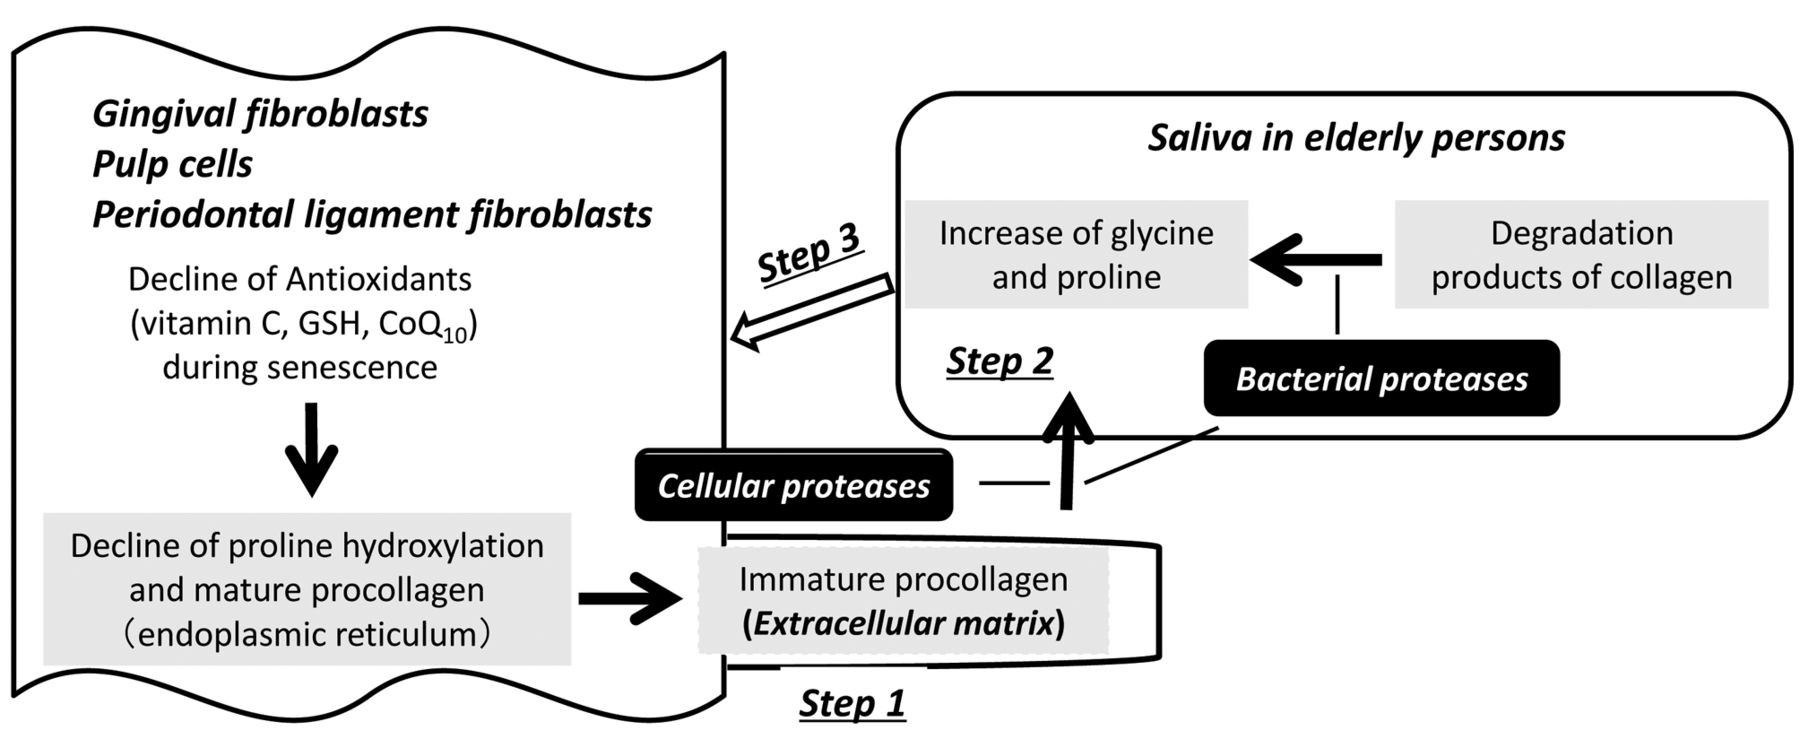
We thought that the increase of salivary concentrations of both glycine and proline during aging process (from children to highly elderly persons), keeping the same ratio of these two amino acids with that reported for collagen may be due to the changes in the collagen synthesis, secretion and degradation steps. Collagen is synthesized and secreted mainly by mesenchymal cells such as fibroblasts, osteoblasts, chondroblasts and odontoblasts, and form the intercellular matrix. The oral cavity hosts a variety of different fibroblast populations that are generally responsible for maintaining homeostasis of the soft connective tissue (6). Proline is first hydroxylated by reducing agents such as ascorbic acid to form protocollagen in the endoplasmic reticulum (7), which is then secreted and matured into extracellular collagen matrix. We made a following working hypothesis: (i) intracellular anti-oxidant levels decline during aging (8), possibly reducing the proline hydroxylation level and secreting higher amounts of immature procollagen (step 1); (ii) such immature procollagen may be more easily attacked by cellular proteases (various types of matrix metalloproteases MMPs) (9) or bacterial collagenolytic proteases (such as MMPs and serine proteases) (10), producing higher amounts of glycine and proline (step 2); (iii) glycine and proline accumulated in the saliva may modify the function of fibroblast (step 3) (Figure 1).

Hypothetic diagram of the possible mechanism of age-associated increase in the salivary glycine and proline.
In the present study, we compared three normal oral mesenchymal cells [gingival fibroblast (HGF), pulp cell (HPC), periodontal ligament fibroblast (HPLF)] and non-mesenchymal oral squamous cell carcinoma cell lines (HSC-2, HSC-3, HSC-4, Ca9-22) regarding their ability to secrete glycine and proline into the extracellular medium before and after stimulation with interleukin (IL)-1β or lipopolysaccharide (LPS). We also investigated whether glycine and proline affects the IL-8 production by IL-1β-stimulated HGF (11), and nitric oxide (NO) production by LPS-stimulated mouse macrophage-like RAW264.7 cells (12).
Materials and Methods
Materials. The following chemicals and reagents were obtained from the indicated companies: Dulbecco's modified Eagle's medium (DMEM), from GIBCO BRL (Grand Island, NY, USA); Fetal bovine serum (FBS), LPS from Escherichia coli (Serotype 0111:B4), 3-(4,5-dimethylthiazol-2-yl)-2,5-diphenyltetrazolium bromide (MTT) from Sigma-Aldrich Inc. (St. Louis, MO, USA); Glycine and proline, from Wako Pure Chemical (Osaka, Japan); IL-1β, from R & D Systems (Minneapolis, MN, USA); Culture plastic dishes and plates (96-well) were purchased from Becton Dickinson (Franklin Lakes, NJ, USA).
Cell culture. HGF, HPLF and HPC cells, established from the first premolar tooth extracted from the lower jaw of a 12-year-old girl (13), and OSCC cell lines (Ca9-22, HSC-2, HSC-3, HSC-4) (Riken Cell Bank, Tsukuba, Japan) were cultured at 37°C in DMEM supplemented with 10% heat-inactivated FBS, 100 U/ml, penicillin G and 100 μg/ml streptomycin sulfate under a humidified 5% CO2 atmosphere. HGF, HPC and HPLF cells at the population double level (PDL) of 10~20 were used in the present study.
Assay for cytotoxic activity. The relative viable cell number was then determined by the MTT method. In brief, the culture medium was replaced with MTT (0.2 mg/ml) dissolved in DMEM, and cells were incubated for 2 h at 37°C. After replacing the medium, the formazan product was dissolved with DMSO, and the absorbance at 540 nm of the lysate was determined by using a microplate reader (Multiskan; Biochromatic Labsystem, Osaka, Japan). The exact viable cell number was also determined by hemocytometer after detachment with trypsin-EDTA solution.

Separation of twenty amino acids by high-performance liquid chromatography. 1. Asp; 2. Glu; 3. Gln; 4. His: 5. Ser; 6. Gly; 7. Arg; 8. Thr; 9. Ala; 10. Tyr; 11. GABA; 12. Pro; 13. Met; 14. Val; 15. Trp; 16. Ile; 17. Leu; 18. Phe; 19. Nle (norleucine, internal standard); 20. Cys; 21. Lys.

Amino acid production by unstimulated normal oral mesenchymal cells (A) and oral squamous cell carcinoma cell lines (B) during 1 h incubation time. Each value represents mean ±S.D. of three independent experiments.
Measurement of amino acid production by HPLC. Cells (6×10³) were inoculated on 96-microwell plate and incubated for 24 h to achieve a complete cell attachment. Cells were then incubated for 24 h without or with IL-1β (1 ng/ml) in fresh medium. After medium change (0 Time), cells were incubated for another 1 h. The amino acid production and consumption during 1 h was measured by HPLC [Column: Microsorb MW 100-5 C18 (250 mm × 4.6 mm I.D., Varian); Mobile Phase: 0 min (30% B), 0-10 min (30% B), 10-45 min (40% B), 45-75 min (60% B), 75-80 min (60% B), 80-81 min (30% B), 81-90 min (30% B) (solvent A: 50 mM sodium acetate buffer, pH 5.0, solvent B: methanol); flow rate: 0.9 ml/min; column temperature: 40°C; injection volume: 10 ml; detection: Ex 335 nm, Em 515 nm] (Figure 2), using the following equation: Amino acid production and consumption = Cafter incubation − Cbefore incubation/104 cells/h.
Determination of IL-8. We have previously established the human gingivitis model using HGF cells (14). We have reported that IL-1β stimulation induced two orders higher production of prostaglandin E2, IL-6, IL-8 and monocyte chemotactic and activating factor (MCP-1), but not that of tumor necrosis factor (TNF)-α and nitric oxide (NO) (14). IL-8 released into the culture supernatant was determined by ELISA, according to the manufacturer's instruction (Quantikine ELISA kit; R&D Systems) (14).
Determination of NO. Raw264.7 cells were treated for 24 h without or with LPS (100 ng/ml), in the presence of the indicated concentrations of glycine, and the NO released into the culture supernatant was determined by the Gries method (1).
Statistical analysis. Data are expressed as the mean±standard deviation (SD). Statistical analysis was performed by paired t-test and non-parametric analysis. Differences were considered significant at p<0.05.
Results
Amino acid production in unstimulated cells. Most amino acids were produced (showing plus values), rather than consumed (showing minus values) in both normal oral cells (HGF, HPC, HPLF) (A) and oral squamous cell carcinoma cell lines (HSC-2, HSC-3. HSC-4, Ca9-22) (B) (Figure 3). Leucine and isoleucine, most common amino acids, were produced at nearly equimolar concentrations in both normal and tumor cells. Glutamine and glutamic acid were produced at the highest amounts. On the other hand, the production of glycine and proline was less than 50% or only 2% that of glutamic acid and glutamine, respectively, in most cases. Normal cells produced approximately 2.9±2.2-fold (range: 1.0~7.2) higher amino acid levels, compared to OSCC cell lines (Figure 3).
Amino acid production in IL-1β-stimulated oral cells. When HGF (A), HPC (B) and HPLF cells (C) were stimulated with LPS or IL-1β, production of glutamic acid and glutamine were most dramatically increased in all these cells (Figure 4). When the values obtained with unstimulated cells were subtracted from all data, glycine production was found to also increase, but only 15%, whereas increase of other amino acids was less than 5% of that of glutamic acid and glutamine (Table I). The stimulation effect of IL-1β was only slightly higher than that of LPS (1.33±2.4-fold, p=0.1213, non-parametric analysis).
Effect of glycine and proline on the production of pro-inflammatory substances. IL-1β (5 ng/ml) tended to slightly stimulate the growth of HGF cells, but increased the IL-8 production by more than 400-fold (from 0.44 to 189 ng/ml). Addition of proline and glycine only marginally elevated the IL-8 production by IL-1β-stimulated HGF cells (Figure 5).
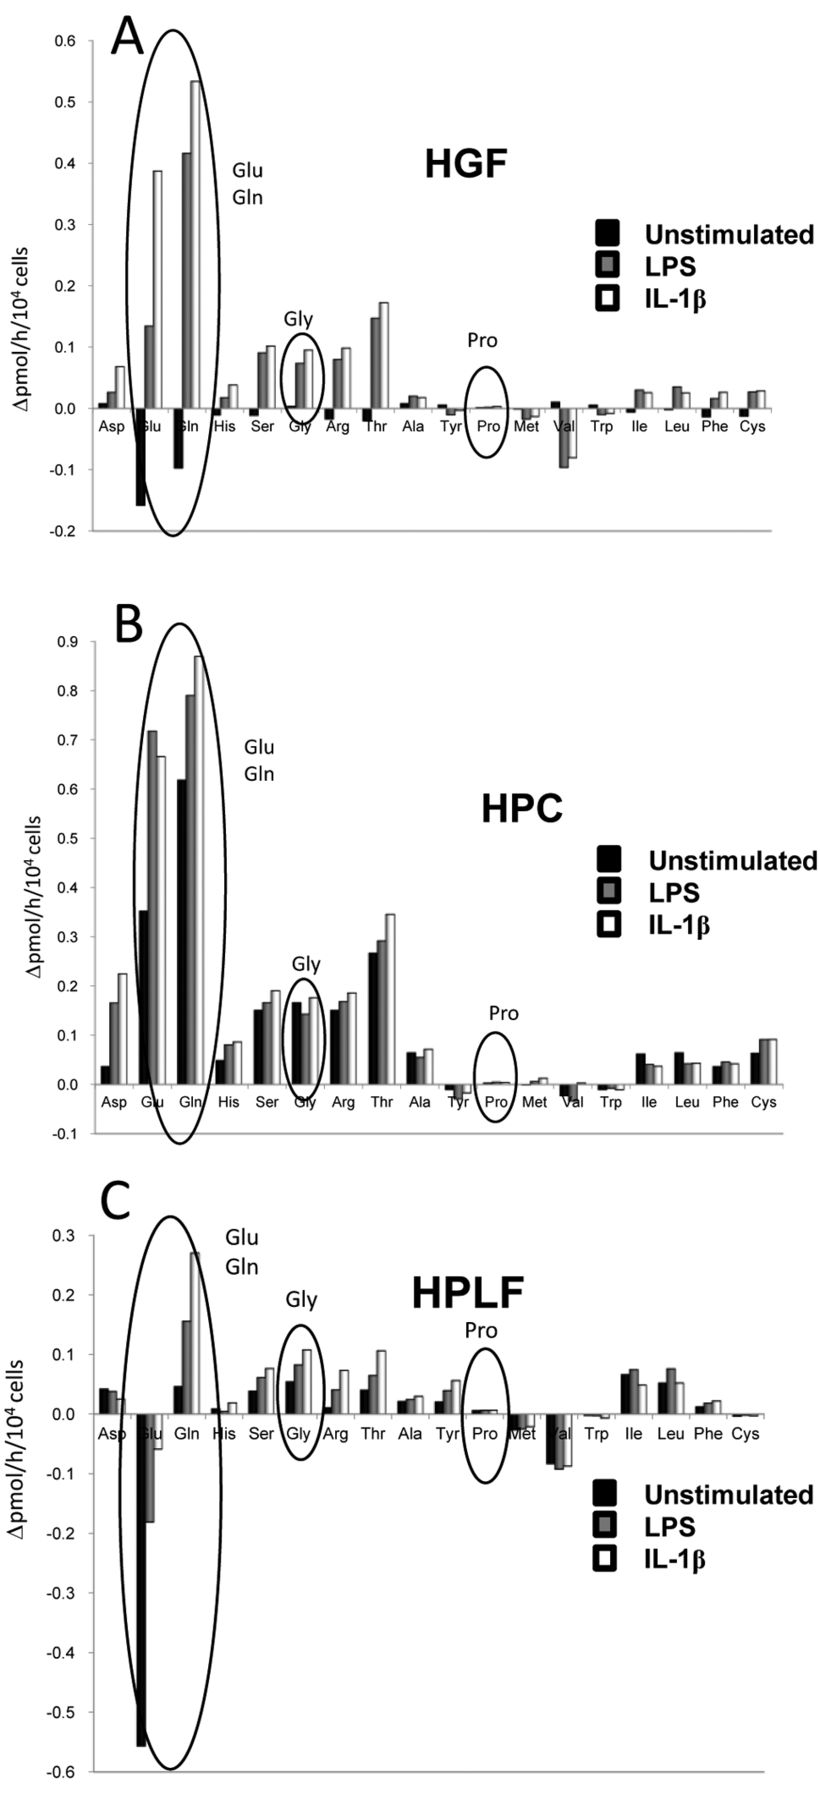
Effect of LPS and IL-1β on the production of amino acids by HGF (A), HPC (B) and HPLF(C) during 1 h incubation time. Each value represents mean±S.D. of triplicate assays.
LPS (100 ng/ml) stimulated the NO production more than 30-fold (from 0.45 to 16.2 μM), without affecting the cellular viability. Addition of glycine dose-dependently reduced NO production (p<0.05) without affecting the viability (Figure 5C).
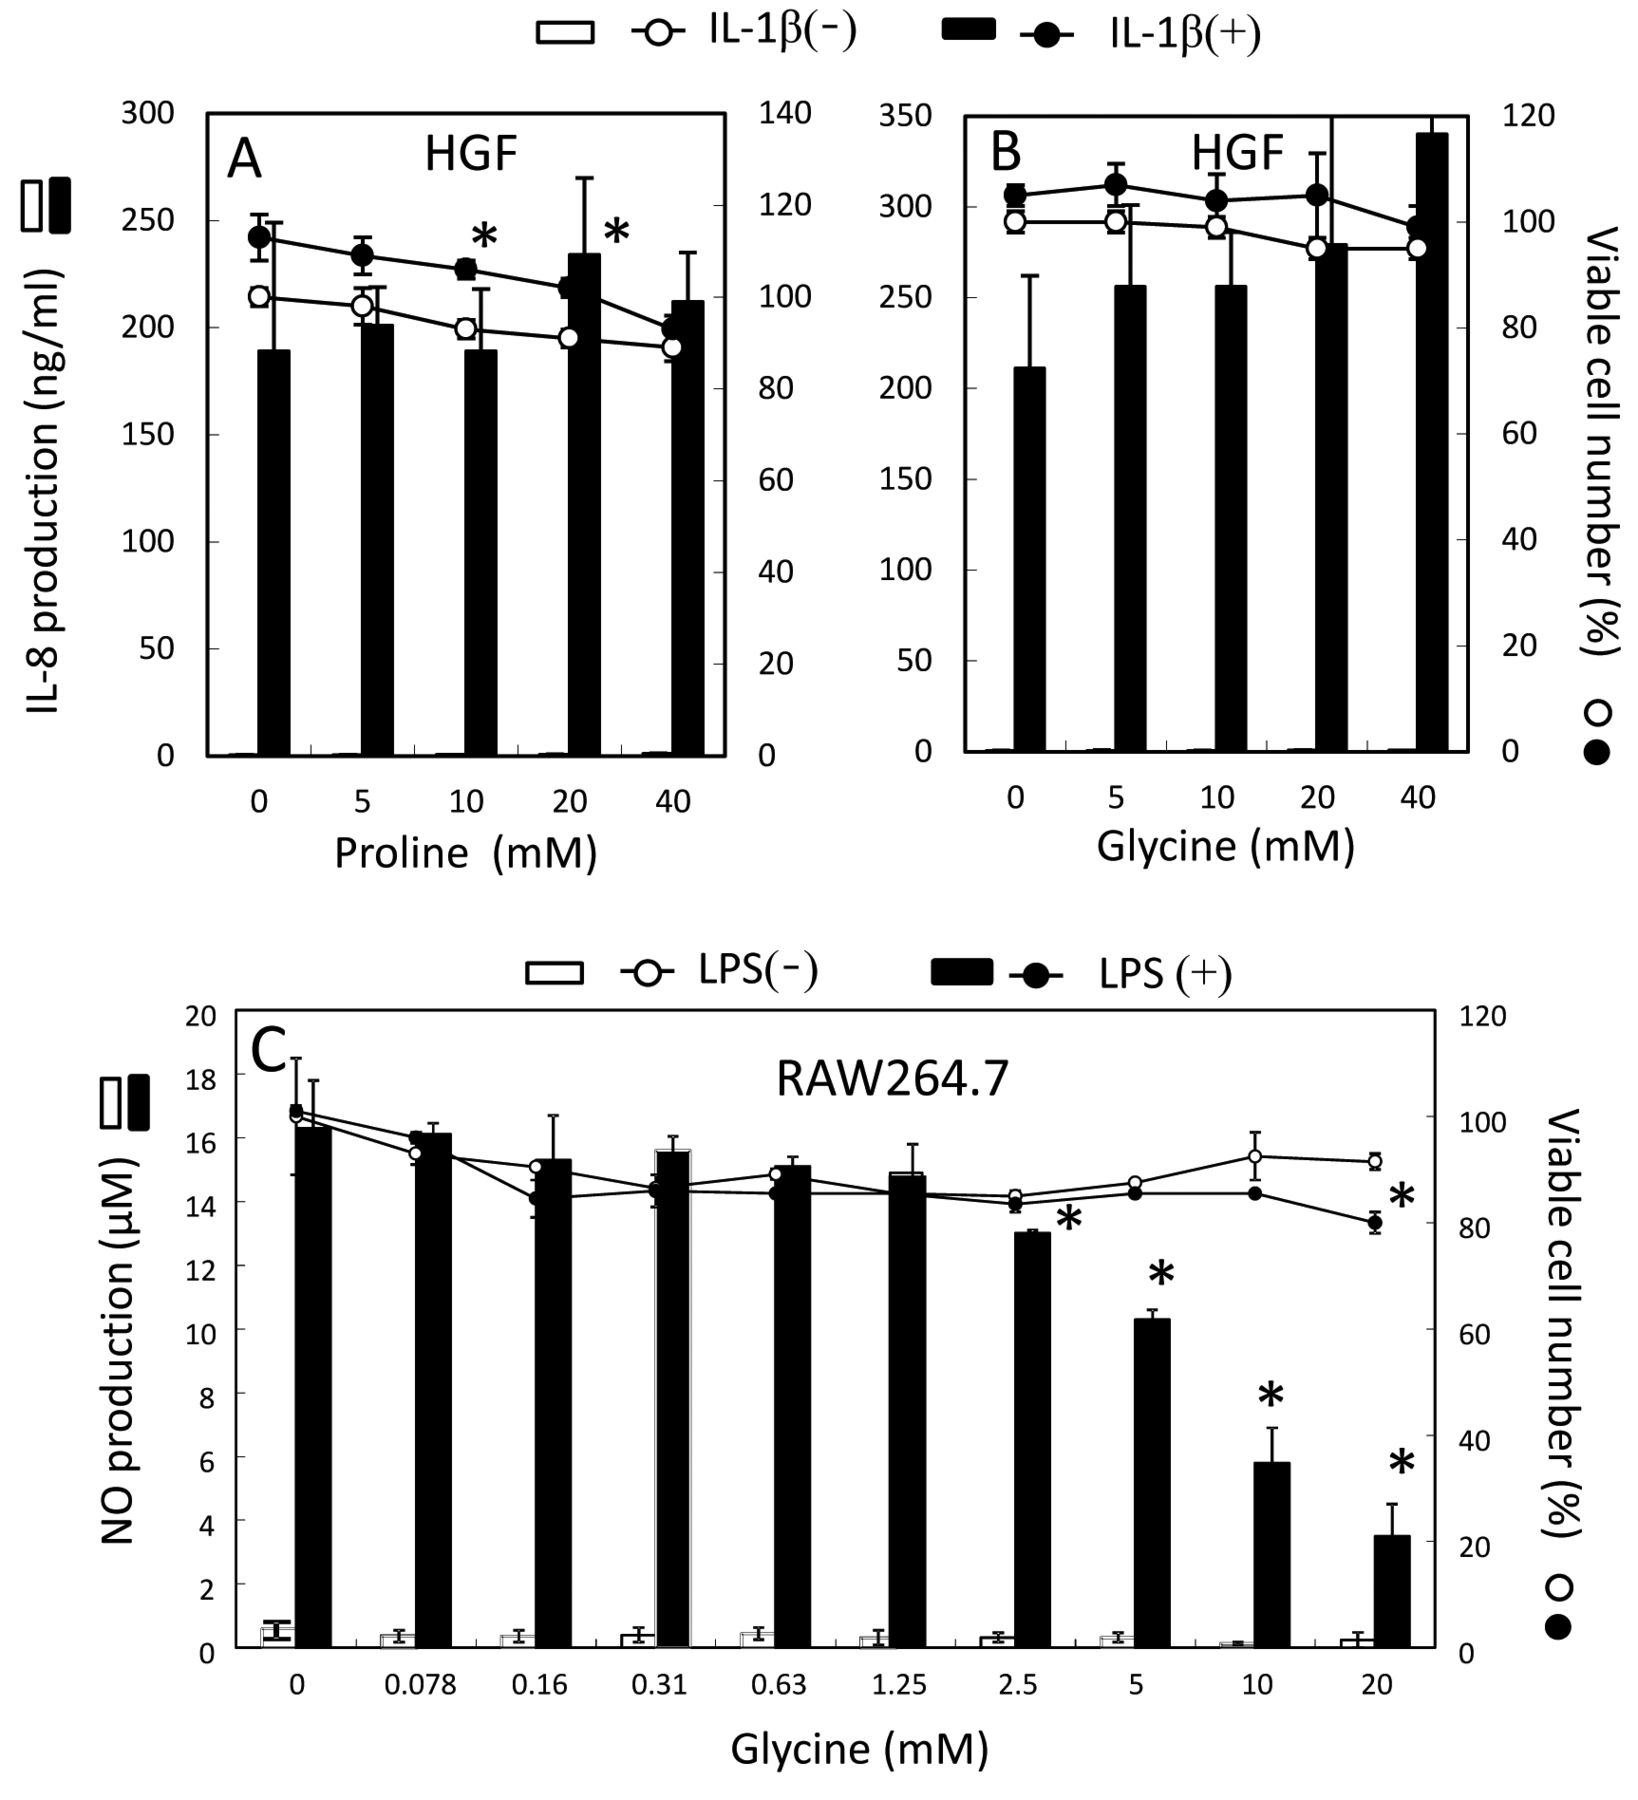
Effect of proline and glycine on the production of pro-inflammatory substances. HGF cells were treated for 24 h with the indicated concentrations of proline (A) or glycine (B), production of IL-8 and viable cell number were determined. RAW264.7 cells were treated for 24 h with the indicated concentrations of glycine, and production of NO and viable cell number was determined (C). Each value represents mean±S.D. of triplicate determinations.
Discussion
The present study demonstrated for the first time that: (i) normal mesenchymal oral cells (HGF, HPC, HPLF) produced higher amounts of most of amino acids per given number of cells, compared to oral squamous cell carcinoma cell lines, (ii) these mesenchymal cells produced much lower amounts of glycine and proline, compared to glutamic acid and glutamine, (iii) inflammation induction by either LPS or IL-1β dramatically increased the production of glutamic acid and glutamine, but not that of lycine and proline, and (iv) glycine and proline at millimolar concentrations did not significantly affect the IL-8 production (Step 3). These data suggest that normal oral messenchymal cells are a poor supplier of glycine and proline to oral environment. The secretion of glycine and proline into the extracellular milieu in the terminal phase of aging messenchymal cells remains to be investigated.
Effect of inflammation-stimulators on the production of amino acids in human oral messenchymal cells. Each value represents the increase in production rate of the indicated six amino acids, calculated by subtracting the value of unstimulated cells in Figure 4.
Reactive oxygen species (ROS) and reactive nitrogen species (RNS) induce extracellular matrix (ECM) degradation, and initiate and propagate the aging process (15). Coenzyme (Co)Q10, a popular cellular antioxidant, maintains a proper energy level in mitochondria, protects the cells from UV-mediated oxidative stress, influences, via a gene induction mechanism, the synthesis of some key proteins of the skin and to decrease the expression of some metalloproteinase such as collagenase (8). The decline of CoQ10 may activate the cellular collagenases leading to the loss of collagen content.
We found the opposing effects of glycine on the fibroblasts and macrophages. This may be explained by the fact that HGF cells may lack the cellular mechanism for NO and TNF-α-induction (14).
In conclusion, the present study suggest that the elevated glycine and proline in the saliva of elder persons are not provided by oral cells (Step 1), but rather resulted from the deregulation of collagen metabolism (Step 2) (16, 17) (Figure 1).
Acknowledgements
This work was supported by Grant-in-Aid for Challenging Exploratory Research from The Ministry of Education, Culture, Sports, Science and Technology (Sakagami H. 25670897).
Footnotes
Conflicts of Interest
The Authors wish to confirm that there are no known conflicts of interest associated with this publication and there was no significant financial support for this work that could have influenced its outcome.
- Received November 9, 2015.
- Revision received December 26, 2015.
- Accepted January 4, 2016.
- Copyright © 2016 International Institute of Anticancer Research (Dr. John G. Delinassios), All rights reserved
References
In this issue


Jump to section
Related Articles
Cited By...
- No citing articles found.