


Abstract
Aim: To examine the relationship between longitudinal quality of life (QOL) change, as assessed by the 36-Item Short Form Health Survey (SF-36), sarcopenia-related factors and body composition in patients with chronic liver diseases (CLDs). Patients and Methods: Data from patients with CLDs (n=184) were retrospectively analyzed, focusing on factors associated with the difference of physical and mental component summary score (PCS and MCS) in SF-36 between the two visits (ΔPCS and ΔMCS). The difference of serum albumin level, body mass index (BMI), arm circumference, arm muscle circumference, grip strength (GS), skeletal muscle index, extracellular to total body water ratio between the two visits were included into the multiple regression analysis. Results: Δalbumin (p=0.0325) and ΔGS (p<0.0001) were independent factors linked to ΔPCS. Δalbumin (p=0.0005) and ΔBMI (p=0.0232) were independent factors linked to ΔMCS. Conclusion: Significance of serum albumin level, muscle strength and body composition on health-related QOL in CLD patients should be emphasized.
Skeletal muscle is an “endocrine organ” that secretes myokines, which regulate glucose and lipid homeostasis throughout the body as well as protein synthesis in muscle tissue (1). Sarcopenia is a condition accompanied by decrease of skeletal muscle mass (SMM) and strength or physical function (2, 3). Regarding mechanisms of developing sarcopenia in patients with chronic liver diseases (CLDs), the involvement of numerous factors (aging, protein energy malnutrition, insulin resistance, signal transduction related to SMM protein synthesis and degradation, myokines, and sex hormones, etc.) can be considered (4-6). Sarcopenia can also result in health-related quality of life (QOL) decline and be linked to poor outcomes in CLD patients (4, 7-9). The most widely accepted evaluation tool for patient health-related QOL is the 36-Item Short Form Health Survey (SF-36, self-reported questionnaire) (10-12). On the other hand, body composition analysis can be suitable for the evaluation of nutritional status in routine clinical settings as it involves simple and minimally invasive procedures (13, 14).
QOL decline in patients with nonalcoholic fatty liver disease was reported to be associated with body composition (15). A decrease in arm circumference (AC) or arm muscle circumference (AMC), which are indicators of hypoalbuminemia and energy deficiency, can adversely affect the prognosis of cirrhotic patients (16). Extracellular water (ECW) to total body water (TBW) ratio (ECW/TBW) using bioelectrical impedance analysis (BIA), which reflects the severity of edematous status in the cell, can reflect the severity of liver fibrosis and be a prognostic marker for cirrhotic patients (17).
In our preceding cross-sectional study, we reported the relationship between sarcopenia-related factors (i.e., muscle strength and muscle mass) and QOL decline in CLD patients (18). However, factors associated with longitudinal QOL change in CLD patients are not largely unknown. To clarify these problems, we sought to examine the relationship between longitudinal QOL change and sarcopenia-related factors and body composition data, in CLD patients.
Patients and Methods
Patients. A total of 184 CLD individuals who visited Hyogo College of Medicine Hospital between December 2013 and April 2018 were analyzed using a retrospective computerized database. All analyzed patients were periodically followed during the observation period. Clinical features, data for SF-36 and body composition and laboratory findings recorded at baseline (first visit for the assessment of QOL using SF-36) and second visit for the assessment of QOL using SF-36 were collated. Diagnosis for cirrhosis was determined according to the current guidelines (19). The most suitable intervention for each underlying liver disease was performed (19-22).
SF-36. All patients were asked to complete the Japanese version of the SF-36. The Japanese version of the SF-36 is classified into multi-item (eight items) scales: physical functioning, role physical, bodily pain, general health perception, vitality, social functioning, role emotion, and mental health (23). Based on these 8 scales, the physical component summary score (PCS) and the mental component summary score (MCS) were calculated for each patient.
Muscle strength and muscle mass measurement. At first visit and second visit, measurements of muscle strength [grip strength (GS) in this study] and SMM were also performed based on previous reports (3). For the evaluation of SMM, BIA was performed using InBody 720 (InBody Japan ltd., Tokyo, Japan) to calculate appendicular muscle mass. Skeletal muscle index (SMI) was calculated as sum of SMM in upper and lower extremities divided by height squared (kg/m2).
Variables analyzed. The analyzed variables were PCS, MCS, serum albumin level (g/dl), body mass index (BMI, kg/m2), AC (cm), AMC (cm), GS (kg), SMI (kg/m2), ECW/TBW in BIA. Differences between the two visits (value at second visit – value at first visit) were calculated for PCS, MCS, serum albumin level, BMI, AC, AMC, GS, SMI and ECW/TBW (ΔPCS, ΔMCS Δalbumin, ΔBMI, ΔAC, ΔAMC, ΔGS, ΔSMI and ΔECW/TBW, respectively). Correlation of ΔPCS and ΔMCS with Δalbumin, ΔBMI, ΔAC, ΔAMC, ΔGS, ΔSMI, and ΔECW/TBW were retrospectively examined. Factors associated with ΔPCS and ΔMCS were also tested using multiple regression analysis (Figure 1).
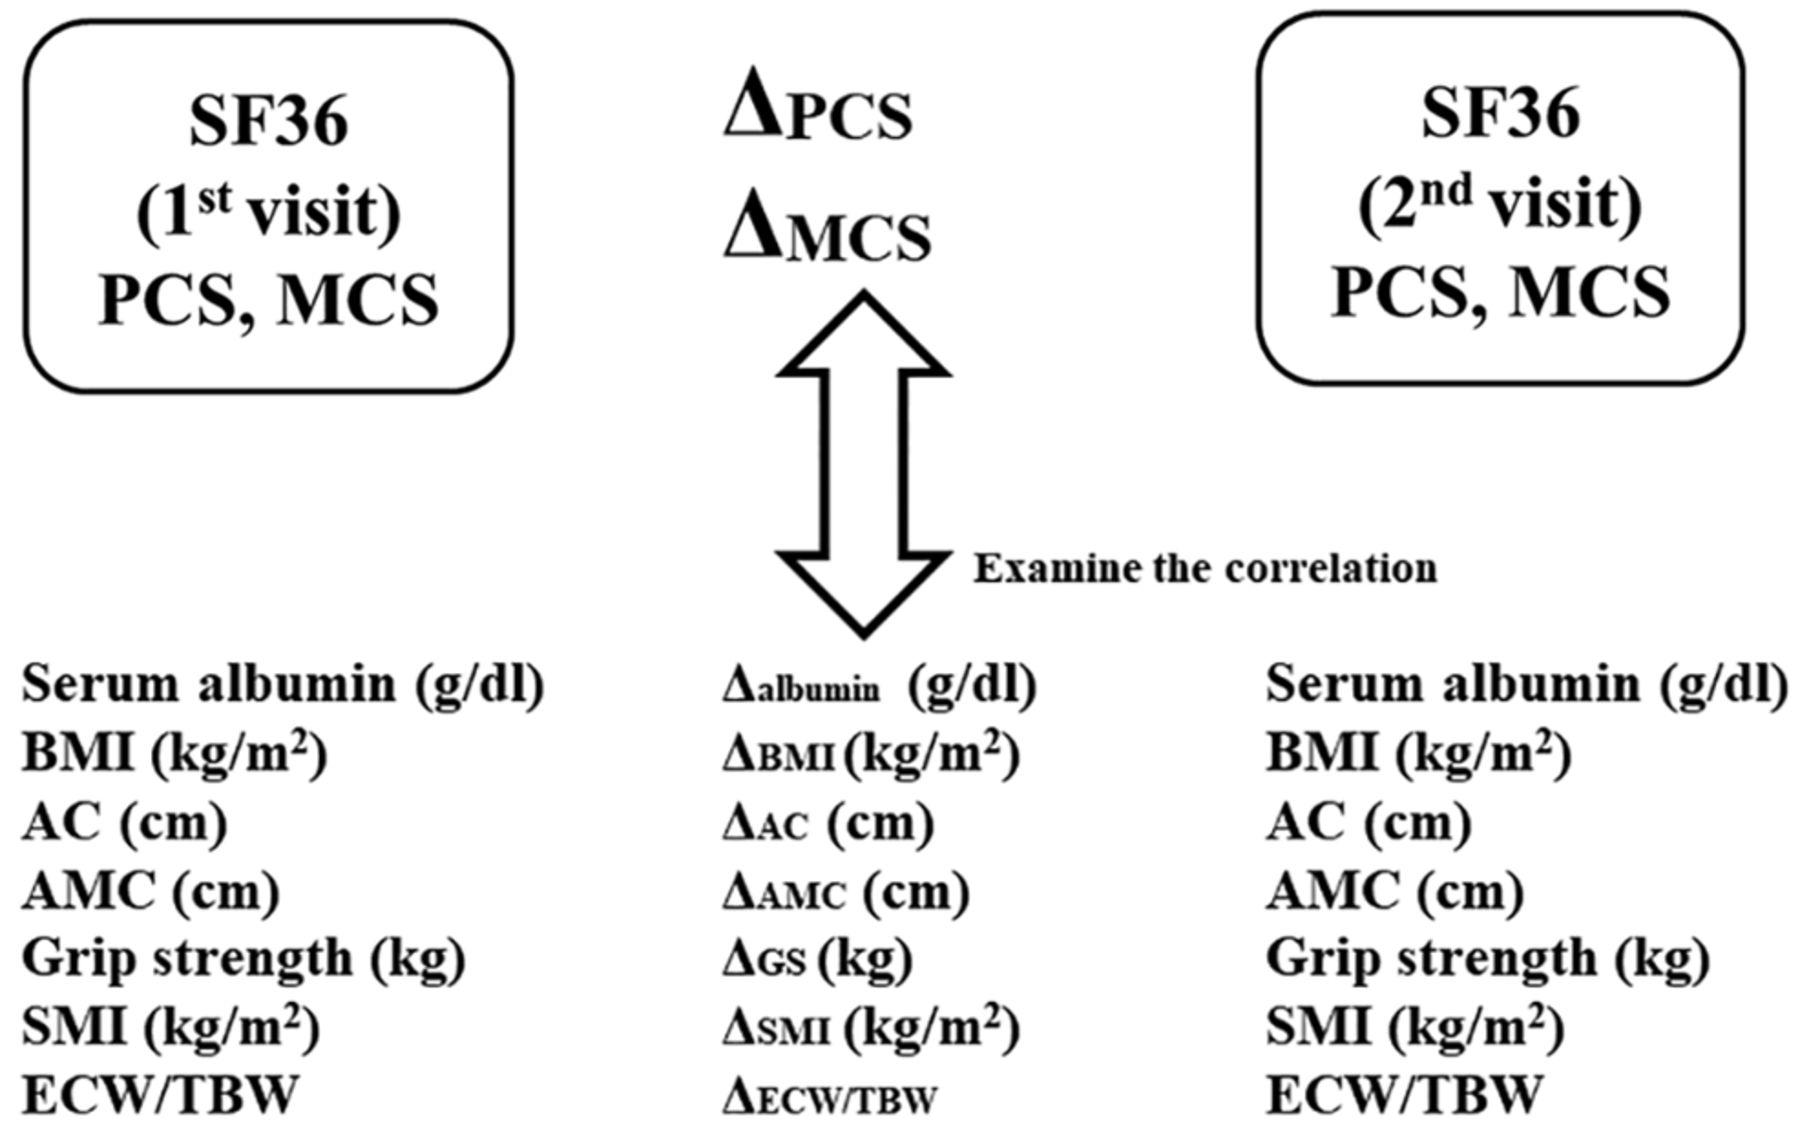
Our study design. PCS, Physical component summary score; MCS, mental component summary score; BMI, body mass index; AC, arm circumference; AMC, arm muscle circumference; GS, grip strength; SMI, skeletal muscle index; ECW/TBW, extracellular water to total body water ratio. Differences between the two visits (value at second visit – value at first visit) were calculated for PCS, MCS, serum albumin level, BMI, AC, AMC, GS, SMI and ECW/TBW (ΔPCS, ΔMCS Δalbumin, ΔBMI, ΔAC, ΔAMC, ΔGS, ΔSMI and ΔECW/TBW, respectively).
The study protocol rigorously conformed to the 1975 Helsinki Declaration, and approval of ethics was obtained from the institutional review board in our hospital (approval number: 2296). An opt out method was employed.
Statistical analysis. Continuous variables were presented as mean value (±standard deviation (SD). Normality was assessed by Shapiro-Wilk test and comparison of continuous variables was performed using the Pearson correlation coefficient r. Multivariate regression analysis with multiple predictive factors (least squares method) was used to identify candidate factors. The JMP version 14.0 software (SAS Institute, Cary, NC, USA) was employed to analyze data statistically (significant level, p-value below 0.05).
Results
Patient characteristics. Of the 184 CLD patients, 84 (45.7%) were men, and the mean age was 62.0±11.8 years. There were 138 patients (75.0%) with non-cirrhosis and 46 patients (25.0%) with cirrhosis. There was no patient with overt hepatic encephalopathy, hepatocellular carcinoma, or severe ascites at baseline. The main liver disease etiology was hepatitis C virus (157 cases, 85.3%). The mean time interval between baseline (first visit) and second visit was 1.2±1.0 years. The mean PCS and MCS at baseline were 46.7±12.2 and 51.9±9.2, respectively. The baseline clinical characteristics and laboratory data of all analyzed patients are summarized in Table I.
Baseline characteristics (n=184).
Correlation between ΔPCS and ΔMCS and Δalbumin, ΔBMI, ΔAC, ΔAMC, ΔGS, ΔSMI, and ΔECW/TBW for all cases. The mean ΔPCS and ΔMCS for all cases were 0.4±10.4 and –0.6±8.4, respectively. ΔPCS did not significantly correlate with ΔMCS (r=0.10, p=0.1585) (Figure 2). The mean Δalbumin, ΔBMI, ΔAC, ΔAMC, ΔGS, ΔSMI, and ΔECW/TBW for all cases were 0.1±0.3 g/dl, –0.2±1.0 kg/m2, –0.2±1.1 cm, –1.3±1.9 cm, –0.1±3.1 kg, –0.03±0.28 kg/m2, and 0.0003±0.005, respectively.

Correlation between ΔPCS and ΔMCS for all cases (n=184).
Δalbumin (r=0.28, p=0.0001), ΔBMI (r=0.22, p=0.0027), ΔAC (r=0.29, p<0.0001), ΔGS (r=0.41, p<0.0001), and ΔECW/TBW (r=–0.17, p=0.0230) significantly correlated with ΔPCS. Δalbumin (r=0.30, p<0.0001) and ΔBMI (r=0.16, p=0.0252) had significant correlation with ΔMCS (Table II).
Correlation of ΔPCS and ΔMCS with Δalbumin, ΔBMI, ΔAC, ΔAMC, ΔGS, ΔSMI and ΔECW/TBW for all cases.
Correlation between ΔPCS and ΔMCS and Δalbumin, ΔBMI, ΔAC, ΔAMC, ΔGS, ΔSMI, and ΔECW/TBW for liver cirrhosis (LC) cases (n=46). The mean ΔPCS and ΔMCS for LC cases were 2.8±13.0 and 0.3±8.1, respectively. The mean Δalbumin, ΔBMI, ΔAC, ΔAMC, ΔGS, ΔSMI, and ΔECW/TBW for LC cases were 0.2±0.4 g/dl, 0.2±1.2 kg/m2, 0.1±1.2 cm, –1.4±1.8 cm, 0.4±3.6 kg, –0.1±0.4 kg/m2, and –0.001±0.006, respectively. Δalbumin (r=0.39, p=0.0074), ΔAC (r=0.34, p=0.0209), and ΔGS (r=0.49, p=0.0006) significantly correlated with ΔPCS. Δalbumin (r=0.49, p=0.0006) and ΔGS (r=0.34, p=0.0212) had significant correlation with ΔMCS (Table III).
Correlation of ΔPCS and ΔMCS with Δalbumin, ΔBMI, ΔAC, ΔAMC, ΔGS, ΔSMI and ΔECW/TBW for LC cases and non-LC cases.
Correlation between ΔPCS and ΔMCS and Δalbumin, ΔBMI, ΔAC, ΔAMC, ΔGS, ΔSMI, and ΔECW/TBW for non-LC cases (n=138). The mean ΔPCS and ΔMCS for non-LC cases were –0.4±9.3 and –0.9±8.5, respectively. The mean Δalbumin, ΔBMI, ΔAC, ΔAMC, ΔGS, ΔSMI, and ΔECW/TBW for non-LC cases were 0.03±0.28 g/dl, –0.3±1.0 kg/m2, –0.3±1.1 cm, –1.3±1.9 cm, –0.3±2.9 kg, –0.01±0.23 kg/m2, and 0.0008±0.004, respectively.
Δalbumin (r=0.17, p=0.0494), ΔBMI (r=0.27, p=0.0013), ΔAC (r=0.24, p=0.0041), ΔGS (r=0.35, p<0.0001), and ΔSMI (r=–0.18, p=0.0313) significantly correlated with ΔPCS. Δalbumin (r=0.21, p=0.0118) and ΔBMI (r=0.18, p=0.0320) had significant correlation with ΔMCS (Table III).
Correlation between ΔPCS and ΔMCS and Δalbumin, ΔBMI, ΔAC, ΔAMC, ΔGS, ΔSMI, and ΔECW/TBW for male cases (n=84). The mean ΔPCS and ΔMCS for male cases were –0.4±8.9 and –1.2±8.1, respectively. The mean Δalbumin, ΔBMI, ΔAC, ΔAMC, ΔGS, ΔSMI, and ΔECW/TBW for male cases were 0±0.34 g/dl, –0.03±1.0 kg/m2, –0.3±1.1 cm, –1.2±1.7 cm, –0.2±3.5 kg, –0.03±0.29 (kg/m2), and 0.0004±0.005, respectively.
Δalbumin (r=0.30, p=0.0048), ΔAC (r=0.25, p=0.0201), and ΔGS (r=0.40, p=0.0002) significantly correlated with ΔPCS. Δalbumin (r=0.28, p=0.010) had significant correlation with ΔMCS (Table IV).
Correlation of ΔPCS and ΔMCS with Δalbumin, ΔAC, ΔAMC, ΔGS, ΔSMI and ΔECW/TBW for LC male and female.
Correlation between ΔPCS and ΔMCS and Δalbumin, ΔBMI, ΔAC, ΔAMC,ΔGS,ΔSMI, and ΔECW/TBW for female cases (n=100). The mean (±SD) ΔPCS and ΔMCS for female cases were 1.0±11.5 and 0±8.6, respectively. The mean (±SD) Δalbumin, ΔBMI, ΔAC, ΔAMC, ΔGS, ΔSMI, and ΔECW/TBW for female cases were 0.1±0.32 g/dl, –0.3±1.1 kg/m2, –0.2±1.1 cm, –1.4±2.0 cm, 0±2.8 kg, –0.03±0.27 kg/m2, and 0.0002±0.004, respectively.
Δalbumin (r=0.26, p=0.0091), ΔBMI (r=0.25, p=0.0135), ΔAC (r=0.31, p=0.0014), ΔGS (r=0.43, p<0.0001), and ΔSMI (r=0.24, p=0.0169) significantly correlated with ΔPCS. Δalbumin (r=0.31, p=0.0017) and ΔAMC (r=–0.21, p=0.0360) had significant correlation with ΔMCS (Table IV).
Multiple regression analysis linked to ΔPCS and ΔMCS for all cases. Results for multiple regression analysis associated with ΔPCS and ΔMCS are shown in Table V. Δalbumin (p=0.0325) and ΔGS (p<0.0001) were independent factors linked to ΔPCS. Δalbumin (p=0.0005) and ΔBMI (p=0.0232) were independent factors linked to ΔMCS.
Multiple regression analysis linked to ΔPCS and ΔMCS.
Discussion
In 1946, the WHO proposed that “health indicates a state of very good and stable physical, psychological and social well-being and not merely the absence of disease” (18). By recent years, there have been changes in the medical and social context, such as changes in the structure of diseases, the achievement of longevity, and a re-evaluation of the value of living well. In this context, the concept of health-related QOL has developed and gained importance as a goal of treatment and care. QOL improvement is now an indispensable perspective in the medical and health care fields. As far as we are aware, longitudinal studies in CLD patients focusing on sarcopenia-related factors and body composition in QOL research are rare. As CLD generally involves long disease duration and a lot of liver disease-related events are expected to occur during the clinical course, this study focusing on changes of QOL is considered to be of clinical importance. In CLD patients, hepatic events or severity of liver fibrosis as well as aging can be associated with QOL decline (24). However, in our data, ΔPCS did not significantly correlate with ΔMCS (r=0.10). Factors linked to ΔPCS and ΔMCS should be therefore analyzed separately. There were 92 patients (50.0%) with ΔPCS>0 and 85 patients (46.2%) with ΔMCS>0 in our data. Various interventions for underlying liver diseases were done in our cohort, and appropriate interventions may improve QOL in CLD patients.
In the current study, comprehensive analyses regarding the impact of sarcopenia-related factors and body composition data on the longitudinal QOL change in patients with CLDs were performed. Multiple regression analysis identified Δalbumin and ΔGS as significant factors linked to ΔPCS, and Δalbumin and ΔBMI as significant factors linked to ΔMCS. To conclude, a decline of serum albumin level can be helpful for QOL decline both physically and mentally, and reduced GS rather than SMM can be linked to physical QOL decline, while reduced BMI can result in mental QOL decline in CLD patients. Serum albumin level, GS, and BMI can be easily obtained in daily clinical practice. Thus, our results appear to be clinically meaningful, and when these markers worsen in CLD patients, clinicians should be aware of QOL decline. On the other hand, AC reflects SMM and fat mass, while AMC reflects SMM (16). Both markers were not significant in multiple regression analysis, however, ΔAC significantly correlated with ΔPCS for all cases and for all subgroups in the univariate analysis. Hence, anthropometric assessment in CLD patients can be essential for the change of physical condition.
It is unclear why the decline of muscle strength can better predict the exacerbation of physical QOL in patients with CLDs, compared to SMM decline. One possible reason is that muscle strength decline occurs 2-5 times faster than SMM loss, which can be linked to the physical QOL decline (25). Another possible reason is that muscle strength decline is associated with hormonal changes such as insulin-like growth factors 1 and testosterone, potentially resulting in exacerbation of physical condition (26). GS can be a representative marker for whole-body muscle strength and has been shown to be an independent marker of nutrition (27). However, in non-LC patients and in female patients, ΔSMI significantly correlated with ΔPCS. While the present study emphasizes the importance of GS on the deterioration of physical condition, it does not deny the importance of SMM on physical QOL.
The limitations of our study must be acknowledged. First, the retrospective nature of the study limits the evaluation of factors influencing QOL such as life circumstances. Second, SF-36 is a subjective assessment tool, and not objective one, and CLDQ questionnaires specific to QOL in CLD patients were not used in this study (28). Third, our data were based on Japanese CLD patient data; further studies on other cohorts will be needed to extend the application. Finally, several interventions for CLD patients in the observation period have been performed, creating bias for QOL decline. Thus, interpretation with caution to the results will be needed. However, our results denoted that chronological decline of serum albumin or GS was associated with a decline in physical QOL and chronological decline of serum albumin or BMI was associated with a decline in mental QOL.
In conclusion, decreased serum albumin level, muscle strength decline and poor body composition can be associated with QOL decline in CLD patients. Therefore, we would like to emphasize the significance of these factors in health-related QOL in CLD patients.
Acknowledgements
The Authors would like to thank Yasuko Higuchi in our hospital for the anthropometry measurement. This work was partly supported by Hyogo Innovative Challenge, Hyogo College of Medicine, Japan.
Footnotes
↵* These Authors contributed equally to this work.
Authors’ Contributions
Data curation, H.N., K.Y., H.E., and T.N.; Formal analysis, H.N.; Supervision, S.N. and H.I.; Writing – original draft, H.N. and K.Y.; Writing – review & editing, H.E.; Final approval, all authors.
This article is freely accessible online.
Conflicts of Interest
Nothing to declare.
- Received January 29, 2021.
- Revision received April 12, 2021.
- Accepted April 19, 2021.
- Copyright © 2021 International Institute of Anticancer Research (Dr. George J. Delinasios), All rights reserved


